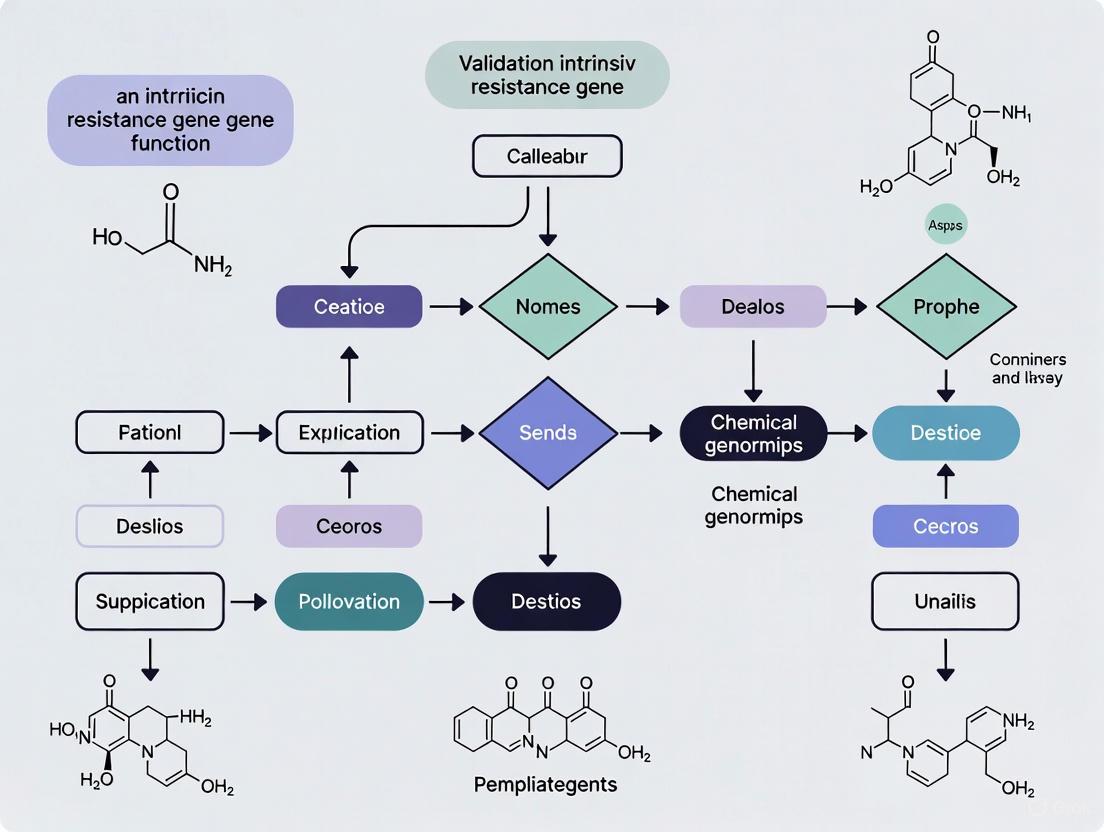
Validating Intrinsic Resistance Gene Function: From Mechanistic Insights to Therapeutic Breakthroughs
This article provides a comprehensive resource for researchers and drug development professionals on the validation of intrinsic antibiotic resistance gene function.
Validating Intrinsic Resistance Gene Function: From Mechanistic Insights to Therapeutic Breakthroughs
Abstract
This article provides a comprehensive resource for researchers and drug development professionals on the validation of intrinsic antibiotic resistance gene function. It explores the fundamental mechanisms bacteria employ for innate defense, details cutting-edge computational and experimental methodologies for gene identification and characterization, addresses critical challenges in resistance-proofing strategies, and presents advanced validation frameworks. By synthesizing recent advances from genetic screens, machine learning, and evolutionary studies, this review aims to bridge the gap between basic resistance mechanisms and the development of novel therapeutic interventions to combat the global antimicrobial resistance crisis.
Decoding the Genomic Arsenal: Fundamental Mechanisms of Intrinsic Resistance
The intrinsic resistome encompasses the complete set of chromosomal genes in a bacterium that contributes to its innate ability to survive antibiotic treatment, independent of acquired resistance mechanisms such as horizontal gene transfer or mutations [1]. This concept represents a fundamental shift in how we perceive and investigate antimicrobial resistance (AMR). Unlike acquired resistance, which develops through specific genetic changes in response to antibiotic pressure, intrinsic resistance is a natural and heritable characteristic of a bacterial species, encoded by its core genome and present in virtually all members of that species [1] [2]. These intrinsic defense systems form the bacterial cell's first line of defense against antimicrobial agents, creating a critical barrier that antibiotics must overcome to achieve therapeutic efficacy.
Understanding the intrinsic resistome is not merely an academic exercise—it represents a paradigm shift in antibiotic discovery and resistance mitigation strategies. The genes constituting the intrinsic resistome regulate fundamental cellular processes including membrane permeability, drug efflux, antibiotic inactivation, and target modification [1] [2]. By defining and characterizing these core chromosomal defense systems, researchers can identify novel targets for adjuvant therapies that could potentiate existing antibiotics, resensitize resistant pathogens, and potentially slow the evolution of resistance [2]. This approach is particularly crucial for addressing multidrug-resistant Gram-negative pathogens, where intrinsic resistance mechanisms synergize with acquired resistance genes to create formidable therapeutic challenges [2]. The systematic exploration of the intrinsic resistome therefore represents a frontier in combating the global AMR crisis, offering strategies to breach the innate cellular defenses that make many bacterial infections difficult to treat.
Core Defense Mechanisms of the Intrinsic Resistome
The intrinsic resistome encompasses several fundamental cellular defense strategies that work in concert to protect bacteria from antimicrobial compounds. These mechanisms are chromosomally encoded and represent the evolutionary adaptations of bacterial species to survive in antibiotic-producing environments and other hostile conditions.
Table: Core Mechanisms of the Intrinsic Resistome
| Mechanism | Functional Role | Examples | Impact |
|---|---|---|---|
| Reduced Drug Influx | Limits antibiotic penetration through cellular envelopes | Outer membrane impermeability in Gram-negative bacteria; porin alterations [1] | Creates physical barrier to intracellular antibiotic accumulation |
| Active Drug Efflux | Expels antibiotics from cell using transporter systems | AcrAB-TolC multidrug efflux pump in E. coli [2] | Reduces intracellular drug concentration below inhibitory levels |
| Target Modification | Alters antibiotic binding sites through mutation or protection | Natural variation in drug targets; ribosomal protection [1] | Prevents antibiotic binding to cellular targets |
| Enzymatic Inactivation | Degrades or modifies antibiotics to render them ineffective | Chromosomal β-lactamases; aminoglycoside-modifying enzymes [1] | Chemically neutralizes antibiotics before they reach targets |
The reduced permeability of the Gram-negative outer membrane, particularly due to lipopolysaccharides (LPS), provides a formidable barrier to numerous antibiotic classes [1]. This intrinsic characteristic explains why antibiotics like vancomycin, effective against Gram-positive bacteria, demonstrate poor activity against Gram-negative organisms—the large glycopeptide molecules cannot efficiently traverse the outer membrane [1]. Similarly, the intrinsic resistance of anaerobic bacteria to aminoglycosides stems from their lack of the oxidative metabolism required for antibiotic uptake, while aerobic bacteria resist metronidazole because they cannot reduce the drug to its active form [1].
Efflux pump systems represent another cornerstone of intrinsic resistance, with multidrug efflux pumps like AcrB in E. coli contributing significantly to baseline resistance levels [2]. These constitutively expressed transporters recognize and extrude diverse antimicrobial compounds, maintaining intracellular concentrations below inhibitory thresholds. The critical role of these systems is demonstrated by the marked hypersensitivity observed in knockout strains; for instance, E. coli with deleted acrB genes show dramatically increased susceptibility to multiple antibiotic classes [2]. Beyond these well-characterized mechanisms, intrinsic resistance also arises from natural variations in antibiotic targets and low-level expression of chromosomal enzymes capable of antibiotic modification [1].
Figure 1: Core Defense Mechanisms of the Intrinsic Resistome. The diagram illustrates how chromosomal genes provide innate protection through multiple complementary strategies that prevent antibiotics from reaching or engaging their cellular targets.
Methodologies for Intrinsic Resistome Characterization
Genomic and Genetic Approaches
Systematic identification of intrinsic resistance genes relies on sophisticated bioinformatic and genetic tools that enable comprehensive analysis of bacterial genomes and gene functions. The development of specialized databases and computational algorithms has been instrumental in advancing this field.
Table: Key Bioinformatics Tools for Resistome Analysis
| Tool/Database | Primary Function | Applications in Resistome Research | Key Features |
|---|---|---|---|
| AMRFinder | Identifies AMR genes in whole-genome sequences [3] | Detection of known resistance determinants in genomic data | Uses curated AMR gene database with hidden Markov models (HMMs) [3] |
| CARD (Comprehensive Antibiotic Resistance Database) | Catalogs resistance genes and mechanisms [4] | Reference database for annotating putative resistance genes | Antibiotic Resistance Ontology (ARO) for mechanistic classification [4] |
| ResFinder/ PointFinder | Detects acquired resistance genes and chromosomal mutations [4] | Differentiation between acquired and intrinsic resistance | Specialized in identifying point mutations conferring resistance [4] |
Genome-wide knockout screens represent a powerful functional genomics approach for mapping the intrinsic resistome. In these systematic studies, individual gene knockouts are screened for altered antibiotic susceptibility profiles, revealing which genes contribute to intrinsic resistance [2]. For example, a screen of the Keio collection of E. coli knockouts identified 35 genes that conferred hypersensitivity to trimethoprim when deleted, including genes involved in cell envelope biogenesis, membrane transport, and information transfer pathways [2]. Validation of these hits through growth assays on antibiotic-supplemented media confirmed that knockouts of acrB (efflux pump), rfaG, and lpxM (both involved in LPS biosynthesis) showed the most significant sensitization effects [2].
Pangenome-scale machine learning approaches have emerged as another powerful strategy for identifying AMR genes. One extensive analysis applied support vector machine (SVM) ensembles to 27,155 genomes across 12 pathogenic species, systematically learning relationships between genetic features and resistance phenotypes [5]. This data-driven approach successfully recovered 263 known AMR genes compared to 145 genes identified by conventional genome-wide association studies (GWAS), demonstrating superior performance in mapping the genetic landscape of antimicrobial resistance, including intrinsic components [5].
Experimental Validation Protocols
Hypersensitivity Strain Validation
- Strain Selection: Identify candidate genes from genomic screens (e.g., acrB, rfaG, lpxM for E. coli) [2].
- Genetic Engineering: Create clean gene deletions in wild-type background using recombineering or CRISPR-based methods.
- Phenotypic Confirmation: Measure MIC changes in knockout strains versus wild-type using broth microdilution according to CLSI/EUCAST guidelines.
- Specificity Assessment: Test against multiple antibiotic classes to distinguish between general and drug-specific resistance genes.
Evolutionary Rescue Experiments
- Experimental Evolution: Propagate hypersensitive knockout strains under sub-MIC antibiotic pressure for multiple generations [2].
- Resistance Monitoring: Track recovery of resistance through periodic MIC measurements.
- Genomic Analysis: Sequence evolved strains to identify compensatory mutations using whole-genome sequencing.
- Fitness Assessment: Compare growth rates of evolved strains with ancestral genotypes to measure fitness costs.
Figure 2: Experimental Workflow for Intrinsic Resistome Characterization. The process integrates computational genomics with functional validation and mechanistic studies to comprehensively map and verify core chromosomal defense systems.
Comparative Analysis of Intrinsic Resistance Pathways
The functional significance of different intrinsic resistance pathways can be evaluated through systematic genetic and evolutionary approaches. Knockout studies followed by phenotypic characterization provide direct evidence for the contribution of specific genes to intrinsic resistance, while evolutionary experiments reveal the adaptability and resilience of these systems.
Table: Functional Characterization of E. coli Intrinsic Resistance Genes
| Gene Target | Pathway | Antibiotic Hypersensitivity | Evolutionary Recovery Potential | Resistance-Proofing Utility |
|---|---|---|---|---|
| acrB | Multidrug efflux pump [2] | High (multiple classes) [2] | Limited under high drug pressure [2] | Promising target [2] |
| rfaG | LPS core biosynthesis [2] | Moderate to high [2] | Significant at sub-MIC concentrations [2] | Moderate utility [2] |
| lpxM | Lipid A modification [2] | Moderate to high [2] | Significant at sub-MIC concentrations [2] | Moderate utility [2] |
| nudB | Folate metabolism [2] | High (trimethoprim-specific) [2] | Drug-specific adaptation [2] | Limited to specific antibiotics [2] |
The comparative vulnerability of different intrinsic resistance pathways is particularly evident in evolutionary experiments. When E. coli knockout strains were subjected to trimethoprim pressure, strains with deleted efflux pumps (ΔacrB) showed the most compromised ability to evolve resistance, especially under high drug concentrations [2]. In contrast, strains with defects in cell envelope biogenesis (ΔrfaG and ΔlpxM) demonstrated substantial recovery potential at sub-inhibitory antibiotic concentrations [2]. This suggests that targeting efflux mechanisms may provide more durable resistance-proofing strategies compared to membrane permeabilization approaches.
The distribution of resistance genes across bacterial species reveals important patterns about their transferability and evolutionary origins. A global pathogenomic analysis of 27,155 genomes found that while 925 AMR genes were present in multiple species, only eight genes were found across multiple phylogenetic classes [5]. These widely distributed genes included TEM family beta-lactamases (blaTEM), ribosomal protection proteins (tetM, tetO, tetW/N/W), 23S rRNA methyltransferase (ermB), and aminoglycoside-modifying enzymes (aph(3')-IIIa) [5]. Notably, intrinsic resistance genes tend to be chromosomally encoded and show more restricted phylogenetic distribution compared to acquired resistance genes, which are frequently plasmid-borne and transfer across wider taxonomic boundaries.
Table: Key Research Reagents for Intrinsic Resistome Studies
| Reagent/Resource | Specifications | Research Application | Experimental Function |
|---|---|---|---|
| Keio Knockout Collection | ~3,800 single-gene deletions in E. coli K-12 BW25113 [2] | Genome-wide resistance gene screening | Identification of hypersensitive mutants through systematic phenotyping [2] |
| CARD Database | Antibiotic Resistance Ontology with curated gene families [4] | Reference for AMR gene annotation | Classification of resistance mechanisms and functional prediction [4] |
| AMRFinder Tool | HMM-based detection with curated reference database [3] | Identification of AMR genes in genomic data | High-accuracy genotypic prediction from sequence data [3] |
| PATRIC Database | Integrated genomic and phenotypic AMR data [5] | Large-scale comparative analysis | Source of validated genomes with paired resistance phenotypes [5] |
The systematic definition of the intrinsic resistome represents a fundamental advancement in our understanding of bacterial defense systems. Core chromosomal elements including efflux pumps, membrane barriers, and enzymatic activities collectively form a robust foundation of innate antibiotic resistance that operates independently of acquired mechanisms [1] [2]. The experimental approaches outlined—from genome-wide knockout screens to evolutionary validation—provide researchers with validated methodologies for identifying and characterizing these intrinsic resistance determinants across bacterial species.
The clinical implications of intrinsic resistome research are substantial. By targeting these core defense systems with adjuvant compounds, it may be possible to resensitize resistant pathogens to existing antibiotics [2]. The proof-of-concept demonstration that efflux pump inhibition can limit resistance evolution suggests that intrinsic resistance mechanisms represent valuable targets for "resistance-proofing" strategies [2]. Furthermore, the discovery that bacterial resistance systems can sometimes be exploited against the pathogen—as demonstrated by the engineered florfenicol prodrug that hijacks mycobacterial resistance machinery for activation—reveals novel therapeutic opportunities [6].
As surveillance technologies advance and datasets expand, the integration of machine learning approaches with functional genomics will likely accelerate the discovery of previously unrecognized intrinsic resistance elements [5]. The continuing characterization of the intrinsic resistome across diverse bacterial pathogens will provide a more comprehensive landscape of the core chromosomal defense systems that must be overcome to address the escalating antimicrobial resistance crisis.
In the relentless battle against antimicrobial resistance (AMR), understanding the fundamental mechanisms that protect bacteria from antibiotics is paramount for validating intrinsic resistance gene function and guiding drug development. Among the diverse strategies employed by bacteria, three major mechanistic classes stand out for their prevalence and clinical impact: efflux pumps, membrane permeability barriers, and enzymatic inactivation. These systems form a multi-layered defense network that either prevents antibiotics from reaching their intracellular targets, actively expels them, or chemically neutralizes their antibacterial activity. This guide provides an objective comparison of these mechanisms, supported by experimental data and methodologies relevant to researchers and scientists working on overcoming antibacterial resistance. The intricate interplay between these systems, where efflux pumps work synergistically with reduced membrane permeability and enzymatic degradation, creates formidable barriers that compromise therapeutic efficacy and contribute to the emergence of multidrug-resistant pathogens [7] [8] [9].
Comparative Analysis of Major Resistance Mechanisms
Table 1: Core Characteristics of Major Antibiotic Resistance Mechanisms
| Mechanistic Class | Primary Function | Key Genetic Components | Physiological Roles Beyond Antibiotic Resistance | Representative Pathogens |
|---|---|---|---|---|
| Efflux Pumps [7] [9] [10] | Active transport of antibiotics out of the cell | Genes encoding pump proteins (e.g., acrB, adeB) and regulators (e.g., adeRS) | Virulence, toxin extrusion, stress response (oxidative/nitrosative), quorum sensing, biofilm formation [7] [10] | Acinetobacter baumannii, Escherichia coli, Pseudomonas aeruginosa, Klebsiella pneumoniae [7] [8] [10] |
| Membrane Permeability [8] [2] | Reduction of antibiotic influx into the cell | Porin genes (e.g., ompK35, ompK36), lipopolysaccharide (LPS) biosynthesis genes (e.g., lpxM, rfaG) | Nutrient uptake, osmotic regulation, structural integrity, host-pathogen interactions [2] | Klebsiella pneumoniae, Escherichia coli, Pseudomonas aeruginosa [8] [2] |
| Enzymatic Inactivation [11] [12] | Chemical modification or degradation of antibiotics | Genes for antibiotic-modifying enzymes (e.g., β-lactamases, aminoglycoside-modifying enzymes) | Primary metabolic functions (e.g., cell wall biosynthesis in PBPs), general stress response [11] | Staphylococcus aureus, Enterobacteriaceae, Mycobacterium tuberculosis [11] |
Experimental Data and Performance Comparison
Table 2: Quantitative Impact on Antibiotic Susceptibility and Key Substrates
| Mechanistic Class | Exemplary System/Enzyme | Impact on Minimum Inhibitory Concentration (MIC) | Key Antibiotic Substrates | Experimental Evidence |
|---|---|---|---|---|
| Efflux Pumps [7] [8] | AdeABC (RND) in A. baumannii | Contributes to multi-to pan-drug resistance phenotypes [7] | Aminoglycosides, fluoroquinolones, β-lactams, tetracyclines, tigecycline, chloramphenicol, erythromycin, trimethoprim [7] | Deletion of acrB in E. coli caused hypersensitivity to trimethoprim and chloramphenicol; overexpression linked to increased MICs of multiple drug classes [2] |
| Membrane Permeability [8] [2] | Porin loss (OmpK35/OmpK36) in K. pneumoniae | Alone: Often minor MIC increase; combined with β-lactamases or efflux: significant MIC rise (e.g., non-susceptibility to ertapenem) [8] | Carbapenems (e.g., ertapenem), β-lactams [8] | lpxM or rfaG knockout E. coli showed hypersensitivity to multiple antibiotics; porin loss in β-lactamase-producing K. pneumoniae led to non-susceptibility to last-resort antibiotics [8] [2] |
| Enzymatic Inactivation [11] | PBP2a (MRSA) | Confers resistance to all β-lactams except ceftaroline/ceftobiprole [11] | Methicillin, oxacillin, other β-lactam antibiotics [11] | Expression of mecA (encoding PBP2a) in S. aureus allows transpeptidase activity and cell wall synthesis even in presence of inhibitory β-lactam concentrations [11] |
| Enzymatic Inactivation [11] | CTX-M-15 (ESBL) | High-level resistance to penicillins and cephalosporins [11] | Cefotaxime, ceftazidime, other oxyimino-cephalosporins [11] | Hydrolyzes β-lactam ring, preventing antibiotic binding to native PBPs; plasmid-mediated transmission in K. pneumoniae and E. coli [11] [8] |
Experimental Protocols for Mechanistic Validation
Protocol 1: Assessing Efflux Pump Activity and Inhibition
Objective: To quantify the contribution of efflux pumps to antibiotic resistance and evaluate the efficacy of Efflux Pump Inhibitors (EPIs).
- Strain Construction: Generate isogenic knockout mutants of target efflux pump genes (e.g., acrB in E. coli, adeB in A. baumannii) using gene replacement systems, such as the adapted Datsenko and Wanner method [8] [2]. Include complemented strains where the gene is reintroduced on a plasmid.
- Susceptibility Testing (Broth Microdilution):
- Determine the MIC of various antibiotics against the wild-type, mutant, and complemented strains according to CLSI guidelines [8].
- Repeat the MIC determination in the presence of a sub-inhibitory concentration of an EPI (e.g., 10-50 µg/mL Phe-Arg-β-naphthylamide (PAβN) or carbonyl cyanide m-chlorophenylhydrazone (CCCP)) [9]. A ≥4-fold decrease in MIC in the presence of the EPI indicates significant efflux activity.
- Gene Expression Analysis (Real-Time RT-PCR):
- Extract total RNA from bacterial cultures, treat with DNase I, and convert to cDNA [8].
- Perform quantitative PCR using primers specific to the efflux pump genes (e.g., acrB, oqxB) and reference genes (e.g., rpoB). Analyze data using the 2^–ΔΔCt method to determine fold-changes in expression compared to a control strain [8].
- Checkerboard Assay: To quantify synergy between an antibiotic and an EPI, perform a checkerboard broth microdilution assay. Calculate the Fractional Inhibitory Concentration (FIC) index to classify the interaction as synergistic, additive, or antagonistic [9].
Protocol 2: Evaluating Membrane Permeability Alterations
Objective: To investigate the role of porins and lipopolysaccharide (LPS) structure in reducing antibiotic influx.
- Genetic Manipulation: Create isogenic mutants with deletions in porin genes (ompK35, ompK36) or LPS biosynthesis genes (lpxM, rfaG) [8] [2].
- Antibiotic Susceptibility Profiling: Compare MICs of a panel of antibiotics (focusing on hydrophilic agents like β-lactams) between the wild-type and mutant strains. A significant MIC decrease in the mutant indicates the pathway's role in intrinsic resistance [2].
- Outer Membrane Protein (OMP) Analysis:
- Carbapenem Uptake Assay: Measure the intracellular accumulation of a fluorescent antibiotic or a compound like nitrocefin (a β-lactamase chromogenic substrate) in wild-type and porin-deficient strains over time, monitoring the signal intensity to infer uptake rates [8].
Protocol 3: Quantifying Enzymatic Inactivation of Antibiotics
Objective: To detect and characterize enzymes that inactivate antibiotics, such as β-lactamases.
- Phenotypic Detection Tests:
- Disk Diffusion or MIC: Test for synergy between a β-lactam antibiotic and a β-lactamase inhibitor (e.g., clavulanate). An increased zone diameter or a ≥3 twofold dilution decrease in the MIC of the antibiotic in combination with the inhibitor confirms enzyme activity [11].
- Carba NP Test: For carbapenemase detection, use this colorimetric assay where a pH change due to hydrolysis of imipenem causes a color shift, indicating enzymatic inactivation [11].
- Molecular Detection: Perform PCR amplification using primers specific for known resistance genes (e.g., mecA, blaCTX-M, blaKPC) on bacterial DNA to confirm their presence [11] [8].
- Enzyme Kinetics: Partially purify the enzyme of interest. Use a spectrophotometer to monitor the hydrolysis of the antibiotic substrate (e.g., decrease in absorbance for nitrocefin) over time to determine kinetic parameters like Vmax and Km [11].
Visualizing Resistance Pathways and Experimental Workflows
Diagram 1: Intrinsic Resistance Pathways
Diagram 2: Experimental Workflow for Validation
The Scientist's Toolkit: Essential Research Reagents
Table 3: Key Reagents for Investigating Antibiotic Resistance Mechanisms
| Reagent / Tool | Primary Function | Example Application | Key Consideration |
|---|---|---|---|
| Isogenic Mutant Strains [8] [2] | Controls for genetic background; enables direct comparison of gene function. | Comparing MIC of antibiotic in parent vs. acrB knockout strain to quantify pump contribution [2]. | Essential for controlling for confounding mutations in clinical isolates. |
| Efflux Pump Inhibitors (EPIs) [7] [9] | Chemically blocks efflux pump activity. | PAβN or CCCP used in combination with an antibiotic to test for MIC reduction and synergy [9]. | Some EPIs (e.g., CCCP) are toxic, limiting clinical use but valuable for in vitro research [9]. |
| β-Lactamase Inhibitors [11] | Inhibits activity of specific β-lactamase enzymes. | Clavulanate combined with amoxicillin in disks to detect ESBL production in disk diffusion tests [11]. | Specificity varies (e.g., clavulanate for ESBLs, avibactam for KPC). |
| Real-Time PCR Assays [8] | Quantifies gene expression levels. | Measuring adeB or ramA mRNA levels in resistant clinical isolates vs. susceptible controls [8]. | Requires careful normalization to stable reference genes (e.g., rpoB). |
| Antibodies for OMP Detection [8] | Immunodetection of specific outer membrane proteins. | Confirming loss of OmpK35/OmpK36 porins in carbapenem-resistant K. pneumoniae via Western blot [8]. | Specificity and quality of the antibody are critical for reliable results. |
| Saponin [13] | Selective detergent that increases membrane permeability. | Used in fixed cell models to study the specific effect of permeability on antibiotic diffusion without altering other cell properties [13]. | Useful for creating controlled experimental models of permeability alteration. |
Antimicrobial resistance (AMR) represents one of the most severe global health threats of our time, projected to cause 10 million deaths annually by 2050 if left unaddressed [14]. While acquired resistance through horizontal gene transfer often dominates discussions, intrinsic resistance forms the foundational barrier that dramatically limits treatment options, particularly for Gram-negative pathogens. This innate, chromosomally encoded resistance preexists antibiotic exposure and constitutes a significant component of what researchers term the "intrinsic resistome" [15]. The World Health Organization reports alarming resistance rates globally, with over 40% of E. coli and 55% of K. pneumoniae isolates resistant to third-generation cephalosporins—first-line treatments for severe bloodstream infections [16]. This review examines how intrinsic resistance mechanisms contribute to treatment failures and explores experimental approaches for identifying and targeting these fundamental barriers to effective therapy.
Defining Intrinsic Resistance and Its Mechanisms
Conceptual Framework
Intrinsic resistance refers to the innate ability of a bacterial species to withstand antibiotic action through its inherent structural or functional characteristics, independent of horizontal gene acquisition or mutation [17]. This contrasts with acquired resistance, which develops through genetic changes in response to antibiotic pressure. Intrinsic resistance is a universal trait within bacterial species, encoded by core chromosomal genes rather than mobile genetic elements [17]. The intrinsic resistome encompasses all chromosomal genes that contribute to this innate ability to limit antibiotic effectiveness [15].
Major Mechanistic Categories
Bacteria employ several core mechanisms to achieve intrinsic resistance, with Gram-negative pathogens exhibiting particular proficiency due to their complex cell envelope architecture:
- Reduced Permeability Barriers: The outer membrane of Gram-negative bacteria, with its asymmetric lipopolysaccharide (LPS) layer, significantly restricts antibiotic penetration. Modifications to LPS structure, such as the addition of 4-amino-4-deoxy-L-arabinose (L-Ara4N) in Proteus vulgaris, reduce membrane permeability to polymyxins [18].
- Efflux Pump Systems: Chromosomally encoded multidrug efflux pumps, such as AcrB in E. coli, actively export diverse antibiotics before they reach their intracellular targets [15]. These systems contribute substantially to intrinsic resistance to multiple drug classes.
- Drug-Modifying Enzymes: Some bacteria constitutively express enzymes that inactivate antibiotics, such as the Eis2 protein in Mycobacterium abscessus that modifies aminoglycosides [6].
- Target Modification and Protection: Natural structural variations in antibiotic targets or the presence of protective proteins can confer intrinsic resistance, as seen with the WhiB7-regulated resistome in mycobacteria [6].
Table 1: Examples of Intrinsic Resistance in Clinically Relevant Bacteria
| Bacterial Species | Intrinsic Resistance Profile | Primary Mechanisms |
|---|---|---|
| Pseudomonas aeruginosa | Aminoglycosides, β-lactams, chloramphenicol | Efflux pumps, outer membrane permeability, β-lactamases |
| Proteus vulgaris | Polymyxins | LPS modification (Arn operon activation) |
| Mycobacterium abscessus | Multiple antibiotics including β-lactams, macrolides | WhiB7 regulon, Eis2 modification enzyme, membrane barrier |
| Acinetobacter baumannii | Ampicillin, glycopeptides | Membrane impermeability, efflux systems |
| Klebsiella pneumoniae | Ampicillin | Chromosomal β-lactamase production |
Experimental Approaches for Studying Intrinsic Resistance
Genome-Wide Screening Methodologies
Systematic genetic approaches have proven invaluable for mapping the intrinsic resistome. The Keio collection screening methodology represents a powerful functional genomics strategy:
Experimental Protocol:
- Utilize the Keio collection, a complete set of ~3,800 single-gene E. coli knockout mutants [15].
- Grow knockout strains in liquid media with antibiotics at predetermined IC50 concentrations alongside antibiotic-free controls.
- Measure optical density at 600nm to quantify growth inhibition.
- Identify hypersensitive mutants showing significant growth defect specifically in antibiotic-containing media (typically >2 standard deviations below median).
- Validate hits through secondary screening and complementation assays.
- Categorize gene functions using databases such as Ecocyc to identify enriched pathways [15].
This approach revealed that knockouts in genes involved in cell envelope biogenesis, membrane transport, and information transfer pathways confer hypersensitivity to antibiotics like trimethoprim and chloramphenicol [15].
Functional Analysis of Non-Coding RNAs
Emerging research highlights the role of bacterial non-coding RNAs (ncRNAs) in regulating intrinsic resistance:
Experimental Protocol:
- Identify candidate ncRNAs through bioinformatics analysis of bacterial genomes [18].
- Construct deletion mutants using homologous recombination with suicide plasmids (e.g., pEX18Tc).
- Perform complementation assays using broad-host-range cloning vectors (e.g., pDN18).
- Determine minimum inhibitory concentrations (MICs) against relevant antibiotics using broth microdilution following CLSI guidelines [18].
- Conduct phenotypic characterization through spot growth assays under antibiotic pressure.
- Analyze target gene expression changes via quantitative RT-PCR.
- Predict RNA secondary structures using bioinformatics tools.
This methodology identified ncRNA34 as a key regulator of intrinsic polymyxin resistance in Proteus vulgaris [18].
Figure 1: Experimental Workflow for Intrinsic Resistance Gene Identification
Comparative Analysis of Intrinsic Resistance Mechanisms
Mechanism-Based Therapeutic Vulnerabilities
Different intrinsic resistance mechanisms present distinct therapeutic targeting opportunities and limitations:
Table 2: Comparative Vulnerability of Intrinsic Resistance Mechanisms to Evolutionary Bypass
| Intrinsic Resistance Mechanism | Hypersensitivity Phenotype | Evolutionary Recovery Capacity | Resistance-Proofing Potential |
|---|---|---|---|
| Drug Efflux (ΔacrB) | Broad-spectrum hypersensitivity to multiple drug classes | Limited recovery under high drug concentrations | High - severely compromised resistance evolution |
| Cell Envelope Biogenesis (ΔrfaG, ΔlpxM) | Increased permeability to hydrophilic compounds | Moderate recovery via target-based resistance mutations | Moderate - adaptable but with fitness costs |
| Regulatory Systems (WhiB7 regulon) | Species-specific hypersensitivity patterns | High recovery through compensatory mutations | Low - multiple bypass pathways exist |
| Non-coding RNA Regulation (ncRNA34) | Specific to regulated resistance pathways | Variable depending on regulatory network complexity | Context-dependent - requires further study |
Recent investigations reveal that genetic disruption of efflux pumps (ΔacrB) not only sensitizes bacteria but also dramatically reduces their ability to evolve de novo resistance, a phenomenon termed "resistance proofing" [15]. In contrast, defects in cell envelope biogenesis show greater capacity for evolutionary recovery through target-based resistance mutations.
Innovative Therapeutic Strategies Targeting Intrinsic Resistance
Resistance Hacking Approaches
A groundbreaking strategy termed "resistance hacking" exploits bacterial resistance mechanisms against themselves:
Experimental Protocol - Prodrug Activation:
- Design modified antibiotic analogs that serve as prodrugs with minimal inherent activity [6].
- Engineer these prodrugs to be activated specifically by resistance-associated enzymes (e.g., Eis2 in M. abscessus).
- Validate mechanism through genetic knockout studies (e.g., WhiB7-deficient strains).
- Assess safety profile by testing mitochondrial toxicity in eukaryotic cells.
- Evaluate combinatorial strategies with conventional antibiotics.
This approach demonstrated remarkable efficacy against Mycobacterium abscessus, where a modified florfenicol prodrug is activated by the Eis2 enzyme, whose expression is upregulated by the WhiB7 resistance regulon [6]. This creates a self-amplifying cycle of antibiotic activation that exploits the bacterium's own resistance machinery.
Resistance Breakthrough via Efflux Inhibition
Pharmacological inhibition of efflux pumps represents another promising adjuvant strategy:
Experimental Protocol - Efflux Pump Inhibition:
- Identify candidate efflux pump inhibitors (EPIs) through compound screening.
- Determine fractional inhibitory concentration (FIC) to assess synergy with antibiotics.
- Perform checkerboard assays to quantify combination effects.
- Conduct experimental evolution to assess resistance development to EPI-antibiotic combinations.
- Evaluate potential for multidrug adaptation through comprehensive susceptibility testing.
Studies using chlorpromazine as an EPI demonstrated that while pharmacological inhibition qualitatively mimics genetic ablation in short-term assays, evolutionary outcomes differ significantly due to the potential for resistance development against the inhibitor itself [15].
Figure 2: Resistance Hacking via Bacterial Prodrug Activation
The Scientist's Toolkit: Essential Research Reagents
Table 3: Key Research Reagents for Intrinsic Resistance Investigation
| Reagent / Tool | Specifications | Research Application | Experimental Consideration |
|---|---|---|---|
| Keio Collection | ~3,800 single-gene E. coli knockouts in BW25113 background | Genome-wide resistance gene identification | Requires verification of gene essentiality; controls for polar effects |
| Suicide Plasmids (pEX18Tc) | Tetracycline-resistant, sacB counterselection | Construction of targeted gene deletions | Essential for generating mutants in non-model organisms |
| Complementing Vectors (pDN18) | Broad-host-range cloning vectors | Genetic complementation studies | Critical for establishing causality in gene-function relationships |
| CLSI Broth Microdilution | Standardized MIC determination protocols | Phenotypic resistance characterization | Enables cross-study comparisons; requires quality control strains |
| Specialized Growth Media | LB, MH, defined minimal media | Culture conditions for susceptibility testing | Media composition significantly impacts resistance phenotypes |
| Efflux Pump Inhibitors | Chlorpromazine, PAβN, CCCP | Mechanistic studies of efflux-mediated resistance | Vary in specificity and potential off-target effects |
Global Health Implications and Future Directions
The clinical impact of intrinsic resistance is starkly evident in global surveillance data. The WHO reports that antibiotic resistance is highest in South-East Asian and Eastern Mediterranean regions, where approximately 1 in 3 reported infections demonstrate resistance [16]. The Gram-negative bacteria, particularly E. coli, K. pneumoniae, and Acinetobacter spp., pose the greatest threat due to their complex intrinsic resistance mechanisms coupled with acquired resistance genes [16].
The convergence of intrinsic and acquired resistance creates particularly worrisome clinical scenarios, as seen with carbapenem-resistant Enterobacteriaceae (CRE), where intrinsic membrane barriers and efflux systems synergize with acquired carbapenemase genes to create virtually untreatable infections [14]. This underscores the critical importance of developing strategies that target the foundational intrinsic resistance mechanisms that enable these superbugs to withstand last-resort antibiotics.
Future research directions should prioritize:
- Expanding intrinsic resistome mapping to underrepresented bacterial pathogens
- Developing combination therapies that simultaneously target intrinsic and acquired resistance mechanisms
- Advancing diagnostic technologies that detect intrinsic resistance profiles to guide targeted therapy
- Exploring evolutionary trade-offs associated with intrinsic resistance mechanisms to identify vulnerable points
The strategic targeting of intrinsic resistance represents a paradigm shift in our approach to the AMR crisis—moving beyond the perpetual cycle of novel drug development toward fundamentally undermining the bacterial defenses that make treatment failures inevitable. As research methodologies advance and our understanding of bacterial physiology deepens, the prospects for overcoming these ancient microbial defenses continue to improve, offering hope in the relentless battle against antimicrobial resistance.
The AcrAB-TolC efflux pump is a tripartite protein complex that serves as a primary defense mechanism for Gram-negative bacteria against a broad spectrum of antimicrobial agents. As a member of the Resistance-Nodulation-Division (RND) superfamily, this pump system contributes significantly to intrinsic and acquired multidrug resistance (MDR) in pathogens such as Escherichia coli and is recognized as a critical determinant of treatment failure in clinical settings [19] [20]. The World Health Organization has classified several Gram-negative bacteria with enhanced efflux capabilities as priority pathogens, emphasizing the urgent need to understand and target these resistance mechanisms [19].
This efflux system operates as a macromolecular complex that spans the entire bacterial cell envelope, comprising three essential components: the inner membrane transporter AcrB, the periplasmic adaptor protein AcrA, and the outer membrane channel TolC [21] [22]. Together, these proteins form a contiguous conduit that actively exports toxic substances, including diverse antibiotics, from the cell interior directly to the external environment. The operational efficiency of this pump system enables bacteria to survive lethal concentrations of antimicrobials, thereby complicating treatment strategies and contributing to the global antimicrobial resistance crisis [23] [19].
Structural Organization and Assembly
Component Architecture and Stoichiometry
The AcrAB-TolC efflux pump exhibits a precise stoichiometric ratio of 3:6:3 for AcrB, AcrA, and TolC respectively [22]. Each component possesses distinct structural characteristics that enable its specialized function within the complex:
AcrB: A homotrimeric inner membrane protein that serves as the engine of the efflux pump. Each AcrB protomer contains 12 transmembrane helices and a large periplasmic domain that functions as the substrate binding and translocation site. AcrB utilizes the proton motive force to power the transport cycle through conformational changes that transition between access (L), binding (T), and extrusion (O) states [21] [24].
AcrA: A periplasmic membrane fusion protein that forms a hexameric funnel-shaped structure connecting AcrB to TolC. AcrA consists of four domains: α-helical, lipoyl, β-barrel, and membrane-proximal domains. The hexamer is organized as a trimer of dimers that creates a bridge between the inner and outer membrane components [21] [22].
TolC: A homotrimeric outer membrane channel that forms a long, tapered β-barrel tunnel extending into the periplasm, topped by an α-helical trans-periplasmic tunnel. In its resting state, the TolC channel remains closed; activation by AcrA and AcrB induces conformational changes that open the channel, allowing substrate extrusion [21] [22].
Assembly Models and Structural Dynamics
The assembly of the tripartite complex has been elucidated through multiple structural studies, primarily explaining two competing models:
Adaptor Bridging Model: This model proposes that the hexameric AcrA assembly forms an intermeshing cogwheel interaction with the α-barrel tip region of TolC, without direct contact between AcrB and TolC. The apical tip of AcrA, consisting of six α-hairpins, engages with the analogous six-bladed cogwheel of the TolC trimer [21].
Adapter Wrapping Model: This alternative model suggests a tip-to-tip interaction between AcrB and TolC, with three AcrA protomers wrapping around the exterior of the AcrB-TolC binary complex [21].
Recent high-resolution cryo-EM structures have revealed detailed allosteric transport mechanisms, showing that the pump undergoes significant quaternary structural switches that synchronize ligand binding with channel opening [24]. In the apo state, the pump maintains a closed conformation, while substrate binding induces asymmetric conformational changes in AcrB that propagate through AcrA to trigger TolC opening, creating a continuous conduit for drug extrusion [24].
Table 1: Structural Components of the AcrAB-TolC Efflux Pump
| Component | Type | Location | Stoichiometry | Primary Function |
|---|---|---|---|---|
| AcrB | RND Transporter | Inner Membrane | Homotrimer (3) | Substrate recognition & proton-driven transport |
| AcrA | Membrane Fusion Protein | Periplasm | Hexamer (6) | Structural adaptation & signal transduction |
| TolC | Outer Membrane Factor | Outer Membrane | Homotrimer (3) | Extrusion conduit to extracellular space |
Figure 1: Tripartite Assembly of AcrAB-TolC Efflux Pump showing the bridging of cell envelope
Functional Mechanisms and Transport Cycle
Drug Recognition and Transport Cycle
The AcrB transporter employs a sophisticated functional rotation mechanism where each protomer cycles through three distinct conformational states in a coordinated, sequential manner:
Access (L) State: One protomer binds substrate from the periplasm or inner membrane leaflet through a vestibule region, allowing entry into the proximal binding pocket.
Binding (T) State: The substrate transfers to the distal binding pocket, where it interacts with specific recognition sites in the hydrophobic trap region.
Extrusion (O) State: Conformational changes expel the substrate into the funnel of AcrA, ultimately leading to extrusion through the TolC channel [24].
This asymmetric cycling creates a peristaltic pump action that efficiently moves substrates from the binding sites to the external environment. The entire process is driven by the proton motive force, with proton uptake occurring in the L state and proton release in the O state, coupling drug efflux to cellular energy metabolism [21] [24].
Substrate Specificity and Polymorphism
The AcrAB-TolC system demonstrates remarkable substrate promiscuity, capable of transporting a diverse array of compounds including antibiotics (β-lactams, fluoroquinolones, macrolides, tetracyclines), dyes, detergents, bile salts, and toxic metabolic products [19] [22]. This broad specificity arises from multiple substrate-binding regions within AcrB:
- Distal Binding Pocket: A large, hydrophobic cavity that accommodates bulky substrates
- Proximal Binding Pocket: A more accessible site that captures smaller substrates
- Multi-site Binding: Some substrates can bind to multiple regions within the transport pathway
Molecular dynamics studies have revealed that different antibiotics induce distinct conformational changes in the pump complex. For example, ampicillin binding results in significant opening of the TolC channel, while sulfamethoxazole-trimethoprim exhibits weaker interactions that may explain its relatively lower susceptibility to efflux [22].
Methodologies for Experimental Characterization
Structural Determination Techniques
Elucidating the architecture of AcrAB-TolC has required innovative approaches to stabilize the complex for high-resolution analysis:
Fusion Protein Construction: Researchers have created fusion proteins linking AcrB to tandem copies of AcrA via transmembrane linkers, which maintain functionality while enabling complex stabilization for structural studies [21]. These fusion constructs have been critical for capturing the pump in functional states.
Cryo-Electron Microscopy: Recent advances in cryo-EM have enabled determination of near-atomic resolution structures (3.6-6.5 Å) of the complete pump assembly in both resting and drug-engaged states [24]. Sample preparation involves optimization of detergent-to-protein ratios and exchange with amphipol A8-35 to maintain complex integrity.
Disulfide Cross-linking: Strategic introduction of cysteine residues at proximal sites (e.g., AcrA-S273C and AcrB-S258C) enables disulfide bond formation that stabilizes the complex without disrupting function, providing insights into native interactions [24].
Functional Assays for Efflux Activity
Multiple experimental approaches have been developed to quantify efflux pump activity and inhibition:
Acridine Pumping Assay: This functional assay measures the accumulation of fluorescent substrates like acridine orange in bacterial cells. Active efflux results in decreased intracellular fluorescence, which can be quantified using fluorometry [21]. Inhibition of efflux leads to increased fluorescence accumulation.
Minimum Inhibitory Concentration (MIC) Determination: MIC measurements in the presence and absence of efflux pump inhibitors provide assessment of efflux contribution to resistance. A ≥4-fold reduction in MIC with inhibition indicates significant efflux involvement [25] [23].
Molecular Dynamics Simulations: Computational approaches simulate pump behavior under various conditions, including analysis of root-mean-square deviation (RMSD), root-mean-square fluctuation (RMSF), and TolC opening dynamics in response to different antibiotics [22].
Table 2: Key Experimental Methods for Studying AcrAB-TolC Function
| Method Category | Specific Technique | Key Applications | Notable Findings |
|---|---|---|---|
| Structural Biology | Cryo-EM with fusion constructs | Complex architecture determination | Adaptor bridging model; 3.6Å resolution structure [21] |
| Functional Assays | Acridine accumulation | Efflux activity measurement | Quantitative pumping activity in engineered strains [21] |
| Susceptibility Testing | MIC with/without EPIs | Contribution to clinical resistance | ≥4-fold MIC reduction with inhibition [25] [23] |
| Computational Analysis | Molecular dynamics simulations | Drug-pump interactions | Pressure-induced rigidity affects opening [22] |
Figure 2: Integrated Experimental Workflow for AcrAB-TolC Characterization
Efflux Pump Inhibitors (EPIs) and Their Mechanisms
Classes and Comparative Efficacy of EPIs
The development of efflux pump inhibitors represents a promising strategy to overcome multidrug resistance by restoring antibiotic efficacy. Recent systematic evaluations have identified several chemical classes with potent inhibitory activity:
Pyranopyridines (MBX series): These compounds demonstrate the highest potency among currently known EPIs, with MBX2319 showing significant enhancement of antibiotic activity across multiple drug classes [25]. Their activity is highly susceptible to specific AcrB mutations (G141D_N282Y), indicating a specific binding mechanism.
Arylpiperazines: Including 1-(1-naphthylmethyl)piperazine (NMP), this class shows broad-spectrum potentiation of antibiotics but with generally lower potency compared to pyranopyridines [25].
Pyridylpiperazines (BDM88855): A recently characterized EPI whose activity is abolished by the V411A transmembrane region mutation in AcrB, suggesting a distinct mechanism from pyranopyridines [25].
Natural Products: Compounds like nordihydroguaiaretic acid (NDGA) and plant-derived polyphenols show moderate EPI activity but often face challenges with toxicity and pharmacokinetics [25] [26].
A comprehensive reassessment of 38 published EPIs revealed that only 17 compounds demonstrated at least fourfold enhancement potency with more than 2 out of 10 test antibiotics, highlighting the challenge in identifying broadly effective inhibitors [25].
Molecular Mechanisms of Inhibition
Structural studies have elucidated multiple mechanisms by which EPIs interfere with pump function:
Competitive Inhibition: Some EPIs bind to substrate binding pockets within AcrB, physically blocking antibiotic access while not being transported themselves.
Allosteric Inhibition: Other compounds bind to distinct sites that interfere with conformational changes necessary for the transport cycle, effectively freezing the pump in a non-functional state.
Complex Disruption: Certain inhibitors interfere with protein-protein interactions essential for complex assembly or signal transduction between components.
The binding sites for different EPI classes have been mapped through mutagenesis studies, with pyranopyridines dependent on residues G141 and N282, while pyridylpiperazines require V411 for activity [25]. This mechanistic diversity provides opportunities for developing combination EPI therapies that target multiple aspects of pump function simultaneously.
Table 3: Characterization of Major Efflux Pump Inhibitor Classes
| EPI Class | Representative Compound | Potency (Fold MIC Reduction) | Mutation Affecting Activity | Proposed Mechanism |
|---|---|---|---|---|
| Pyranopyridines | MBX2319 | 3-8 fold across multiple classes | G141D_N282Y | Competitive substrate binding |
| Arylpiperazines | NMP | 4-31 fold (variable by drug) | Unknown | Allosteric inhibition |
| Pyridylpiperazines | BDM88855 | 4-16 fold (broad spectrum) | V411A | Transmembrane disruption |
| Natural Products | NDGA | 3-15 fold (substrate-specific) | Unknown | Multiple potential targets |
Expression Regulation and Clinical Significance
Genetic Regulation of acrAB Expression
The expression of the acrAB-tolC operon is tightly controlled by complex regulatory networks that respond to environmental stressors and antibiotic exposure:
Global Transcriptional Regulators: Key regulators include MarA, SoxS, and Rob, which activate acrAB expression in response to antibiotic stress, oxidative damage, and toxic compounds [26]. These regulators bind to the marbox sequence in the acrAB promoter region, enhancing transcription.
Local Repressors: AcrR acts as a local repressor that modulates acrAB expression levels in response to unknown cellular signals, providing fine-tuning of pump production.
Stress Response Integration: The pump expression is integrated into broader stress response networks, including the SOS response and envelope stress pathways, allowing coordinated adaptation to hostile environments.
Meta-analyses of expression studies demonstrate that multidrug-resistant E. coli clinical isolates show significantly increased acrAB expression (standardized mean difference: 3.5, 95% CI: 2.1-4.9) compared to susceptible strains [23] [26]. This overexpression directly correlates with treatment failure and the emergence of pan-resistant bacterial lineages.
Role in Biofilm-Associated Resistance
Recent evidence indicates that efflux pumps play crucial roles in biofilm formation and associated antibiotic tolerance:
Efflux pumps contribute to biofilm-mediated tolerance through multiple mechanisms, including heterogeneity in pump expression among bacterial subpopulations, efflux of signaling molecules, and creation of local antibiotic gradients within the biofilm matrix [27].
Biofilm environments promote efflux mutations that enhance resistance, creating a synergistic relationship where efflux activity increases mutation rates and alters evolutionary pathways toward resistance [27].
This interplay between efflux activity and biofilm formation represents a significant challenge for treating device-related infections and chronic bacterial infections, where both mechanisms cooperate to enhance survival under antibiotic pressure.
Research Reagent Solutions
Table 4: Essential Research Reagents for AcrAB-TolC Investigations
| Reagent Category | Specific Examples | Function/Application | Key Features |
|---|---|---|---|
| Expression Systems | pET22b-AcrB-TM#-AcrA-AcrA fusion constructs | Complex stabilization for structural studies | TM linker optimization for functional activity [21] |
| EPI Compounds | MBX2319, NMP, PAβN, BDM88855 | Efflux inhibition mechanistic studies | Structure-activity relationship analysis [25] |
| Antibiotic Substrates | Puromycin, Ampicillin, Fluoroquinolones | Transport assays and binding studies | Differential binding affinities and transport efficiencies [22] [24] |
| Molecular Biology Tools | Site-directed cysteine mutants (S273C-AcrA/S258C-AcrB) | Disulfide cross-linking studies | Complex stabilization without functional disruption [24] |
| Analytical Software | Molecular dynamics packages (GROMACS, AMBER) | Computational simulation of pump dynamics | Pressure response modeling and conformational analysis [22] |
The AcrAB-TolC efflux pump represents a sophisticated molecular machine that significantly contributes to multidrug resistance in Gram-negative pathogens. Its tripartite structure, dynamic transport mechanism, and complex regulation present both challenges and opportunities for therapeutic intervention. While current EPI development has yielded promising compounds like the pyranopyridines, clinical translation remains hampered by toxicity concerns and pharmacokinetic limitations [25] [26].
Future research directions should focus on structure-guided inhibitor design leveraging high-resolution structural information, exploration of combination therapies that target multiple resistance mechanisms simultaneously, and development of narrow-spectrum agents that selectively disarm pathogens without disrupting commensal flora. Standardization of expression assays and functional protocols will enhance comparability across studies and accelerate progress in this critical area of antimicrobial research [23] [26].
As the antimicrobial resistance crisis intensifies, innovative approaches to neutralize efflux pumps like AcrAB-TolC will be essential components of comprehensive strategies to preserve the efficacy of existing antibiotics and extend the therapeutic lifespan of these precious medical resources.
The escalating crisis of antimicrobial resistance (AMR) demands a deeper understanding of the molecular mechanisms that bacteria employ to survive antibiotic treatment. While established resistance mechanisms like enzymatic inactivation and efflux pumps are well-documented, recent research has unveiled a crucial role for less-characterized proteins, such as BON domain-containing proteins (BDCPs), in mediating intrinsic and acquired resistance. This guide objectively compares the function, distribution, and mechanism of BDCPs against other novel and established resistance proteins. By synthesizing current experimental data and validating methodologies, we frame these findings within the broader thesis that elucidating intrinsic resistance gene function is paramount for developing novel therapeutic strategies to overcome multidrug-resistant infections.
Antibiotic resistance represents a critical global health threat, implicated in millions of deaths annually [28]. The traditional quintet of resistance mechanisms—efflux pump activity, antibiotic inactivation, reduced membrane permeability, target modification, and target protection—has long provided a framework for understanding this issue. However, the relentless selective pressure of antibiotic use has driven the evolution and discovery of novel proteins that confer resistance through both refined and entirely new pathways.
Among these emerging players, BON domain-containing proteins (BDCPs) have recently been identified as significant contributors to resistance, particularly in Gram-negative bacteria [29]. Their function appears distinct from classical porins and efflux pumps, suggesting a new frontier for research and therapeutic intervention. Simultaneously, other transport proteins, such as those in the Multidrug and Toxic Compound Extrusion (MATE) family, continue to be characterized, revealing their specific roles in resistance to clinical antibiotics [30]. This guide provides a comparative analysis of these proteins, offering researchers a data-driven overview of their performance, validated experimental protocols for their study, and a toolkit for future investigation into intrinsic resistance.
Comparative Analysis of Novel Resistance Proteins
The following section provides a structured, data-centric comparison of BDCPs against other key resistance proteins, highlighting their distribution, genetic context, and resistance profiles.
Table 1: Distribution and Genetic Features of Profiled Resistance Proteins
| Protein Name | Protein Family | Prevalence in Bacterial Pathogens (Representative Counts) | Genomic Context & Regulation | Key Structural Features |
|---|---|---|---|---|
| BON Domain-Containing Protein (BDCP) | BON (Bacterial OsmY and Nodulation) | E. coli (178), P. aeruginosa (84), K. pneumoniae (69), A. baumannii (43), S. enterica (727) [29] | Often plasmid-encoded; expression can be induced by antibiotic stress [28]. | Dual BON domains; trimeric pore-forming channel; conserved WXG motif for substrate transport [29] [28]. |
| DolP | Dual BON-domain Lipoprotein | Conserved across diverse Proteobacteria [31] | Chromosomal gene; regulated by σE-dependent promoters [31]. | Lipoprotein anchored to inner leaflet of OM; two opposing BON domains; phospholipid-binding interface [31]. |
| CmeABC | Resistance-Nodulation-Division (RND) Efflux Pump | Primarily in Campylobacter jejuni [28] | Chromosomal tripartite system (CmeA, CmeB, CmeC). | Proton motive force-dependent transport; specific substrate binding sites in CmeB [28]. |
| YoeA | Multidrug and Toxic Compound Extrusion (MATE) | Conserved in Bacillus species (e.g., B. subtilis, B. anthracis) [30] | Chromosomal gene; expression upregulated by antibiotics and antimicrobial peptides [30]. | 12 transmembrane segments; Na+/H+ ion-coupled transport mechanism [30]. |
Table 2: Functional Resistance Profiles and Experimental Evidence
| Protein Name | Primary Function in Resistance | Key Antibiotics Affected (Fold Change in MIC) | Direct Experimental Evidence |
|---|---|---|---|
| BON Domain-Containing Protein (BDCP) | Efflux pump-like activity; antibiotic binding and transport [29] [28]. | Ceftazidime (>32-fold), Imipenem, Meropenem [29] [28]. | Heterologous expression in susceptible strains confers resistance; molecular dynamic simulation shows stable binding with carbapenems [29] [28]. |
| DolP | Maintenance of outer membrane integrity; phospholipid binding [31]. | Vancomycin, SDS, detergents [31]. | Knockout mutant (ΔdolP) shows increased susceptibility; complementation restores resistance [31]. NMR structure reveals lipid-binding domain [31]. |
| CmeABC | Proton-driven active efflux of antibiotics [28]. | Chloramphenicol, Fluoroquinolones, Tetracycline, Macrolides [28]. | Potent variant RE-CmeABC increases mutation frequency and MIC to ciprofloxacin in C. jejuni [28]. |
| YoeA | Na+-driven efflux of antimicrobial peptides and antibiotics [30]. | Plipastatin, Penicillin, various clinical antibiotics [30]. | ΔyoeA strain shows significant growth inhibition; EtBr efflux assays confirm transport activity; overexpression increases resistance [30]. |
Decoding the BON Domain: Mechanisms and Methodologies
Proposed Mechanism of Action
BDCPs represent a unique mechanism distinct from classic porins and efflux pumps. Structural bioinformatics and experimental data suggest that many BDCPs can self-assemble into trimeric, pore-shaped channels in the bacterial membrane [28]. A conserved WXG motif is essential for this oligomerization and for the substrate-transporting function. Rather than an energy-dependent pumping mechanism, some BDCPs are proposed to operate via a "one-in, one-out" transport model, where the influx of a harmless molecule (e.g., a nutrient) is coupled to the efflux of an antibiotic molecule through the channel [28]. Additionally, some BDCPs, such as those with LysM domains, can bind to antibiotics like carbapenems with high affinity, effectively sequestering them and preventing them from reaching their targets [29].
Key Experimental Protocols for Validation
Validating the function of novel resistance proteins like BDCPs requires a multi-faceted approach. Below are detailed methodologies for key experiments cited in the literature.
1. Gene Knockout and Phenotypic Susceptibility Profiling This protocol is fundamental for establishing a protein's role in intrinsic resistance [15].
- Procedure:
- Strain Construction: Create a clean, marker-less knockout of the gene encoding the target protein (e.g.,
dolP,yoeA) in a wild-type background using homologous recombination. - Growth Assays: Culture the wild-type and isogenic knockout strains in liquid media and measure growth kinetics (OD₆₀₀) over time.
- Susceptibility Testing:
- Broth Microdilution: Determine the Minimum Inhibitory Concentration (MIC) of a panel of antibiotics against both strains according to CLSI guidelines.
- Spot Assay: Serially dilute overnight cultures and spot them onto solid agar plates containing sub-inhibitory concentrations of antibiotics or membrane-disrupting agents (e.g., SDS, deoxycholate).
- Strain Construction: Create a clean, marker-less knockout of the gene encoding the target protein (e.g.,
- Data Interpretation: A significant reduction (≥4-fold) in the MIC of one or more antibiotics in the knockout strain compared to the wild-type indicates the protein contributes to resistance. Impaired growth in the presence of detergents suggests a role in maintaining membrane integrity [31] [15].
2. Heterologous Expression and Resistance Conferrence This experiment demonstrates the sufficiency of a protein to cause resistance [29] [28].
- Procedure:
- Cloning: Amplify the gene of interest (e.g., a
BDCPfrom a soil metagenome) and clone it into an expression vector with an inducible promoter. - Transformation: Introduce the recombinant plasmid into a susceptible, genetically tractable host like E. coli DH5α.
- Induction and MIC Testing: Induce gene expression and perform MIC testing as described above.
- Cloning: Amplify the gene of interest (e.g., a
- Data Interpretation: A significant increase in the MIC of specific antibiotics in the transformed strain compared to the empty vector control provides direct evidence that the protein confers resistance [28].
3. Efflux Pump Activity Assay using Ethidium Bromide (EtBr) This protocol is used to confirm and characterize efflux activity [30].
- Procedure:
- Cell Preparation: Grow and harvest wild-type and knockout cells.
- Loading: Incubate cells with EtBr, a fluorescent efflux pump substrate, in the presence of an energy inhibitor (e.g., CCCP) to allow passive influx and accumulation.
- Efflux Measurement: Centrifuge and resuspend the loaded cells in a buffer without CCCP but with an energy source (e.g., glucose). Monitor the decrease in fluorescence intensity over time using a spectrofluorometer.
- Inhibition: Repeat the assay in the presence of a known efflux pump inhibitor (EPI) like chlorpromazine.
- Data Interpretation: A rapid decrease in fluorescence in the wild-type strain indicates active efflux. A diminished efflux rate in the knockout strain or in the presence of an EPI confirms the protein's role in this process [30].
Visualizing the Research Workflow
The path from genomic discovery to functional and mechanistic characterization of a novel resistance protein involves a series of critical steps, as visualized below.
The Scientist's Toolkit: Essential Research Reagents
Table 3: Key Research Reagents and Resources
| Reagent / Resource | Function in Research | Example & Notes |
|---|---|---|
| AMRFinder | In silico identification of known AMR genes from whole-genome sequences. | NCBI tool; uses a curated database of Hidden Markov Models (HMMs) and protein sequences [3]. |
| Keio Collection | Genome-wide library of single-gene knockouts in E. coli K-12. | Invaluable for high-throughput screens of intrinsic resistance genes [15]. |
| Ethidium Bromide (EtBr) | Fluorescent substrate for detecting and characterizing efflux pump activity. | Used in accumulation/efflux assays; fluorescence is monitored over time [30]. |
| Carbonyl Cyanide m-Chlorophenyl Hydrazone (CCCP) | Protonophore that dissipates the proton motive force. | Used as a negative control in efflux assays to inhibit energy-dependent transport [30]. |
| Chlorpromazine | Efflux Pump Inhibitor (EPI). | Used in synergy studies to chemically inhibit efflux and potentiate antibiotic activity [15]. |
| AlphaFold2 | AI-based protein structure prediction tool. | Provides high-accuracy structural models for hypothesis generation and experimental design [29]. |
Discussion and Therapeutic Implications
The characterization of novel proteins like BDCPs fundamentally expands our understanding of the bacterial "resistome." The evidence confirms that BDCPs are a functionally diverse family, with some members acting as pore-forming efflux facilitators and others as antibiotic-binding sponges [29] [28]. This mechanistic diversity underscores their significance in the complex landscape of intrinsic resistance, particularly in Gram-negative pathogens where the outer membrane presents a formidable barrier.
From a therapeutic perspective, targeting intrinsic resistance pathways like those mediated by BDCPs or efflux pumps offers a promising strategy for "resistance-proofing" existing antibiotics. Genetic studies show that knocking out genes like acrB (a major efflux pump) or dolP not only sensitizes bacteria to antibiotics but can also compromise the organism's ability to evolve resistance de novo [15]. However, a critical caveat exists: at sub-inhibitory antibiotic concentrations, hypersensitive mutants can still recover through compensatory mutations, highlighting the challenge of complete resistance-proofing [15].
Furthermore, the discordance between genetic knockout and pharmacological inhibition—where adaptation to a drug-like EPI can occur rapidly—reveals a crucial consideration for drug development [15]. Therefore, while proteins like BDCPs and components of the efflux machinery represent validated targets for restoring antibiotic susceptibility, future work must focus on designing multi-target inhibitors or combination therapies that are less prone to triggering evolutionary escape routes.
Advanced Tools for Mapping and Exploiting Resistance Pathways
The intrinsic resistome encompasses the complete set of genes within an organism that provides innate resistance to antibiotics and other toxic compounds [32]. Genome-wide hypersusceptibility screening represents a powerful functional genomics approach to systematically identify genes that constitute this intrinsic resistome. By analyzing comprehensive knockout libraries, researchers can pinpoint specific genetic perturbations that increase cellular sensitivity to various antimicrobial agents, revealing novel drug targets and potential adjuvant therapies. The Keio knockout collection, a library of approximately 4,000 single-gene deletion mutants in Escherichia coli, has emerged as a pivotal resource for these investigations [32] [33] [34]. These screens operate on the principle that deleting a gene involved in intrinsic resistance mechanisms will render the mutant strain more susceptible to a given compound, thereby identifying genes whose products contribute to innate defense pathways.
The identification of hypersusceptibility genes through systematic screening provides crucial insights into cellular defense mechanisms and potential therapeutic targets. When a knockout mutant displays increased sensitivity to an antimicrobial agent, it indicates that the disrupted gene normally plays a role in mitigating that compound's toxic effects. This approach has revealed that intrinsic resistance is multifactorial, involving diverse cellular processes including cell wall maintenance, efflux systems, metabolic pathways, DNA repair mechanisms, and stress response networks [32] [35] [34]. Understanding these mechanisms provides a scientific foundation for developing strategies to overcome antibiotic resistance, a pressing global health challenge.
Key Methodologies and Experimental Approaches
Core Screening Workflows
Genetic screens for hypersusceptibility follow standardized workflows that ensure comprehensive coverage and reliable identification of sensitive mutants. The process typically begins with high-throughput replication of knockout libraries onto growth media containing subinhibitory concentrations of the antimicrobial compound being studied [32] [33]. Following incubation, researchers systematically compare growth patterns across mutants to identify strains with significantly reduced viability compared to wild-type controls. These potential hits then undergo validation through secondary assays, often including minimum inhibitory concentration (MIC) determination and complementation tests to confirm that the observed phenotype directly results from the specific gene deletion [33] [34].
The experimental workflow for a typical genome-wide hypersusceptibility screen involves multiple stages of validation and analysis, as visualized below:
Screening Strategies: Resistance vs. Sensitivity
Genetic screens can be strategically designed to identify either resistance or sensitivity phenotypes, with critical differences in experimental parameters. Positive selection screens (resistance screens) apply high drug pressure (70-90% growth inhibition) to enrich for mutants with improved fitness under treatment conditions [36]. Conversely, negative selection screens (sensitivity screens) utilize lower drug pressure (10-30% growth inhibition) to identify mutants that are depleted from the population due to increased drug sensitivity [36]. This distinction is crucial for experimental design, as the drug concentration significantly impacts which genetic mechanisms will be identified.
The optimal screening parameters differ substantially between resistance and sensitivity screens:
| Screening Parameter | Resistance Screen | Sensitivity Screen |
|---|---|---|
| Drug Pressure | High (70-90% GI) | Low (10-30% GI) |
| Selection Type | Positive selection | Negative selection |
| Phenotype Identified | Enriched mutants | Depleted mutants |
| Primary Application | Resistance mechanisms | Hypersusceptibility genes |
| Typical Hit Output | Resistance conferring genes | Sensitivity conferring genes |
Table 1: Comparison of screening strategies for resistance versus sensitivity identification. GI = Growth Inhibition. Adapted from [36].
Advanced Screening Technologies
While traditional knockout libraries remain valuable, CRISPR-based screening approaches have expanded the toolbox for hypersusceptibility research. For example, a genome-wide CRISPR-Cas9 screen developed for Leishmania infantum successfully identified genes associated with resistance to miltefosine and amphotericin B [37]. This technological advancement is particularly significant for organisms where traditional genetic tools are limited, demonstrating how methodology evolution continues to enhance our ability to probe intrinsic resistance mechanisms across diverse species.
Pharmacotranscriptomics-based drug screening (PTDS) represents another technological advancement, detecting gene expression changes following drug perturbation on a large scale [38]. This approach allows researchers to analyze the efficacy of drug-regulated gene sets and signaling pathways, providing complementary information to genetic knockout screens. When combined with artificial intelligence-driven data mining, PTDS can reveal complex drug response networks that might be missed in conventional genetic screens [38].
Representative Studies and Key Findings
Antibiotic Hypersusceptibility Profiles
Seminal research utilizing the Keio collection has identified hypersusceptibility genes across multiple antibiotic classes. One comprehensive study screened nearly 4,000 mutants against seven antibiotics (ciprofloxacin, rifampin, vancomycin, ampicillin, sulfamethoxazole, gentamicin, and metronidazole), identifying 140 strains with significantly increased sensitivities to at least one antibiotic [32]. This work helped define E. coli's intrinsic resistome and demonstrated that many gene knockouts confer hypersensitivity to multiple antibiotics, revealing interconnected resistance networks.
The complexity of intrinsic resistance is evident in the diversity of genes identified in antibiotic hypersusceptibility screens:
| Gene | Functional Category | Antibiotic Affected | Proposed Mechanism |
|---|---|---|---|
| tolC | Membrane transport | Multiple classes | Part of efflux pump complexes |
| acrB | Membrane transport | Multiple classes | Efflux pump component |
| pgpA | Cell envelope | Vancomycin | Altered membrane permeability |
| recA | DNA repair | Ciprofloxacin | Deficient DNA damage repair |
| gyrA | DNA replication | Ciprofloxacin | Target site mutation |
| rpoB | Transcription | Rifampin | Target site mutation |
Table 2: Representative genes identified in antibiotic hypersusceptibility screens using the Keio collection. Data compiled from [32].
Susceptibility to Novel and Emerging Compounds
Recent studies continue to leverage the Keio collection to investigate susceptibility to emerging antimicrobial compounds. A 2025 screen identified 44 mutants with increased susceptibility to epetraborole, a boron-containing antibiotic targeting leucyl-tRNA synthetase [33]. Follow-up characterization revealed that the most susceptible mutants (including ΔubiG, ΔpncA, ΔtrmU, and ΔleuD) affect diverse cellular processes including tRNA modification, ubiquinone biosynthesis, NAD salvage pathways, and leucine biosynthesis. This suggests that epetraborole's primary inhibition of LeuRS creates synergistic vulnerabilities when combined with defects in these pathways.
Similarly, a genome-wide screen of the Keio collection for boric acid sensitivity identified 92 mutants with increased susceptibility, highlighting the multifactorial nature of intrinsic resistance to this antimicrobial agent [34]. The construction of double and triple mutants demonstrated that combining deletions in identified genes can amplify susceptibility effects, suggesting cumulative contributions to resistance mechanisms. These findings illustrate how systematic screening approaches can reveal complex genetic interactions within resistance networks.
Hypersensitivity to Genotoxic Agents
Expanding beyond antimicrobials, hypersusceptibility screens have also identified genes conferring resistance to genotoxic agents used in cancer chemotherapy. A screen of the Keio collection against six genotoxic compounds (bleomycin, cisplatin, ICR-191, 5-azacytidine, zebularine, and 5-bromo-2'-deoxyuridine) identified 156 hypersusceptible mutants [39]. This research demonstrated that each agent produces a characteristic "sensitivity profile" reflecting its specific mechanism of action, and revealed that engineered double mutants can exhibit dramatically enhanced effects, informing potential combination therapies.
The relationship between cellular pathways and compound sensitivity reveals key vulnerability nodes:
Essential Research Tools and Reagents
The Scientist's Toolkit
Successful genetic screens for hypersusceptibility require specialized reagents and methodologies. The table below outlines essential components of the screening toolkit:
| Tool/Reagent | Function | Example/Source |
|---|---|---|
| Keio Collection | Genome-wide knockout library | ~4,000 E. coli single-gene deletants [32] |
| ASKA Plasmid Library | Complementation assays | ORFs for genetic rescue [33] |
| Cryoreplicator | High-throughput strain handling | 96-pin replicator [32] |
| MIC Determination | Phenotype quantification | Etest or broth microdilution [32] |
| Sequential Spot Tests | Hit validation | Serial dilution growth assessment [33] |
| CRISPR Libraries | Eukaryotic screening | Whole-genome sgRNA collections [37] |
Table 3: Essential research tools for conducting genetic screens for hypersusceptibility.
Following experimental screening, robust bioinformatics analysis is essential for interpreting results and identifying biological patterns. The Omics Dashboard within Pathway Tools enables mapping of susceptibility genes onto known metabolic and regulatory pathways [33]. Functional enrichment analysis using tools like DAVID (Database for Annotation, Visualization and Integrated Discovery) helps identify biological processes overrepresented among susceptibility genes [33] [34]. Protein-protein interaction networks constructed using STRING database reveal functional modules and potential protein complexes among identified genes [33]. These computational approaches transform candidate gene lists into meaningful biological insights about resistance mechanisms.
Research Applications and Therapeutic Implications
Defining Mechanisms of Drug Action
Hypersusceptibility screens provide powerful tools for elucidating mechanisms of drug action through the identification of genetic vulnerabilities. When mutants lacking specific genes show heightened sensitivity to a compound, it suggests that the affected pathways either interact with the drug's primary target or help mitigate its secondary effects. For example, the identification of tRNA modification and ubiquinone biosynthesis genes in epetraborole hypersusceptibility helped validate LeuRS as its primary target while revealing connected vulnerability networks [33]. This approach is particularly valuable for characterizing compounds with incompletely understood mechanisms.
Identifying Targets for Adjuvant Development
A primary application of hypersusceptibility screening is identifying potential targets for adjuvant therapies that potentiate existing antibiotics. The concept of "codrugs" that target hypersusceptibility genes represents a promising approach to overcoming antibiotic resistance [32]. For instance, the discovery that mutants in folate biosynthesis pathways are hypersensitive to zebularine led to demonstrations of synergy between trimethoprim (which inhibits folate metabolism) and zebularine [39]. This combination approach can resensitize resistant pathogens to conventional antibiotics and decrease the likelihood of resistance emergence.
Understanding and Countering Resistance Evolution
By defining the intrinsic resistome, hypersusceptibility screens provide insights into how resistance might develop during treatment. Understanding these innate defense mechanisms helps predict resistance evolution and design strategies to preempt it. For example, the discovery that certain gene knockouts can overcome resistance conferred by gyrase mutations in the case of ciprofloxacin suggests potential pathways for countering target-site-mediated resistance [32]. This proactive approach to resistance management is increasingly important as multidrug-resistant pathogens continue to emerge.
Genetic screens utilizing knockout libraries such as the Keio collection have fundamentally advanced our understanding of intrinsic resistance mechanisms across diverse antimicrobial compounds. The systematic identification of hypersusceptibility genes has revealed that antibiotic resistance is not merely driven by a handful of specialized mechanisms, but rather emerges from complex networks of cellular processes that maintain basal protection against toxic compounds. These insights provide both fundamental knowledge of microbial physiology and practical pathways for addressing the growing crisis of antibiotic resistance. As screening technologies continue to evolve with CRISPR-based approaches and advanced computational analysis, our ability to map and target vulnerability networks in pathogens will continue to refine strategies for developing more effective antimicrobial therapies.
The rapid and accurate prediction of resistance phenotypes is a critical challenge across multiple fields, from clinical medicine to agricultural science. Traditional, culture-based methods for determining antibiotic resistance in pathogens or phenotyping disease resistance in crops are often slow, labor-intensive, and impractical for large-scale screening. Transcriptomics, which provides a snapshot of global gene expression patterns, offers a powerful alternative by capturing the molecular state of an organism under selective pressure. However, the high dimensionality of transcriptomic data—often comprising thousands of genes—presents significant challenges for interpretation and clinical translation.
Machine learning (ML) has emerged as a transformative tool for analyzing these complex datasets. By identifying subtle, multivariate patterns in gene expression, ML algorithms can distill vast transcriptomic profiles into minimal gene signatures that reliably predict resistance. This guide compares the performance, experimental protocols, and applications of recently developed ML-based transcriptomic signatures for predicting resistance in infectious disease and agriculture. The focus is on validating these signatures as indicators of intrinsic resistance mechanisms, providing researchers with a framework for evaluating and implementing these approaches in their own work.
Comparative Analysis of Minimal Gene Signature Performance
The following tables summarize the performance and characteristics of recently developed minimal gene signatures for resistance prediction across different organisms and stressors.
Table 1: Performance Metrics of Featured Minimal Gene Signatures
| Study Focus / Stressor | Organism | Signature Size (Genes) | Best-Performing Model | Reported Accuracy | Key Validation Metric |
|---|---|---|---|---|---|
| Antibiotic Resistance [40] [41] | Pseudomonas aeruginosa | 35-40 | Automated ML Classifiers | 96% - 99% | Test Set Accuracy |
| Sunflower Broomrape Resistance [42] | Sunflower (Helianthus annuus) | 24 | Support Vector Machine (SVM) | 95.1% | Classification Accuracy |
| LP-184 Drug Response [43] | Human Cancer Cell Lines (NCI-60) | 16 | XGBoost Regression | 86% | Prediction Accuracy (4-fold cut-off) |
Table 2: Technical and Biological Characteristics of the Signatures
| Study Focus / Stressor | Feature Selection Method | Biological Validation | Key Strengths | Reported Limitations |
|---|---|---|---|---|
| Antibiotic Resistance [40] [41] | Genetic Algorithm (GA) | Comparison to CARD database; iModulon mapping | High accuracy across multiple antibiotics; reveals novel biology | Limited overlap with known resistance markers |
| Sunflower Broomrape Resistance [42] | LASSO & Random Forest | Correlation with jasmonic acid metabolites | Direct application for breeding; good performance with a complex trait | Model trained on a specific set of varieties |
| LP-184 Drug Response [43] | Multi-layered feature selection (RADR platform) | In vitro IC50 correlation (r=0.70) | Guided preclinical drug development; manageable biomarker panel | Signature derived from cell lines, not patients |
Detailed Experimental Protocols for Signature Development
The development of a robust, minimal gene signature follows a systematic workflow from sample preparation to model validation. The following diagram and description outline the general process, with specifics drawn from the featured studies.
Sample Preparation and Transcriptomic Profiling
The first step involves collecting a well-characterized set of samples representing the resistance and susceptibility phenotypes.
- Biological Replicates and Phenotyping: Studies analyzed hundreds of clinical isolates or varieties to ensure statistical power. For instance, the P. aeruginosa study used 414 clinical isolates characterized for resistance to four antibiotics (meropenem, ciprofloxacin, tobramycin, ceftazidime) using culture-based methods [40]. Similarly, the sunflower study used 103 varieties that were meticulously phenotyped based on the number of broomrape emergences, classifying them as resistant (0 emergences) or susceptible (>0 emergences) [42].
- RNA Extraction and Sequencing: Standard protocols are employed. For the sunflower study, RNA was extracted from roots, and its quality was assessed using NanoDrop, Qubit, and Agilent 2100. High-quality RNA libraries were sequenced on the Illumina NovaSeq 6000 platform with 150 bp paired-end reads [42]. This step generates the raw gene expression count data for all samples.
Data Pre-processing and Feature Selection
This phase transforms raw sequencing data into a clean, normalized dataset and identifies the most predictive genes.
- Data Normalization and Cleaning: Raw sequencing data is processed to remove low-quality reads and technical artifacts. The sunflower researchers used
Fastpsoftware for trimming and filtering, then aligned clean reads to the reference genome usingHISAT2[42]. Gene expression levels are quantified (e.g., withFeaturesCounts) to create a gene expression matrix. It is critical to filter out genes with low or zero expression across most samples. - Dimensionality Reduction with Feature Selection: This is the core step for finding a minimal signature. The P. aeruginosa study employed a Genetic Algorithm (GA), which is an evolutionary-inspired method [40]. The process begins with a population of random 40-gene subsets. Over hundreds of generations, these subsets are evaluated, recombined, and mutated, with high-performing sets (evaluated by SVM or logistic regression) preferentially retained. After many runs, a consensus set of the most frequently selected genes (35-40) is derived [40]. Other common methods include LASSO regression, which penalizes less important genes, setting their coefficients to zero [42].
Machine Learning Model Training and Validation
The selected gene features are used to train predictive models.
- Model Training and Comparison: Multiple ML algorithms are typically trained and compared. The sunflower study tested Support Vector Machine (SVM), K-Nearest Neighbours (KNN), Logistic Regression (LR), and Gaussian Naive Bayes using the expression levels of the 24 selected genes as input [42]. The P. aeruginosa workflow used an Automated ML (AutoML) framework to efficiently identify the best classifier for their consensus gene sets [40].
- Rigorous Validation: To avoid overfitting, models are validated on data not used during training. Standard practice involves holding out a portion of the data (e.g., 20-30%) as a test set or using cross-validation. The ultimate test is validation on a completely independent cohort. The P. aeruginosa models achieved 96-99% accuracy on a held-out test set [40], while the LP-184 drug response signature was validated on an additional panel of cell lines, showing a strong correlation (r=0.70) between predicted and actual drug sensitivity [43].
Biological Interpretation and Pathway Analysis
A key advantage of transcriptomic signatures is the potential to gain biological insights into resistance mechanisms. The following diagram illustrates the multi-faceted interpretation process used in the featured research.
- Comparison to Known Resistance Markers: The P. aeruginosa study compared its GA-selected genes to the Comprehensive Antibiotic Resistance Database (CARD). Notably, only 2-10% of the predictive genes overlapped with established AMR genes in CARD [40]. For meropenem, known efflux pump genes mexA and mexB were identified, confirming the method can recapture known biology [40]. However, the vast majority of predictive genes were novel, indicating significant knowledge gaps in our understanding of resistance mechanisms.
- Functional Enrichment and Pathway Analysis: Standard bioinformatics tools like Gene Ontology (GO) and Kyoto Encyclopedia of Genes and Genomes (KEGG) enrichment are used to determine if the signature genes are overrepresented in specific biological processes or pathways [44] [42]. This can implicate broader physiological processes in resistance, such as metabolic adaptation or stress response.
- Advanced Network Analysis: The P. aeruginosa study employed iModulon analysis, which uses Independent Component Analysis to identify sets of co-regulated genes (modules) from the expression data. Mapping the signature genes onto iModulons revealed that resistance was associated with coordinated transcriptional changes in programs governing oxidative stress, DNA repair, efflux, and ribosomal function [40]. This provides a higher-order, systems-level view of the resistance phenotype.
Table 3: Key Reagents and Computational Tools for Signature Development
| Item / Resource | Function / Purpose | Example from Literature |
|---|---|---|
| Clinical/Field Isolates | Provides biologically relevant transcriptomic data from real-world samples. | 414 P. aeruginosa clinical isolates [40]; 103 sunflower varieties [42]. |
| Phenotyping Assays | To definitively classify samples as resistant or susceptible for model training. | Culture-based antibiotic susceptibility testing [40]; counting broomrape attachments [42]. |
| RNA Sequencing Kits | For generating the primary gene expression data. | Illumina NovaSeq 6000 platform [42]. |
| Reference Genome & Annotation | Essential for aligning sequencing reads and assigning them to genes. | Sunflower reference genome from NCBI [42]; P. aeruginosa reference genomes. |
| CARD Database | A curated resource to compare signature genes against known resistance markers [40]. | Used to find minimal overlap in P. aeruginosa signature genes [40]. |
| Genetic Algorithm / LASSO | Core feature selection methods for identifying minimal, predictive gene sets. | Genetic Algorithm for P. aeruginosa [40]; LASSO for sunflowers [42]. |
| SVM, XGBoost, AutoML | Machine learning algorithms used to build the final classification/prediction models. | SVM for sunflowers [42]; XGBoost for drug response [43]; AutoML for P. aeruginosa [40]. |
The integration of transcriptomics and machine learning is producing minimal gene signatures that predict resistance with remarkably high accuracy, often exceeding 95%. These signatures are not just black-box predictors; they serve as windows into the complex biology of resistance, frequently implicating novel genes and systems-level regulatory networks beyond canonical mechanisms. The choice of feature selection method—whether Genetic Algorithm, LASSO, or others—significantly influences the final signature and its biological interpretability.
For researchers validating intrinsic resistance gene function, these ML-derived signatures offer a powerful, data-driven starting point. They prioritize candidate genes from thousands of possibilities, accelerating the journey from genomic data to mechanistic understanding. As these methodologies continue to mature and become more accessible, they hold the promise of transforming diagnostics in clinical microbiology and streamlining the development of resistant crops in agriculture.
The global health crisis of antibiotic resistance is increasingly driven by the evolution and dissemination of antibiotic resistance genes (ARGs) across One Health sectors. Traditional methods for identifying ARGs from whole genome and metagenomic sequencing data have primarily relied on alignment-based approaches that compare query sequences against reference databases. While useful, these methods face inherent limitations: they struggle to detect novel ARG variants, exhibit high false-negative rates for sequences with low similarity to database entries, and require computationally expensive searches against large databases [45]. The inability to reliably identify previously uncharacterized ARGs presents a critical gap in our ability to monitor and combat the spread of antibiotic resistance.
Protein language models (pLMs) have emerged as a powerful alternative, leveraging self-supervised deep learning on millions of protein sequences to capture complex patterns and functional relationships. However, these models also face challenges, particularly when training data is limited [45]. This guide examines how hybrid tools like ProtAlign-ARG integrate the strengths of both pLMs and alignment-based methods to overcome these limitations, with a specific focus on their application in validating intrinsic resistance gene function—a crucial aspect of distinguishing true resistance mechanisms from background genetic noise.
The ProtAlign-ARG Framework
ProtAlign-ARG represents a novel hybrid methodology that synergistically combines a pre-trained protein language model with alignment-based scoring to expand ARG detection capabilities from DNA sequencing data. This integrated approach allows the tool to leverage the contextual understanding of protein language models while maintaining the reliability of established alignment methods for uncertain cases [45].
The framework employs four specialized models dedicated to distinct analytical tasks:
- ARG Identification: Distinguishing ARGs from non-ARG sequences
- ARG Class Classification: Categorizing resistance according to antibiotic classes
- ARG Mobility Identification: Predicting potential for horizontal gene transfer
- ARG Resistance Mechanism: Identifying biochemical mechanisms of resistance [45]
This multi-task capability provides researchers with a comprehensive toolkit for characterizing resistance determinants beyond simple identification.
Comparative Tools in the Landscape
While ProtAlign-ARG represents the cutting edge in hybrid approaches, several other tools utilize protein language models or deep learning for ARG identification:
- PLM-ARG: Utilizes pre-trained protein language models for ARG identification, reporting Matthew's correlation coefficients of 0.983 ± 0.001, substantially outperforming previous tools [46].
- ARG-BERT: Employs ProteinBERT for predicting ARG resistance mechanisms and provides attention analysis for model interpretability, highlighting biologically relevant features [47].
- LM-ARG: An earlier implementation leveraging ProtAlbert embeddings, demonstrating the potential of pLMs for ARG classification [48].
- ARGNet: Uses deep neural networks with autoencoders and convolutional neural networks, accepting both amino acid and nucleotide sequences of variable lengths [49].
Each tool offers distinct advantages, but ProtAlign-ARG's hybrid methodology addresses specific gaps in detecting novel variants while maintaining reliability across diverse sequence types.
Performance Comparison: Quantitative Benchmarking
Detection Accuracy Across ARG Classes
Table 1: Performance Comparison of ARG Identification Tools
| Tool | Methodology | Primary Strength | Recall Performance | Novel Variant Detection | Input Flexibility |
|---|---|---|---|---|---|
| ProtAlign-ARG | Hybrid pLM + Alignment | Balanced accuracy | Superior recall | Excellent | Nucleotide & protein sequences |
| PLM-ARG | Protein language model | MCC (0.983 ± 0.001) | High | Good | Protein sequences |
| DeepARG | Deep learning + similarity | Metagenomic application | Moderate | Limited | Protein sequences |
| HMD-ARG | Hierarchical multi-task CNN | Detailed annotation | Moderate | Limited | Amino acid sequences (50-1571 aa) |
| CARD-RGI | Alignment-based | Low false-positive rate | Lower (stringent cutoffs) | Poor | Nucleotide & protein sequences |
| ARGNet | Autoencoder + CNN | Variable length input | High | Good | Nucleotide & protein sequences, variable lengths |
ProtAlign-ARG demonstrates remarkable accuracy in identifying and classifying ARGs, with particular excellence in recall compared to existing tools [45]. This high recall is crucial for surveillance applications where missing true positives (false negatives) could have significant clinical implications. The hybrid approach enables ProtAlign-ARG to maintain robust performance across diverse ARG classes, including those with limited training examples.
Performance on Challenging Datasets
Table 2: Performance on Low-Homology Sequences
| Tool | Methodology | <40% Sequence Similarity | Resistance Mechanism Prediction | Mobility Prediction |
|---|---|---|---|---|
| ProtAlign-ARG | Hybrid pLM + Alignment | High performance | Yes | Yes |
| ARG-BERT | ProteinBERT | High performance | Yes | No |
| HMD-ARG | CNN | Moderate performance | Yes | Yes |
| CARD-RGI | Alignment-based | Poor performance | Limited | No |
For sequences with low homology to training data (<40% similarity), ProtAlign-ARG and specialized pLM tools like ARG-BERT maintain high performance, whereas traditional alignment-based methods like CARD-RGI struggle significantly [47]. This capability is particularly valuable for discovering novel resistance determinants that may differ substantially from known references.
ProtAlign-ARG's extension to predict functionality and mobility further distinguishes it from alternatives, providing researchers with additional dimensions for analyzing resistance potential [45].
Experimental Protocols and Methodologies
Data Curation and Partitioning Strategies
ProtAlign-ARG was developed using HMD-ARG-DB, one of the largest ARG repositories, curated from seven widely-used databases (AMRFinder, CARD, ResFinder, Resfams, DeepARG, MEGARes, and ARG-ANNOT) containing over 17,000 ARG sequences distributed across 33 antibiotic-resistance classes [45]. To address data imbalance, the model initially focused on the 14 most prevalent classes, with additional models encompassing all 33 classes.
Critical to the evaluation was rigorous data partitioning using GraphPart, a tool that ensures precise separation between training and testing datasets by enforcing a specified maximum similarity threshold [45]. This approach prevents inflated performance metrics that can occur when closely related sequences appear in both training and test sets. At a 40% similarity threshold, GraphPart provided exceptional partitioning precision compared to traditional tools like CD-HIT, where more than 50% of sequences between training and testing sets had similarity exceeding 40% (including 200 sequences with >90% similarity) [45].
Non-ARG sequences were curated from UniProt by excluding known ARGs and applying DIAMOND alignment with HMD-ARG-DB. Sequences with e-value > 1e-3 and percentage identity < 40% were classified as non-ARGs, creating a challenging negative set that forces the model to learn discriminative features beyond simple homology [45].
Model Architecture and Implementation
The ProtAlign-ARG pipeline integrates two complementary approaches:
Protein Language Model Pathway: Processes protein sequences through a pre-trained pLM to generate embeddings that capture complex contextual and functional patterns. This branch excels at identifying distant homologs and novel variants by recognizing structural and functional motifs rather than relying solely on sequence similarity.
Alignment-Based Scoring Pathway: Employs traditional alignment scoring methods (bit scores and e-values) for classification when the pLM lacks confidence in its predictions. This provides a safety net for cases with sufficient similarity to known references [45].
The model dynamically routes sequences between these pathways based on confidence thresholds, optimizing the trade-off between novel discovery and reliable detection. For the protein language model component, ProtAlign-ARG utilizes transfer learning, where a model pre-trained on vast unannotated protein sequences is fine-tuned specifically for ARG detection tasks [45].
Figure 1: ProtAlign-ARG Hybrid Workflow - The tool processes sequences through both protein language model and alignment-based pathways, with a confidence assessment determining the final classification path.
Evaluation Metrics and Comparative Testing
Performance validation employed multiple metrics with emphasis on recall (sensitivity) due to its critical importance in surveillance applications where missing true positives is costlier than false alarms. Additional metrics included precision, F1-score, and area under the receiver operating characteristic curve.
Comparative testing against existing tools (DeepARG, HMD-ARG, CARD-RGI) was conducted using both the HMD-ARG-DB dataset and the COALA dataset, the latter comprising 17,023 ARG sequences collected from 15 published databases [45]. This comprehensive evaluation across diverse datasets ensured robust assessment of generalizability beyond training distributions.
Research Implications and Applications
Advancing Intrinsic Resistance Gene Validation
The hybrid approach of ProtAlign-ARG provides significant advantages for validating intrinsic resistance gene function, a challenging aspect of resistance research. Intrinsic resistance refers to naturally occurring resistance in bacterial species without prior exposure to antibiotics, often mediated by chromosomal genes that may be difficult to distinguish from acquired resistance elements.
ProtAlign-ARG's capacity to predict ARG mobility directly addresses this challenge by helping researchers differentiate between chromosomally encoded intrinsic resistance and potentially mobile acquired resistance elements [45]. This distinction is crucial for understanding resistance dynamics and developing targeted interventions.
The protein language model component enables detection of remote homologs and functionally similar sequences that share limited sequence identity, potentially revealing previously overlooked intrinsic resistance mechanisms that have evolved independently across bacterial taxa.
One Health Surveillance Applications
The tool's high recall and capability to detect novel variants make it particularly valuable for One Health surveillance, where monitoring ARG movement across human, animal, and environmental reservoirs is essential for understanding resistance transmission pathways [45]. By reducing false negatives while maintaining reasonable precision, ProtAlign-ARG provides a more complete picture of the "resistome" across ecosystems.
Figure 2: Comprehensive ARG Analysis Workflow - From DNA sequencing data to actionable insights for One Health surveillance, demonstrating ProtAlign-ARG's role in the analytical pipeline.
Essential Research Toolkit
Table 3: Key Research Reagents and Computational Resources
| Resource | Type | Function | Application in ARG Research |
|---|---|---|---|
| HMD-ARG-DB | Database | Integrated ARG repository | Provides curated training data; combines 7 source databases with >17,000 ARG sequences |
| CARD | Database | Antibiotic resistance reference | Gold-standard for alignment-based methods; ontology for resistance mechanisms |
| UniProt | Database | Protein sequence repository | Source of non-ARG sequences for model training and negative sets |
| GraphPart | Computational tool | Data partitioning | Ensures non-redundant training/test sets; critical for model evaluation |
| ProteinBERT | Protein Language Model | Sequence representation | Captures contextual protein features; used in ARG-BERT for mechanism prediction |
| ProtAlbert | Protein Language Model | Sequence embedding | Generates protein representations; utilized in LM-ARG for classification |
| DIAMOND | Alignment tool | Sequence similarity search | Accelerated BLAST-like alignment; used for homology-based classification |
| CD-HIT | Computational tool | Sequence clustering | Reduces dataset redundancy; prepares non-redundant training sets |
This toolkit represents essential resources for implementing hybrid ARG identification approaches. The databases provide the foundational knowledge, while the computational tools enable the sophisticated analyses required for distinguishing true resistance genes from non-resistance sequences, particularly important when studying intrinsic resistance mechanisms.
ProtAlign-ARG represents a significant advancement in ARG identification by strategically integrating the pattern recognition capabilities of protein language models with the proven reliability of alignment-based methods. This hybrid approach addresses critical limitations of previous tools, particularly in detecting novel variants and maintaining performance across diverse sequence types.
For researchers focused on validating intrinsic resistance gene function, ProtAlign-ARG provides crucial capabilities for distinguishing chromosomal resistance elements from acquired resistance, predicting mobility potential, and identifying resistance mechanisms—all with reduced false-negative rates compared to existing tools.
As antibiotic resistance continues to pose grave threats to global health, hybrid methodologies like ProtAlign-ARG will play an increasingly vital role in comprehensive surveillance, novel gene discovery, and ultimately, the development of targeted interventions to curb the spread of resistance across One Health sectors.
Antimicrobial resistance (AMR) represents one of the most pressing global health threats of our time, causing an estimated 1.27 million deaths annually and contributing to nearly 5 million more [50]. The evolutionary arms race between bacteria and antibiotics began almost as soon as these "miracle drugs" were introduced into clinical practice, with the first cases of penicillin resistance documented as early as 1947 [51]. This relentless bacterial adaptation undermines modern medicine's ability to treat infectious diseases and complicates routine medical procedures, from surgeries to cancer therapies. Understanding the mechanisms driving this adaptation is not merely an academic exercise but an urgent medical necessity.
The core premise of validating intrinsic resistance gene function research rests upon systematically tracking how bacteria genetically and physiologically adapt under antibiotic selective pressure. This process occurs through complex interactions between genetic mutations, horizontal gene transfer of resistance determinants, and phenotypic adaptations such as biofilm formation [51]. Contemporary research employs diverse methodological approaches—from functional metagenomics to machine learning—to capture these dynamics. This guide objectively compares the performance, applications, and limitations of current experimental paradigms for tracking bacterial adaptation, providing researchers with a framework for selecting appropriate methodologies based on specific research objectives related to resistance gene function validation.
Methodological Comparison: Performance and Applications
Quantitative Comparison of Experimental Approaches
Table 1: Performance metrics of key methodological approaches for tracking bacterial adaptation
| Method Category | Key Strengths | Throughput | Key Limitations | Primary Applications in Resistance Research |
|---|---|---|---|---|
| Functional Metagenomics (e.g., METa Assembly) | Discovers novel resistance genes without prior sequence knowledge; captures functional potential [52]. | Moderate to High (with automation) | Requires specialized library construction; functional screening can be labor-intensive. | Discovery of novel ARGs and mechanisms; functional validation of hypothetical genes. |
| Genomic Surveillance (Metagenomics) | Provides comprehensive view of entire resistome; identifies ARG-MGE associations [53] [50]. | Very High (sequencing-based) | Does not distinguish between functional and non-functional genes; limited by database completeness. | Resistome profiling; tracking ARG dissemination; monitoring intervention impacts. |
| AI-Driven Prediction (Protein Language Models) | High accuracy (AUC up to 0.96); reduces false positives/negatives; automated analysis [54] [55]. | Very High (computational) | Model performance constrained by training data; limited interpretability for novel mechanisms. | Rapid ARG screening; phenotype prediction from genotype; prioritizing experimental validation. |
| Time-Series Forecasting (e.g., LSTM) | Captures temporal dynamics; integrates multiple predictive covariates (e.g., antibiotic use) [56]. | High (computational) | Requires extensive longitudinal data; complex model tuning. | Predicting resistance trends at facility level; informing stewardship interventions. |
Table 2: Experimental validation and resolution of each approach
| Method | Functional Validation | Spatial Resolution | Temporal Resolution | Key Identifiable Outputs |
|---|---|---|---|---|
| Functional Metagenomics | Direct (via heterologous expression) | Single gene | Snapshot (can be expanded with time-series) | Novel ARGs, efflux pumps, resistance mechanisms [52]. |
| Genomic Surveillance | Indirect (via sequence homology) | Community-level to single- contig | Snapshot to time-series | ARG abundance, diversity, host associations, MGE linkages [53]. |
| AI-Driven Prediction | Indirect (requires experimental confirmation) | Single protein sequence | Snapshot | ARG classification, resistance phenotype prediction [54]. |
| Time-Series Forecasting | Statistical correlation | Facility/population level | High (monthly trends) | Resistance rate trends, impact of antibiotic use [56]. |
Experimental Protocols for Key Methodologies
METa Assembly for Functional Metagenomics from Low-Biomass Samples
The METa assembly protocol represents a significant advancement for constructing functional metagenomic libraries from samples with limited microbial biomass, requiring 100 times less DNA than standard approaches [52]. The detailed workflow encompasses:
- DNA Extraction and Normalization: Microbial community DNA is extracted using kits optimized for low biomass (e.g., from aquarium water or swab samples). DNA concentration is normalized to 0.1-1 ng/μL.
- Enzymatic Fragmentation: DNA is fragmented using a non-specific endonuclease (e.g., Nextera tagmentation enzyme) to generate gene-sized pieces (0.5-5 kb).
- Vector Ligation and Transformation: Fragments are ligated into a copy-control fosmid vector, which is then transformed into an E. coli host strain (e.g., EPI300-T1R). This creates a library representing the functional gene content of the microbial community.
- Functional Selection and Screening: The E. coli library is plated on media containing sub-inhibitory concentrations of target antibiotics. Surviving colonies indicate the presence of functional resistance genes.
- Sequence Analysis and Validation: Plasmid DNA from resistant colonies is sequenced. Open reading frames are identified and compared against databases (e.g., CARD, NCBI NR) to annotate known genes and identify novel resistance determinants.
This protocol successfully identified new efflux pumps for tetracycline resistance from aquarium water and a novel family of streptothricin resistance proteins from human fecal samples, demonstrating its utility in discovering previously unknown resistance mechanisms [52].
Protein Language Model Framework for ARG Prediction
This deep learning approach predicts antibiotic resistance genes from protein sequences using sophisticated natural language processing techniques adapted for biological sequences [54]. The protocol involves:
- Feature Extraction: Input protein sequences are processed through two pre-trained protein language models: ProtBert-BFD, which extracts embedding vectors capturing key sequence information, and ESM-1b, which encodes features containing secondary and tertiary structural information.
- Data Augmentation: To address class imbalance in resistance gene categories, a cross-referencing augmentation method generates synthetic examples for under-represented ARG classes using both ProtBert-BFD and ESM-1b embedding results.
- Classification Model: The embedded features are processed by Long Short-Term Memory (LSTM) networks with multi-head attention mechanisms to capture dependencies in the sequence data and classify proteins as ARGs or non-ARGs across 16 resistance categories.
- Result Integration: A 16-dimensional output vector is created by integrating classification results from both language models, with the position of the maximal value determining the final ARG type prediction.
This model demonstrated superior performance compared to traditional BLAST-based and existing AI methods (DeepARG, HMD-ARG), significantly reducing both false negatives and false positives in ARG identification [54].
Time-Series Forecasting with LSTM for Facility-Level Resistance
This approach predicts facility-level antibiotic resistance trends using long short-term memory (LSTM) networks, which have outperformed traditional statistical methods like ARIMA and VAR in capturing complex temporal patterns [56]. The methodology includes:
- Data Aggregation: Monthly antimicrobial susceptibility test results are aggregated for specific pathogen-antibiotic combinations (e.g., MRSA, fluoroquinolone-resistant E. coli) from healthcare facility electronic health records.
- Predictor Variable Incorporation: Key covariates are incorporated, including:
- Antibiotic use rates (measured in defined daily doses per 1000 patient-days)
- Hospital-onset infection incidence rates
- Community-onset infection incidence (both resistant and susceptible phenotypes)
- Resistant infection incidence for related pathogens and antibiotic classes
- Temporal Lagging: Predictors are lagged from 1 to 12 months to capture delayed effects on resistance outcomes.
- Model Training and Validation: The LSTM network is trained on historical data (e.g., 2007-2019) and validated on held-out test sets, with performance measured by accuracy in predicting future resistance rates.
This approach has proven particularly valuable for predicting facility-level resistance trends, with accuracy notably enhanced by incorporating antibiotic use covariates, providing actionable intelligence for antimicrobial stewardship programs [56].
Research Workflow Visualization
Experimental Workflow for Resistance Gene Tracking
The Scientist's Toolkit: Essential Research Reagents & Platforms
Table 3: Key research reagents and computational tools for resistance gene tracking
| Reagent/Platform | Specific Examples | Primary Function in Research | Application Context |
|---|---|---|---|
| Functional Metagenomic Vectors | Copy-control fosmid vectors (e.g., pCC1FOS) | Maintain large insert DNA fragments (30-45 kb) in E. coli; enable heterologous expression of resistance genes [52]. | Functional screening of environmental DNA for novel ARGs. |
| Host Strains | EPI300-T1R E. coli | High transformation efficiency; induced copy number control for fosmid vectors. | Functional metagenomics to express foreign DNA from diverse environments. |
| Protein Language Models | ProtBert-BFD, ESM-1b [54] | Convert protein sequences into numerical embeddings capturing structural/functional features. | Deep learning-based ARG prediction and classification. |
| Time-Series Models | Long Short-Term Memory (LSTM) Networks [56] | Model complex temporal dependencies in longitudinal resistance data. | Forecasting facility-level resistance trends based on historical data. |
| Bioinformatics Databases | CARD, DeepARG, HMD-ARG [54] | Reference databases for annotating and classifying identified resistance genes. | ARG identification from sequence data; resistome analysis. |
| Antibiotic Testing Media | Mueller-Hinton agar with antibiotic gradients | Create selective pressure for functional screening of resistant clones. | Phenotypic confirmation of resistance genes identified through genomic methods. |
The expanding toolkit for tracking bacterial adaptation under antibiotic pressure reflects a paradigm shift from observational studies to predictive, mechanism-based research. No single approach provides a complete picture; rather, they function most effectively as complementary components of an integrated research strategy. Functional metagenomics excels at discovering novel resistance mechanisms without prior sequence knowledge, while genomic surveillance provides comprehensive community-level resistome profiles. AI-driven methods offer unprecedented speed and accuracy for classification tasks, and time-series modeling captures essential temporal dynamics for predictive applications.
The validation of intrinsic resistance gene function particularly benefits from methodological triangulation—combining functional metagenomics for discovery with protein language models for classification and genomic surveillance for ecological context. As these technologies continue to mature and integrate, they promise to accelerate our understanding of resistance evolution and inform more effective strategies for preserving antibiotic efficacy against rapidly adapting bacterial pathogens.
The relentless evolution of antimicrobial resistance represents one of the most pressing challenges in modern medicine. Traditional antibiotic development often engages in a defensive arms race against constantly evolving bacterial resistance mechanisms. However, an innovative offensive strategy has emerged: designing prodrugs that actively exploit a bacterium's own resistance machinery. This approach, termed "resistance hacking," transforms intrinsic resistance from a therapeutic barrier into a vulnerability [6]. Rather than evading resistance mechanisms, these engineered compounds leverage them for selective activation, creating a therapeutic Trojan horse that targets resistant pathogens with remarkable precision.
At the forefront of this paradigm is a modified version of florfenicol, known as florfenicol amine (FF-NH₂), which represents a groundbreaking proof-of-concept. This prodrug exploits the highly resistant Mycobacterium abscessus, an organism dubbed an "antibiotic nightmare" due to its extensive array of intrinsic resistance mechanisms [57] [6]. The strategy validates the functional understanding of intrinsic resistance genes by demonstrating that their expression can be hijacked to create a feed-forward loop that perpetually amplifies antibiotic activity, offering a potentially transformative framework for targeting other recalcitrant pathogens.
The Target:Mycobacterium abscessusand its Resistome
Mycobacterium abscessus is a rapidly growing non-tuberculous mycobacterium that has emerged as a significant human pathogen, particularly in patients with cystic fibrosis, chronic lung disease, or compromised immune systems [57]. This pathogen is characterized by its extensive intrinsic resistance to multiple antibiotic classes, resulting in prolonged, often ineffective treatment regimens with cure rates below 50% [57]. The therapeutic challenge posed by M. abscessus stems from its complex "resistome" - a collection of chromosomal genes that confer natural resistance.
Central to this intrinsic resistance is the transcriptional regulator WhiB7, described as a "master regulator of ribosomal stress" [6] [58]. WhiB7 controls a extensive regulon of over 100 genes involved in antimicrobial resistance, creating a coordinated defense system [57] [6]. Key among its targets are:
- erm(41): A methyltransferase that modifies the ribosomal target
- eis2: An N-acetyltransferase that modifies and inactivates antibiotics
- MAB_2989 (cat): An O-acetyltransferase that inactivates specific antibiotics
- tap and tetV: Efflux pumps that export antibiotics from the cell [57]
This sophisticated resistance network normally limits the efficacy of many ribosome-targeting antibiotics, including those in the phenicol class (e.g., chloramphenicol, thiamphenicol, and florfenicol) [57]. Understanding this functional network provided the essential foundation for developing a strategy to exploit it.
Florfenicol Amine: Mechanism of Action and Resistance Exploitation
Florfenicol amine (FF-NH₂) is a primary metabolite of the veterinary antibiotic florfenicol [57]. While the parent florfenicol compound shows limited activity against M. abscessus, the amine derivative functions as a prodrug - a biologically inactive compound that requires metabolic conversion within the body to release the active drug [59] [6]. The activation mechanism of FF-NH₂ brilliantly subverts the very resistance machinery that typically protects M. abscessus.
Table 1: Key Characteristics of Florfenicol Amine (FF-NH₂) as a Resistance-Hacking Prodrug
| Characteristic | Description | Significance |
|---|---|---|
| Chemical Nature | Amine derivative of florfenicol | Serves as a prodrug requiring enzymatic activation |
| Activity Profile | Narrow-spectrum activity against M. abscessus-chelonae complex | Targeted action minimizes microbiome disruption |
| Activation Mechanism | WhiB7-dependent bioactivation by Eis2 N-acetyltransferase | Exploits intrinsic resistance pathway |
| Active Metabolite | Florfenicol acetyl (FF-ac) | Potent inhibitor of bacterial translation |
| Resistance Hacking | Creates feed-forward bioactivation loop | Converts resistance mechanism into vulnerability |
| Toxicity Profile | Avoids mammalian mitochondrial ribosome inhibition | Reduced toxicity compared to parent phenicols |
The activation cascade begins when FF-NH₂ enters the bacterial cell, where it encounters low-level expression of the WhiB7-dependent N-acetyltransferase Eis2 [57]. Eis2 acetylates FF-NH₂, converting it into its active form, florfenicol acetyl (FF-ac) [57] [58]. This metabolite is a potent inhibitor of bacterial protein synthesis, binding to the 50S ribosomal subunit and disrupting translation [57].
The ingenious hijacking occurs through a self-perpetuating cycle: ribosomal inhibition by FF-ac induces ribosomal stress, which triggers further activation of WhiB7 [6]. This increased WhiB7 activity drives enhanced expression of eis2, leading to more efficient conversion of the prodrug to its active form, which in turn creates more ribosomal stress - establishing a powerful feed-forward loop that continuously amplifies the antibiotic's effect [57] [6] [58]. This mechanism represents a fundamental shift from conventional antibiotic approaches, where resistance genes diminish drug efficacy; here, they enhance it.
The following diagram illustrates this innovative feed-forward activation mechanism:
Diagram 1: Feed-Forward Bioactivation Cycle of Florfenicol Amine. The prodrug FF-NH₂ is activated by the resistance enzyme Eis2, initiating a self-amplifying loop that hijacks the bacterial stress response for targeted antibiotic delivery.
Comparative Analysis with Alternative Resistance-Hacking Strategies
The florfenicol amine approach represents one of several innovative strategies being developed to counter antibacterial resistance. Other promising approaches include next-generation tetracycline analogs that evade TetX-mediated inactivation, rifamycin analogs that circumvent ADP-ribosylation, and spectinomycin analogs that overcome TetV-mediated efflux [57]. Each strategy employs distinct mechanisms to bypass or exploit resistance pathways.
Table 2: Comparison of Resistance-Hacking Antibiotic Strategies
| Antibiotic Class | Resistance Mechanism Targeted | Hacking Strategy | Spectrum of Activity | Development Status |
|---|---|---|---|---|
| Florfenicol Amine | WhiB7 regulon (Eis2 acetyltransferase) | Prodrug bioactivation via resistance enzyme | Narrow (M. abscessus-chelonae complex) | Preclinical validation |
| Next-gen Tetracyclines | TetX-mediated inactivation | Structural modification to evade degradation | Broad | Advanced development |
| Modified Rifamycins | ADP-ribosylation | Structural modification to bypass modification | Broad | Research phase |
| Spectinomycin Analogs | TetV-mediated efflux | Structural modification to avoid recognition | Broad | Research phase |
The distinctive advantage of the florfenicol amine approach lies in its creation of a self-amplifying activation loop, contrasted with the more conventional strategy of simply evading resistance mechanisms. Furthermore, FF-NH₂ demonstrates a narrow spectrum of activity specifically targeting the M. abscessus-chelonae complex, which potentially preserves the host microbiome and reduces collateral damage compared to broad-spectrum alternatives [57] [6].
Experimental Validation and Methodologies
Key Experimental Protocols
The validation of FF-NH₂'s unique mechanism relied on several critical experimental approaches:
1. Bacterial Strain Susceptibility Profiling:
- Methodology: Minimum Inhibitory Concentration (MIC) determinations were performed using broth microdilution assays according to Clinical and Laboratory Standards Institute (CLSI) guidelines [57] [60]. Isogenic mutant strains including ∆whiB7 (lacking the master regulator) and ∆cat (lacking the O-acetyltransferase) were compared against wild-type M. abscessus ATCC19977 [57].
- Key Finding: FF-NH₂ exhibited a 7.6-fold increase in potency against wild-type strains (IC₅₀ 17.8 µg/mL) compared to ∆whiB7 mutants (IC₅₀ 136 µg/mL), demonstrating its unique dependence on WhiB7 for activity [57].
2. Resistance Mutation Frequency Analysis:
- Methodology: Spontaneous resistant mutants were selected on agar plates containing FF-NH₂ at concentrations of 64-256 µg/mL. Mutation frequency was calculated, and resistant colonies were isolated for sequencing to identify genomic changes [57].
- Key Finding: Resistance emerged at a frequency of ~1 × 10⁻⁶. Two distinct mutant populations were identified: large colonies with mutations in whiB7 and small colonies with mutations in eis2, confirming these as essential components of the activation pathway [57].
3. In Vivo Efficacy Assessment:
- Methodology: A murine model of M. abscessus infection was treated with FF-NH₂ to evaluate therapeutic efficacy. Toxicity was assessed by monitoring mitochondrial function and comparing to parent compounds [57] [6].
- Key Finding: FF-NH₂ demonstrated significant efficacy in reducing bacterial burden while showing markedly reduced mitochondrial toxicity compared to conventional phenicols [57] [6].
The Scientist's Toolkit: Essential Research Reagents
Table 3: Key Research Reagents for Investigating Resistance-Hacking Prodrugs
| Reagent / Tool | Function in Research | Experimental Application |
|---|---|---|
| Isogenic Mutant Strains (e.g., ∆whiB7, ∆eis2, ∆cat) | Define genetic determinants of resistance and activation | Comparative susceptibility testing and pathway validation |
| Nebraska Transposon Mutant Library (or equivalent) | Genome-wide identification of intrinsic resistance determinants | High-throughput screening for hypersusceptibility mutants [60] |
| RNA Sequencing (RNA-seq) | Transcriptional profiling of resistance regulons | Mapping WhiB7-dependent gene expression changes under antibiotic stress [57] |
| Mariner Transposon System | Saturation mutagenesis for functional genomics | Construction of comprehensive mutant libraries for Tn-seq studies [61] |
| Galleria mellonella Infection Model | Intermediate in vivo efficacy screening | Assessment of treatment efficacy prior to mammalian studies [60] |
| Murine Infection Models | Preclinical therapeutic validation | Evaluation of compound efficacy and safety in mammalian systems [57] |
Discussion and Future Perspectives
The development of florfenicol amine represents a paradigm shift in antibiotic strategy, moving from circumventing resistance to actively exploiting it. This approach provides compelling validation for the functional study of intrinsic resistance genes, demonstrating that detailed understanding of bacterial stress responses can reveal unexpected therapeutic opportunities. The narrow-spectrum nature of FF-NH₂ is particularly advantageous in an era increasingly concerned with microbiome preservation and targeted antimicrobial therapy.
Several promising research directions emerge from this work. First, the "resistance hacking" concept may be generalizable to other pathogens with well-characterized intrinsic resistance mechanisms. As noted by researchers, "With data science and structural biology, we can begin to identify high-impact proteins in clinically relevant pathogens" [58]. Second, combination therapies cycling FF-NH₂ with conventional antibiotics may prevent resistance development and provide synergistic effects [6]. Third, structural refinement of florfenicol analogs may improve their pharmacokinetic properties and therapeutic index [58].
The successful exploitation of the WhiB7-Eis2 axis in M. abscessus underscores the importance of fundamental research into bacterial resistance mechanisms. What initially appears to be a therapeutic barrier can, with sufficient understanding, be transformed into a vulnerability. This approach offers a promising pathway for addressing the growing threat of multidrug-resistant bacterial infections, particularly for vulnerable patient populations for whom conventional therapies have failed.
Florfenicol amine stands as a groundbreaking example of therapeutic exploitation, transforming the formidable resistance machinery of M. abscessus into an Achilles' heel. By hijacking the WhiB7-dependent stress response and specifically the Eis2 acetyltransferase, this prodrug creates a self-amplifying activation loop that effectively turns the pathogen's defenses against itself. The extensive experimental validation of this approach - from genetic studies to animal models - provides a robust template for future efforts to develop resistance-hacking therapeutics. As the antimicrobial resistance crisis deepens, such innovative strategies that fundamentally rethink the relationship between antibiotics and bacterial resistance will become increasingly essential components of the therapeutic arsenal.
Navigating Challenges in Resistance-Proofing and Evolutionary Recovery
A fundamental challenge in antimicrobial drug development and genetics is the phenomenon of evolutionary recovery, whereby microorganisms bypass targeted genetic disruptions through compensatory mutations. This process undermines therapeutic strategies aimed at disabling intrinsic resistance mechanisms, as bacteria and yeast can exploit evolutionary pathways to restore fitness and resistance profiles. Groundbreaking research demonstrates that a significant fraction of genetic perturbations once considered lethal can be overcome through adaptive evolution, revealing evolutionary robustness as a critical property of biological systems [62] [63]. Understanding the molecular principles governing this adaptability is paramount for designing next-generation therapeutic interventions with prolonged efficacy against rapidly evolving pathogens.
This review synthesizes evidence from systematic studies across model organisms to compare how different types of genetic disruptions—from single gene knockouts to complex mutualistic dependencies—can be bypassed through distinct evolutionary trajectories. We examine the quantitative dimensions of gene essentiality, the predictability of compensatory mechanisms, and the implications for validating intrinsic resistance genes as sustainable drug targets.
Quantitative Dimensions of Gene Essentiality
The Spectrum of Gene Dispensability
Traditional binary classifications of genes as "essential" or "non-essential" fail to capture the dynamic nature of gene requirements across evolutionary timescales. Systematic analyses in Saccharomyces cerevisiae reveal that approximately 9-17% of essential genes can be bypassed through adaptive evolution, establishing gene essentiality as a quantitative property spanning a genome-wide gradient [62] [63]. This gradient of evolvability correlates with specific gene properties: dispensable essential genes are frequently enriched for membrane-associated proteins, more likely to have paralogs, and depleted from core protein complexes compared to non-bypassable essential genes [62].
Table 1: Properties Distinguishing Dispensable versus Indispensable Essential Genes
| Property | Dispensable Essential Genes | Indispensable Essential Genes |
|---|---|---|
| Paralog Presence | Enriched | Depleted |
| Protein Complex Membership | Depleted | Enriched |
| Cellular Localization | Often membrane-associated | Diverse localization |
| Coexpression Degree | Lower | Higher |
| Functional Categories | Nuclear-cytoplasmic transport, signaling, secretion | Translation, protein degradation, RNA processing |
The functional context significantly influences evolutionary recovery potential. In E. coli, disruptions to different intrinsic resistance pathways show varying capacities for bypass. Knockouts in efflux pump components (e.g., ΔacrB) demonstrate substantially compromised ability to evolve resistance compared to mutants in cell envelope biogenesis (e.g., ΔrfaG, ΔlpxM), establishing efflux inhibition as a more promising resistance-proofing strategy [2] [15].
Compensatory Evolution in Clinical Pathogens
The evolutionary recovery phenomenon extends beyond laboratory models to clinically significant pathogens. Genomic epidemiology of Mycobacterium tuberculosis in Cape Town, South Africa, demonstrated that compensatory evolution significantly enhanced the transmission of rifampicin-resistant strains [64]. Strains with compensatory mutations were associated with smear-positive pulmonary disease and showed increased transmission between individuals, independent of other patient and bacterial factors [64]. This evidence underscores the clinical relevance of evolutionary recovery mechanisms in sustaining drug-resistant epidemics.
Comparative Experimental Models of Evolutionary Recovery
Microbial Model Systems
Experimental evolution studies utilize diverse model systems to elucidate the principles governing evolutionary recovery:
Single-Gene Knockouts: Systematic screening of the E. coli Keio collection identified 35 and 57 knockouts hypersensitive to trimethoprim and chloramphenicol, respectively, with enrichment in cell envelope biogenesis, membrane transport, and information transfer pathways [2] [15].
Obligate Mutualisms: Two-strain E. coli consortia engineered for metabolic cross-feeding demonstrate that evolutionary rescue under lethal stress occurs through mutualism breakdown, where one partner reverts to metabolic autonomy rather than specific stress adaptation [65].
DNA Replication Stress: S. cerevisiae with constitutive replication stress (ctf4Δ) exhibits remarkable robustness in compensatory evolution, with parallel genetic solutions emerging across different nutrient environments [66].
Table 2: Experimental Systems for Studying Evolutionary Recovery
| Experimental System | Perturbation Type | Key Findings | Convergence of Evolutionary Paths |
|---|---|---|---|
| E. coli Keio Knockouts [2] | Single gene deletions in intrinsic resistance pathways | ΔacrB most compromised in evolving resistance; cell envelope mutants recover more readily | Variable; dependent on pathway targeted |
| S. cerevisiae Essential Gene Deletions [62] | Deletion of essential genes with temperature-sensitive alleles | 17% of essential genes bypassable; properties predictive of dispensability | High within functional modules |
| M. tuberculosis Clinical Isolates [64] | Drug-resistance conferring mutations | Compensatory mutations enhance in vivo fitness and transmission | Evidence of convergent evolution in clinical settings |
| Obligate E. coli Mutualism [65] | Cross-feeding dependency under abiotic stress | >80% rescue via autonomy reversion; increased stress sensitivity | Pathway depends on stressor type |
| S. cerevisiae Replication Stress [66] | Constitutive DNA replication stress (ctf4Δ) | High parallelism across environments; novel adaptive mutations in mediator complex | High robustness across environments |
Experimental Evolution Workflows
Standardized methodologies enable direct comparison of evolutionary recovery across genetic backgrounds and selective environments:
Diagram 1: Experimental evolution workflow for identifying compensatory mutations. This generalizable approach involves propagating perturbed populations under selection with periodic monitoring to track recovery dynamics and identify causal mutations through genomic analysis [2] [67] [65].
Mechanisms of Bypass Suppression and Compensatory Adaptation
Molecular Pathways for Evolutionary Recovery
Compensatory evolution employs diverse genetic strategies to overcome genetic disruptions:
Gene Expression Alterations: In E. coli hypersensitive to trimethoprim, recovery frequently involved upregulation of the drug target (dihydrofolate reductase) rather than mutations directly compensating for the disrupted intrinsic resistance pathway [2] [15].
Aneuploidy and Ploidy Changes: Adaptive evolution in yeast frequently leverages whole-chromosome aneuploidies and ploidy variations to adjust gene dosage, particularly for overcoming deficiencies in nucleoporin genes and other essential complex components [62] [63].
Horizontal Gene Transfer: In environmental antimicrobial resistance, the mobility of antibiotic resistance genes (ARGs) via plasmids and other mobile genetic elements enables rapid bypass of susceptibility through acquisition of functional replacements [68].
Metabolic Rewiring: Obligate cross-feeding consortia overcome stress through reversion to metabolic autonomy via mutations that restore biosynthetic capabilities, effectively bypassing the mutualistic dependency [65].
Signaling Pathway Regulation in Evolutionary Recovery
Transcriptional reprogramming represents a fundamental mechanism for evolutionary recovery, as exemplified by regulatory factors modulating resistance pathways:
Diagram 2: Two-component regulatory system in stress response and resistance. Response regulators like AHA_4052 in Aeromonas hydrophila directly bind promoter regions of resistance genes, coordinating multifaceted adaptive responses to antibiotic and environmental stresses [69].
Research Toolkit: Essential Reagents and Methodologies
Table 3: Essential Research Reagents and Methodologies for Evolutionary Recovery Studies
| Reagent/Method | Function | Example Application |
|---|---|---|
| Keio Collection (E. coli) [2] | Genome-wide single-gene knockout library | Identification of hypersensitive mutants to antibiotics |
| Temperature-Sensitive Alleles (S. cerevisiae) [62] | Conditional essential gene disruption | Bypass suppression screens for essential genes |
| Experimental Evolution [67] [65] | Direct observation of adaptation | Tracking compensatory mutation trajectories |
| Whole-Genome Sequencing [64] [62] | Identification of causal mutations | Characterizing compensatory mutations in evolved lineages |
| ChIP-PCR [69] | Protein-DNA interaction mapping | Validating direct targets of transcriptional regulators |
| Label-Free Quantitative Proteomics [69] | Global protein expression profiling | Identifying pathway alterations in compensatory evolution |
| Plasmid Capture Methods [68] | Mobile genetic element isolation | Assessing horizontal transfer potential of resistance genes |
Protocol: Genome-Wide Hypersensitivity Screening
The standardized approach for identifying genes involved in intrinsic resistance involves:
Library Preparation: Culture arrayed knockout collections (e.g., Keio collection for E. coli) in duplicate in rich media [2] [15].
Antibiotic Challenge: Transfer cultures to media containing antibiotics at predetermined IC50 concentrations alongside non-treated controls [2] [15].
Growth Quantification: Measure optical density at 600 nm after specified incubation period, normalized to wild-type growth [2].
Hit Identification: Classify knockouts with growth lower than two standard deviations from the population median as hypersensitive [2] [15].
Validation: Confirm hypersensitivity phenotypes using solid media supplemented with serial antibiotic dilutions [2].
Protocol: Experimental Evolution for Compensatory Mutation Identification
Founder Population Initiation: Establish multiple replicate populations from genetically perturbed strain [67] [65].
Selection Regime: Propagate populations under consistent selective pressure (antibiotic, nutrient limitation, etc.) for predetermined generations (typically 150-400) [67] [66].
Serial Transfer: Dilute populations into fresh selective media at regular intervals, maintaining population sizes sufficient for mutation supply [67] [65].
Fitness Monitoring: Track population density and growth rates throughout evolution experiment to identify recovery trajectories [65].
Endpoint Analysis: Sequence genomes of evolved clones, compare to ancestor to identify compensatory mutations [67] [64] [62].
Implications for Drug Development and Resistance Management
The predictable nature of evolutionary recovery necessitates strategic approaches to antibiotic development and resistance management:
Target Selection Prioritization: Genes with lower evolutionary potential—those encoding highly connected proteins in essential complexes with minimal paralogs—represent superior targets for sustained efficacy [62] [63].
Combination Therapy Rationale: Simultaneously targeting both intrinsic resistance mechanisms and primary drug targets creates higher evolutionary barriers, particularly when targeting functionally distinct pathways [2] [15].
Resistance Monitoring: Surveillance programs should track not only primary resistance mechanisms but also emerging compensatory mutations that restore fitness to resistant strains, as demonstrated in the M. tuberculosis transmission study [64].
Environmental Risk Assessment: Integrating mobility potential of antibiotic resistance genes into quantitative microbial risk assessment frameworks enables more accurate prediction of resistance dissemination in environmental compartments [68].
The expanding toolkit for studying evolutionary recovery—from genome-wide mutant collections to experimental evolution protocols—provides unprecedented insight into the predictable aspects of bacterial and fungal adaptation. By applying these methodologies systematically across genetic backgrounds and selective environments, researchers can progressively map the evolutionary landscape surrounding potential drug targets, enabling strategic prioritization of interventions with the highest probability of long-term efficacy against evolving pathogens.
Within the broader context of validating intrinsic resistance gene function, investigating efflux pumps—critical components of bacterial multidrug resistance (MDR)—has become a research priority [14] [70]. These transmembrane transporters actively extrude antibiotics from bacterial cells, significantly reducing intracellular drug concentrations and compromising treatment efficacy [71] [26]. Two primary strategies have emerged for targeting these systems: genetic inhibition (e.g., gene knockout) and pharmacological inhibition using small molecules known as Efflux Pump Inhibitors (EPIs) [71] [72]. While both approaches aim to restore antibiotic susceptibility, they manifest profoundly different long-term consequences for bacterial physiology, resistance evolution, and therapeutic utility. This guide objectively compares the experimental performance, outcomes, and applications of these distinct targeting strategies, providing researchers with a structured analysis to inform experimental design and therapeutic development.
Mechanisms of Efflux Pump-Mediated Resistance and Inhibition
Bacterial efflux pumps are complex molecular machines that confer resistance to a broad spectrum of antimicrobial agents. Understanding their structure and function is foundational to developing targeted inhibition strategies.
Key Efflux Pump Systems and Their Clinical Relevance
Major efflux pumps belong to several families based on their structure and energy source, including the Resistance-Nodulation-Division (RND) family, which is particularly significant in Gram-negative pathogens [70]. The table below summarizes prominent efflux pump systems and their roles in clinical resistance.
Table 1: Clinically Significant Bacterial Efflux Pump Systems
| Efflux Pump System | Bacterial Species | Primary Antibiotic Substrates | Clinical Resistance Association |
|---|---|---|---|
| AcrAB-TolC [71] [26] | Escherichia coli | Fluoroquinolones, β-lactams, Aminoglycosides, Tetracyclines, Macrolides | Major contributor to MDR in hospital-acquired infections [71] [26] |
| MexAB-OprM [73] | Pseudomonas aeruginosa | β-lactams, Quinolones, Chloramphenicol, Trimethoprim, Sulfonamides | Intrinsic resistance to multiple drug classes |
| MexEF-OprN [73] | Pseudomonas aeruginosa | Quinolones, Chloramphenicol, Trimethoprim | Inactivation linked to increased virulence and altered quorum sensing [73] |
| NorA [74] | Staphylococcus aureus | Fluoroquinolones | Associated with fluoroquinolone resistance in clinical isolates |
Molecular Mechanisms of Inhibition
Genetic and pharmacological inhibition operate via distinct mechanisms to block efflux pump function.
Genetic Inhibition: This approach involves the direct deletion or disruption of genes encoding efflux pump components. For example, knocking out the mdtA gene in E. coli prevents the synthesis of the MdtA transporter protein, permanently disabling that specific efflux system and leading to the intracellular accumulation of its substrate compounds [72]. This is a targeted, irreversible intervention.
Pharmacological Inhibition: EPIs are small molecules that bind to efflux pumps, blocking their function without affecting gene expression or protein synthesis. They act as competitive or non-competitive substrates, binding to the transporter and physically obstructing antibiotic extrusion. Examples include Phenylalanine-Arginine Beta-Naphthylamide (PAβN) and Carbonyl Cyanide m-Chlorophenylhydrazone (CCCP) [71] [26]. This is a transient, reversible intervention.
The following diagram illustrates the fundamental mechanistic differences between these two strategies.
Experimental Outcomes and Performance Comparison
Direct comparative studies reveal that the choice of inhibition strategy significantly impacts experimental readouts, from immediate efficacy to long-term adaptive responses.
Quantitative Efficacy in Restoring Antibiotic Susceptibility
Both strategies are effective at resensitizing bacteria to antibiotics, but the magnitude of this effect can be measured and compared.
Table 2: Quantitative Comparison of Inhibition Efficacy from Experimental Studies
| Inhibition Strategy | Experimental Model | Key Quantitative Outcome | Reference |
|---|---|---|---|
| Pharmacological (EPI: PAβN) | MDR E. coli | ≥4-fold reduction in MIC for fluoroquinolones & β-lactams; Susceptibility restoration RR: 4.2 (95% CI: 3.0–5.8) [71] [26] | Systematic Review/Meta-analysis |
| Genetic Knockout (ΔmdtA) | E. coli Biosensor | Up to 19-fold increase in biosensor sensitivity to phenolic ligands [72] | Original Research |
| Genetic Knockout (ΔmexEF-oprN) | P. aeruginosa | Increased virulence in vivo; ~10-fold higher lung bacterial burdens in mice [73] | Original Research |
Long-Term Consequences and Bacterial Adaptation
The most striking divergence between the two strategies emerges over the long term, concerning bacterial adaptation, fitness, and the evolution of resistance.
Genetic Inhibition: Knockouts provide a stable, heritable loss of function. However, this can trigger complex compensatory adaptations. A seminal study on P. aeruginosa showed that inactivation of the mexEF-oprN efflux pump led to elevated quorum sensing (QS) and increased production of virulence factors like elastase and rhamnolipids [73]. Consequently, these knockout mutants demonstrated hypervirulence in an acute lung infection model, causing 90% mortality in mice within 48 hours compared to 50% for the wild-type strain over 96 hours [73]. This demonstrates that genetic inactivation of a resistance mechanism can inadvertently enhance pathogenesis.
Pharmacological Inhibition: The primary challenge with EPIs is the potential for independent resistance development. Bacteria can develop reduced permeability to EPIs, mutate EPI binding sites, or upregulate alternative efflux systems [71] [70]. Furthermore, many promising EPIs, such as PAβN and CCCP, face significant hurdles in clinical translation due to toxicity concerns and poor pharmacokinetic profiles [71] [70]. Their activity in vitro does not always translate to in vivo efficacy.
Table 3: Comparison of Long-Term Outcomes and Adaptation
| Parameter | Genetic Inhibition | Pharmacological Inhibition |
|---|---|---|
| Stability of Effect | Permanent and heritable | Transient and reversible |
| Common Compensatory Adaptations | Upregulation of virulence pathways (e.g., QS) [73] | Mutation of EPI binding sites; Overexpression of other pumps |
| Impact on Virulence | Can significantly increase (e.g., P. aeruginosa) [73] | Typically neutral, but not well-studied |
| Clinical Translation Barrier | Not directly therapeutic; a research tool | Toxicity and pharmacokinetics of EPIs [71] [70] |
Detailed Experimental Protocols
To ensure reproducibility, below are detailed methodologies for key experiments evaluating both inhibition strategies.
Protocol for Evaluating Pharmacological EPI Efficacy
This protocol outlines the standard broth microdilution method to determine the Minimum Inhibitory Concentration (MIC) in the presence of an EPI.
- Primary Objective: To assess the ability of an EPI to restore antibiotic susceptibility in a resistant bacterial strain.
Materials:
- Bacterial Strain: MDR clinical isolate (e.g., E. coli overexpressing acrAB-tolC) [71] [26].
- Efflux Pump Inhibitor (EPI): e.g., Phenylalanine-Arginine Beta-Naphthylamide (PAβN), dissolved in a suitable solvent like DMSO [71] [26].
- Antibiotics: A range of relevant antibiotics (e.g., fluoroquinolones, β-lactams).
- Culture Media: Cation-adjusted Mueller-Hinton Broth (CAMHB).
- Equipment: 96-well microtiter plates, spectrophotometer for measuring Optical Density (OD).
Procedure:
- Prepare a logarithmic-phase bacterial inoculum standardized to approximately 5 × 10^5 CFU/mL in CAMHB.
- In a 96-well plate, create a two-dimensional checkerboard of serial dilutions of the antibiotic and the EPI. A typical final concentration for PAβN is 10-50 µg/mL [26].
- Include controls: growth control (bacteria, no drugs), sterility control (media only), and solvent control (highest concentration of DMSO used).
- Incubate the plate at 37°C for 16-20 hours.
- Determine the MIC of the antibiotic alone and in combination with various concentrations of the EPI. The MIC is defined as the lowest concentration that prevents visible growth.
- Data Analysis: A ≥4-fold reduction in the MIC of the antibiotic in the presence of the EPI is considered a positive result, indicating successful efflux inhibition [71] [26].
Protocol for Biosensor-Based Sensitivity Assay Using Genetic Knockout
This protocol uses a transcription factor-based biosensor to quantify the intracellular accumulation of a compound in an efflux pump knockout strain [72].
- Primary Objective: To measure the functional consequence of an efflux pump knockout on intracellular ligand accumulation.
Materials:
- Bacterial Strains: Wild-type and efflux pump knockout (e.g., E. coli BW25113 ΔmdtA) [72].
- Biosensor Plasmid: Plasmid containing a ligand-responsive transcription factor (e.g., DmpR M52I mutant for phenols) and a reporter gene (e.g., sfgfp for green fluorescent protein) [72].
- Ligand/Phenolic Compound: The substrate of the efflux pump (e.g., HPPA for PGA activity screening).
- Media: LB for growth, M9 minimal medium with acetate for induction [72].
- Equipment: Fluorescence microplate reader, flow cytometer for high-throughput screening.
Procedure:
- Transform the biosensor plasmid into both wild-type and knockout strains.
- Grow cultures in LB medium at 37°C to mid-log phase (OD600 ~0.5-0.8).
- Harvest cells by centrifugation and resuspend in M9 minimal medium containing acetate to halt growth and promote σ54-dependent transcription from the biosensor.
- Treat the cells with the target ligand at various concentrations.
- Incubate the cultures at 37°C for a set period (e.g., 16 hours) to allow for reporter protein expression.
- Measurement: Measure fluorescence intensity (Ex/Em: 485/535 nm for GFP) and normalize to the optical density (OD600) of the culture.
- Data Analysis: Compare the dose-response curves (fluorescence vs. ligand concentration) between wild-type and knockout strains. An increase in signal intensity and sensitivity in the knockout strain indicates improved intracellular ligand accumulation due to the absence of the efflux pump [72].
The workflow for this biosensor-based assay is illustrated below.
The Scientist's Toolkit: Essential Research Reagents
Successful investigation into efflux pump inhibition requires a specific set of reagents and tools.
Table 4: Key Research Reagent Solutions for Efflux Pump Studies
| Reagent / Material | Function / Application | Example & Notes |
|---|---|---|
| Defined Knockout Strains | To study the specific function of an efflux pump without compensation from other systems. | Keio Collection E. coli strains [72]; Essential for clean genetic comparisons. |
| Standardized EPIs | Positive controls for pharmacological inhibition experiments. | PAβN, CCCP [71] [26]; Note: Many have toxicity issues limiting clinical use. |
| Reporter Biosensor Systems | To quantitatively measure intracellular concentrations of efflux pump substrates. | DmpR-based Genetic Enzyme Screening System (GESS) [72]; Enables real-time, sensitive detection. |
| qPCR/RNA-seq Reagents | To quantify efflux pump gene expression levels under different conditions. | Probes and primers for genes like acrB [71] [26]; Critical for linking phenotype to genotype. |
Integrated Discussion and Research Applications
The experimental data clearly delineate the roles for genetic and pharmacological inhibition. Genetic knockout is an indispensable tool for basic research for validating the native biological function of an efflux pump, including its role in intrinsic resistance and its integration into broader regulatory networks like virulence and quorum sensing [72] [73]. The finding that mexEF-oprN inactivation increases virulence is a discovery that would be difficult to make with transient pharmacological inhibition alone.
Conversely, pharmacological inhibition represents a direct therapeutic strategy aimed at resensitizing resistant pathogens to existing antibiotics [71] [70]. The meta-analysis confirming that EPIs significantly restore antibiotic susceptibility underscores their potential clinical value [71] [26]. However, the divergence in long-term outcomes is critical: while genetic knockout can unveil unexpected, potentially detrimental phenotypes like hypervirulence, the pharmacological approach is hampered by compound-specific challenges like toxicity and bacterial resistance.
Therefore, a robust research program should leverage both strategies in a complementary manner. Genetic studies can identify the most promising and "druggable" efflux pump targets, the inhibition of which does not lead to deleterious compensatory mechanisms. Subsequently, high-throughput screens using biosensor-equipped knockout strains [72] can efficiently identify novel, potent, and safe EPIs against these validated targets, ultimately paving the way for effective combination therapies to combat multidrug-resistant infections.
Antimicrobial resistance (AMR) presents a critical global health threat, with traditional diagnostic approaches often failing to assess the mobility potential of antibiotic resistance genes (ARGs). This gap significantly limits risk assessment accuracy, as the horizontal transfer of ARGs via mobile genetic elements (MGEs) represents a primary mechanism for resistance dissemination. This guide compares current and emerging methodologies for integrating mobility potential into AMR risk assessment, providing experimental protocols, quantitative data comparisons, and essential research tools. Framed within the broader context of validating intrinsic resistance gene function, we demonstrate how advanced surveillance strategies that account for genetic context and transfer potential can transform our ability to predict and mitigate AMR spread across One Health compartments.
The global burden of antimicrobial resistance continues to escalate, with bacterial AMR directly causing approximately 1.14 million deaths annually [68]. While traditional diagnostics focus on identifying ARGs and their phenotypic expression, this approach provides an incomplete risk picture as it largely ignores the mobility potential of these resistance determinants [68]. The horizontal gene transfer of ARGs via mobile genetic elements (MGEs) such as plasmids, transposons, and integrons dramatically accelerates resistance dissemination across bacterial populations and between environments [75].
Current environmental AMR surveillance practices face significant limitations in risk analysis because they typically quantify ARG abundance without considering genetic context [68]. An ARG historically associated with treatment failure and ranked as high risk may pose minimal immediate threat if located chromosomally in a non-pathogenic, non-colonizing bacterium with low transmissibility potential [68]. This oversight can lead to flawed risk prioritization and ineffective mitigation strategies.
Integrating mobility assessment into diagnostic frameworks represents a paradigm shift in how we evaluate AMR risk, particularly for intrinsic resistance genes whose function may be validated through understanding their transfer mechanisms. By moving beyond simple presence/absence detection to characterize genetic context and transfer potential, researchers and drug development professionals can better predict which resistance genes pose the most immediate clinical threats and prioritize intervention strategies accordingly [68].
Comparative Analysis of AMR Diagnostic Approaches
Methodologies for Detection and Mobility Assessment
Table 1: Comparison of AMR Diagnostic and Mobility Assessment Methods
| Method | Key Applications | Mobility Assessment Capability | Throughput | Limitations |
|---|---|---|---|---|
| Phenotypic AST [76] | Pathogen identification & resistance profiling | None | Medium | Slow (24-48 hrs), no genetic mechanism data |
| PCR/qPCR [77] [68] | Target-specific ARG detection | Indirect (primers for MGE-associated ARGs) | High | Limited to known targets, no context for unknown sequences |
| Microarrays [77] | Multiplex ARG screening | Limited (via probe design for MGE markers) | High | Pre-designed targets only, declining use |
| Whole-Genome Sequencing [77] [68] | Comprehensive ARG profiling | High (via assembly-based MGE linkage) | Medium | Computational complexity, cost barriers |
| Metagenomics [78] [68] | Culture-free resistome analysis | Medium (correlation analysis of ARGs & MGEs) | Variable | Sensitivity limits (∼1 gene copy/10³ genomes) |
| Metatranscriptomics [78] | Active resistome analysis | Emerging (expression of MGE-associated ARGs) | Low | Technical complexity, RNA stability issues |
| CRISPR-Based Detection [76] | Ultra-specific ARG identification | Limited (unless combined with other methods) | High | Primarily for detection, not context |
| MALDI-TOF MS [77] [76] | Rapid pathogen ID & resistance profiling | None | High | Limited mechanism information |
Quantitative Performance Metrics
Table 2: Quantitative Performance Comparison of AMR Diagnostic Platforms
| Platform/Technology | Time to Result | Sensitivity | Cost per Sample | Mobility Data Integration |
|---|---|---|---|---|
| Conventional PCR [77] | 4-5 hours | High (single copy detection) | $ | Low |
| Real-time PCR (qPCR) [77] [68] | 1-2 hours | High (1 copy/10⁵-10⁷ genomes) | $$ | Low-Medium |
| Multiplex PCR [77] | 2-4 hours | High for targeted ARGs | $$ | Medium |
| Loop-mediated Isothermal Amplification (LAMP) [77] | 30-60 minutes | Medium-High | $ | Low |
| Automated Systems (VITEK 2, Phoenix) [76] | 4-15 hours | High for cultivable pathogens | $$$ | None |
| Whole-Genome Sequencing [77] [68] | 1-3 days | Medium (1 copy/10³ genomes) | $$$$ | High |
| Metagenomic Sequencing [78] [68] | 2-5 days | Low-Medium | $$$$ | Medium-High |
| CRISPR-Cas Systems [76] | 15-60 minutes | High | $$ | Low |
Data Interpretation: Key Considerations
When comparing diagnostic approaches, researchers must consider that methods with higher mobility assessment capability (e.g., whole-genome sequencing) typically require greater computational resources and expertise but provide more comprehensive risk assessment data [68]. Techniques with lower mobility assessment capability (e.g., PCR, phenotypic methods) offer faster turnaround times but may overestimate risk by detecting ARGs without contextual information about their transfer potential [68].
Quantitative PCR demonstrates the highest sensitivity among molecular methods but cannot determine whether detected ARGs are associated with mobile genetic elements without additional experimental approaches [68]. Metagenomic methods offer culture-independent analysis of complex samples but have limited sensitivity compared to target-specific approaches, potentially missing low-abundance ARGs that may still pose transmission risks [68].
Experimental Protocols for Mobility Assessment
Metagenomic Workflow for ARG-MGE Association
Protocol Objective: To identify associations between antibiotic resistance genes and mobile genetic elements in complex microbial communities without cultivation.
Sample Preparation:
- Collect environmental or clinical samples (e.g., soil, water, fecal matter) and preserve immediately at -80°C or in appropriate stabilization buffers
- Extract high-molecular-weight DNA using kits designed for complex samples (e.g., MoBio PowerSoil DNA Isolation Kit)
- Assess DNA quality via spectrophotometry (A260/A280 ratio of 1.8-2.0) and fluorometry (minimum concentration of 10 ng/μL)
- Verify DNA integrity by agarose gel electrophoresis (sharp, high-molecular-weight band)
Library Preparation and Sequencing:
- Fragment DNA to desired size (typically 350-800 bp) via acoustic shearing or enzymatic fragmentation
- Prepare sequencing libraries using Illumina-compatible kits with dual indexing to enable multiplexing
- Perform quality control using Bioanalyzer or TapeStation (clear peak at expected size)
- Sequence on appropriate platform (Illumina NovaSeq for high coverage, or MiniSeq for smaller studies) with minimum 5 Gb data per sample for complex communities
Bioinformatic Analysis:
- Quality control of raw reads using FastQC and Trimmomatic for adapter removal and quality filtering
- Metagenome assembly using MEGAHIT or metaSPAdes with multiple k-mer sizes for optimal contiguity
- Gene prediction on contigs using Prodigal or FragGeneScan
- ARG annotation by comparing predicted genes against CARD database using RGI or BLAST with cutoff of ≥90% identity and ≥80% coverage
- MGE annotation by comparing against MGE databases using HMMER or BLAST
- Association analysis between ARGs and MGEs based on physical proximity on same contig (typically within 10-50 kb)
- Visualization using circos plots or network graphs to display ARG-MGE associations
This protocol enables the identification of physical linkages between ARGs and MGEs, providing direct evidence of mobility potential [78] [68].
Metatranscriptomic Analysis of Active Resistome
Protocol Objective: To characterize expressed ARGs and their association with MGEs to identify actively mobilized resistance determinants.
Sample Processing:
- Collect samples in RNA stabilization solution (e.g., RNAlater) and store at -80°C
- Extract total RNA using kits with DNase treatment to remove genomic DNA contamination
- Assess RNA quality using Bioanalyzer (RIN ≥7.0 required)
- Deplete ribosomal RNA using commercially available kits
- Prepare stranded RNA-seq libraries following manufacturer protocols
Sequencing and Analysis:
- Sequence on Illumina platform with minimum 20 million reads per sample
- Quality control as in metagenomic protocol
- Map reads to reference databases or assembled metagenomes using Bowtie2 or BWA
- Quantify expression levels as transcripts per million (TPM) for ARGs and MGEs
- Identify correlations between ARG and MGE expression to infer active mobilization
- Conduct differential expression analysis between conditions using DESeq2 or edgeR
This approach provides functional insights into which resistance genes are not only present but actively expressed and potentially mobilized, offering a more dynamic view of resistance dissemination risk [78].
The Researcher's Toolkit: Essential Reagents and Databases
Table 3: Essential Research Reagents and Databases for Mobility-Informed AMR Research
| Category | Specific Tools/Reagents | Function | Key Features |
|---|---|---|---|
| Reference Databases | CARD [75], MEGARES, ResFinder | ARG annotation & classification | Curated collections of resistance genes with mechanisms |
| MGE Databases | ACLAME, MobileElementFinder, PlasmidFinder | Identification of mobile genetic elements | Annotated plasmids, transposons, integrons |
| Bioinformatic Tools | RGI [75], metaSPAdes [78], Prokka | ARG annotation, assembly, genome annotation | Standardized analysis pipelines |
| Statistical Packages | R, Python, STATA [79] | Data analysis & visualization | Multivariate analysis, correlation testing |
| Laboratory Reagents | DNA/RNA extraction kits, library prep kits, sequencing reagents | Experimental procedures | Quality-controlled for complex samples |
| Visualization Software | ggplot2, Cytoscape, Circos | Data presentation & network analysis | Publication-ready figures |
Integrating Mobility into Risk Assessment: A Conceptual Framework
The conceptual framework above illustrates how genetic context fundamentally alters the risk assessment of detected ARGs. Traditional diagnostics that simply detect ARG presence would classify all four scenarios as "positive," potentially leading to overestimation of risk in the case of chromosomally-encoded ARGs in non-pathogenic hosts [68]. By integrating mobility and host pathogenicity data, a more nuanced risk assessment emerges that better reflects actual epidemiological threat.
This framework aligns with the "One Health" perspective recognizing the interconnectedness of human, animal, and environmental health [68] [75]. In environmental compartments where direct clinical impact may be delayed, prioritizing ARG-MGE associations provides a valuable proxy for future dissemination potential, as mobility increases the likelihood of horizontal transfer, persistence, and eventual uptake by relevant pathogens [68].
Integrating mobility potential into AMR diagnostics represents a critical evolution in how we assess and mitigate resistance risks. While traditional phenotypic and molecular methods remain valuable for specific applications, approaches that capture genetic context—particularly the association between ARGs and MGEs—provide transformative insights for risk assessment [68].
The experimental protocols and comparative data presented here demonstrate that methodologies like metagenomics and metatranscriptomics, despite their current limitations in sensitivity and complexity, offer unparalleled ability to identify high-risk ARG-MGE combinations that pose the greatest threat for dissemination [78] [68]. As these technologies continue to advance and become more accessible, their integration into routine surveillance will enhance our ability to prioritize interventions and track resistance dissemination pathways across One Health compartments.
For researchers validating intrinsic resistance gene function, incorporating mobility assessment provides crucial context for understanding how these genes may transfer between bacterial populations, potentially moving from intrinsic to acquired resistance mechanisms in pathogenic species. This approach ultimately supports more targeted, effective strategies for combating the global AMR crisis.
The evolution of antimicrobial resistance (AMR) represents a fundamental challenge in treating infectious diseases and cancer. Resistance can be acquired through genetic mutations or horizontal gene transfer, but a significant component is intrinsic resistance—the innate, chromosomally encoded capability of a pathogen or cancer cell to survive therapeutic exposure [80]. This intrinsic resistome comprises a diverse set of elements including drug efflux pumps, antibiotic-inactivating enzymes, cellular envelope impermeability, and metabolic pathways that collectively determine the baseline susceptibility phenotype [80]. The clinical definition of intrinsic resistance is straightforward: a microorganism is considered intrinsically resistant when infections cannot be successfully treated with a given antibiotic, primarily due to lack of target accessibility, antibiotic inactivation, or efflux mechanisms [80].
Understanding this intrinsic resistome is crucial for developing strategies to combat resistance emergence. As the World Health Organization emphasizes, coordinated action frameworks are needed to address the growing threat of drug resistance across HIV, hepatitis, sexually transmitted infections, and other diseases [81]. This guide compares two primary antibiotic stewardship strategies—cycling and mixing—evaluating their effectiveness in preventing resistance emergence within the context of intrinsic resistance mechanisms, and provides experimental methodologies for validating resistance gene function.
Cycling vs. Mixing Strategies: Theoretical Foundations and Operational Frameworks
Antibiotic cycling and mixing represent two structured approaches to antimicrobial stewardship designed to reduce selection pressure for resistant strains. Understanding their operational differences is essential for optimal implementation.
Cycling Strategy (Rotation)
In the cycling strategy (also called rotation strategy), a specified antibiotic is empirically used as a preferred option during a scheduled period for patients whose pathogenic microorganisms are unidentified. After this predetermined period, another antibiotic from a different class becomes the first choice for all patients requiring antibacterial treatment [82]. This approach aims to create alternating selection pressures that prevent any single resistant subpopulation from becoming dominant.
Mixing Strategy
In the mixing strategy, the first-line antibiotic alternates in consecutive patients according to a pre-established protocol, rather than being changed across all patients simultaneously [82]. This approach maximizes heterogeneity in antibiotic exposure within a patient population at any given time, theoretically reducing the overall selection advantage for any particular resistant variant.
The diagram below illustrates the operational differences between these two approaches:
Comparative Efficacy Analysis: Quantitative Outcomes from Clinical Studies
A 2020 systematic review and meta-analysis published in PMC provides comprehensive quantitative data comparing the effectiveness of cycling and mixing strategies in intensive care units (ICUs) [82]. The analysis included 12 studies involving 2,261 episodes of resistant infections or colonization and 160,129 patient days, offering robust evidence for comparative assessment.
Table 1: Comparative Outcomes of Antibiotic Cycling vs. Mixing Strategies
| Outcome Measure | Cycling Strategy Performance | Mixing Strategy Performance | Statistical Significance |
|---|---|---|---|
| Overall incidence of resistant infections/colonization | Risk Ratio = 0.823 (95% CI 0.655-1.035) | Reference | p = 0.095 (non-significant) |
| Comparison with baseline period | Significant reduction | Not applicable | p = 0.028 |
| Direct comparison with mixing | No advantage demonstrated | Reference | p = 0.758 (non-significant) |
| Secondary outcomes (ICU mortality, hospital mortality, VAP, nosocomial infection) | No significant difference | No significant difference | Not significant |
The meta-analysis revealed that while cycling strategies showed a statistically significant reduction in resistant bacteria compared to baseline periods of relatively free antibiotic usage, they demonstrated no comparative advantage when directly evaluated against mixing strategies [82]. This suggests that both structured approaches represent improvements over unregulated antibiotic use, but neither cycling nor mixing demonstrates clear superiority in clinical settings.
Experimental Approaches for Validating Intrinsic Resistance Gene Function
Understanding the mechanisms of intrinsic resistance requires robust experimental methodologies for characterizing resistance gene function. The following protocols provide frameworks for systematic analysis of resistance determinants.
Genome-Wide Resistance Determinant Screening
This approach identifies chromosomal elements contributing to intrinsic resistance through systematic genetic manipulation.
Protocol:
- Create comprehensive mutant libraries using transposon insertion or systematic gene deletion techniques to generate a collection of strains with individual gene inactivations [80].
- Screen libraries against antimicrobial panels using standardized susceptibility testing (e.g., broth microdilution, agar dilution) to identify mutants with altered susceptibility profiles.
- Quantify susceptibility changes by determining minimum inhibitory concentration (MIC) shifts compared to wild-type strains.
- Categorize resistance determinants based on phenotypic outcomes: genes whose inactivation increases susceptibility represent the "bona fide intrinsic resistome," while those whose inactivation increases resistance represent potential targets for resistance acquisition [80].
- Validate candidate genes through complementation assays or targeted mutagenesis to confirm phenotypic linkage.
Transcriptional Profiling for Resistance Driver Identification
This method identifies intrinsic resistance drivers by correlating basal gene expression patterns with drug sensitivity across diverse cell populations.
Protocol:
- Establish diverse cellular models comprising hundreds of genetically annotated cancer cell lines or bacterial strains with comprehensive genomic and transcriptomic data [35].
- Generate drug sensitivity profiles by measuring potency (e.g., IC50) across all models for each drug of interest.
- Correlate expression with sensitivity by calculating association between basal expression levels of all genes and drug sensitivity metrics across models [35].
- Filter for specificity by removing genes that serve as proxies for co-expressed genes (approximately 80% of significant gene-drug relationships may be eliminated in this step) [35].
- Apply selectivity filters to exclude genes with nonspecific effects (correlated with sensitivity to many drugs), which likely represent general cellular states rather than mechanistic resistance pathways [35].
- Functionally validate candidates through forced expression to confirm resistance conferral and pharmacological inhibition to demonstrate sensitization effects [35].
The experimental workflow for intrinsic resistance gene validation is illustrated below:
Research Reagent Solutions for Resistance Mechanism Studies
Table 2: Essential Research Tools for Intrinsic Resistance Investigation
| Reagent/Category | Specific Examples | Research Application | Key Function |
|---|---|---|---|
| Mutant Libraries | Transposon-insertion libraries, Systematic deletion collections | Genome-wide screening | Identification of genes whose inactivation alters antimicrobial susceptibility [80] |
| Expression Libraries | ORF libraries, Plasmid-based overexpression systems | Resistance gene discovery | Determination of genes that confer resistance when expressed or overexpressed [80] |
| Pharmacogenomic Datasets | Cancer Cell Line Encyclopedia (CCLE), Genomics of Drug Sensitivity | Correlation analysis | Linking basal gene expression to drug response patterns [35] |
| Synergy Quantification Platforms | Multi-dimensional Synergy of Combinations (MuSyC), MOOCS-DS | Combination therapy optimization | Decoupling synergy of potency and efficacy for optimal dosing [83] |
| Pathway Analysis Tools | KEGG pathway databases, miRNA-target networks | Systems biology mapping | Constructing risk pathway crosstalk networks for drug combination optimization [84] |
Emerging Concepts: From Predictability to Combination Therapy Optimization
Evolutionary Predictability in Resistance Emergence
Recent perspectives suggest that antimicrobial resistance evolution can be approached as a predictable system-level phenomenon. The evolutionary predictability of resistance can be quantitatively defined through probability distributions of outcomes across evolving microbial populations [85]. This predictability is influenced by factors including mutation rates, selection pressures, and epistatic interactions between genetic elements. Research indicates that while specific evolutionary trajectories may be difficult to forecast, the statistical ensemble of potential resistance outcomes may be predictable, particularly over shorter timescales [85]. This concept has practical implications for cycling strategies, as predictable resistance patterns would be more amenable to scheduled antibiotic rotation approaches.
Computational Framework for Combination Therapy Optimization
For complex diseases like cancer, computational approaches are emerging to optimize drug combinations that overcome intrinsic resistance mechanisms. One network biology approach integrates pan-cancer and drug data to construct miRNA-mediated crosstalk networks among cancer pathways, then identifies drug combinations that maximally disrupt these resistance-associated networks [84]. This method has identified 687 optimized drug combinations from 83 first-line anticancer drugs across 18 cancer types, demonstrating the power of systems-level approaches to combination therapy design [84].
The MOOCS-DS (Multi-Objective Optimization of Combination Synergy - Dose Selection) method provides another advanced framework for optimizing combination therapies by decoupling synergy of potency (SoP) and synergy of efficacy (SoE) [83]. This approach identifies Pareto-optimal solutions in multi-objective synergy space, allowing researchers to select combination doses that balance multiple therapeutic objectives rather than relying on oversimplified synergy metrics [83].
The comparative analysis of cycling and mixing strategies reveals that structured antibiotic stewardship approaches generally outperform unregulated antibiotic use, but evidence for clear superiority of either structured approach remains limited [82]. This suggests that institutional context, local resistance patterns, and practical implementation factors may be more important than the specific choice between cycling and mixing.
The integration of intrinsic resistance mechanism research with combination therapy optimization represents a promising frontier for overcoming treatment-emergent resistance. By identifying core elements of the intrinsic resistome and developing therapeutic strategies that specifically target these vulnerabilities, researchers can design more durable treatment approaches that anticipate and circumvent resistance evolution pathways. As precision medicine advances in both infectious disease and oncology, the systematic understanding of intrinsic resistance networks will increasingly inform optimal drug combination and cycling strategies tailored to specific pathogen or cancer phenotypes.
The development of advanced therapeutic modalities, including gene therapies, cell therapies, and bispecific antibodies, has revolutionized treatment for numerous serious conditions. However, these innovations bring unique safety challenges, with host toxicity emerging as a critical barrier to their widespread clinical application. Understanding and mitigating these adverse effects is paramount for designing safer therapeutic agents with improved risk-benefit profiles.
Host toxicity in advanced therapies manifests through various mechanisms, including immunogenic reactions, off-target effects, and organ-specific toxicities. In gene therapy, the primary workhorse—adeno-associated virus (AAV) vectors—requires administration at very high doses, particularly when delivered systemically, to ensure sufficient transduction of target cells and meaningful clinical benefit. Unfortunately, this high-dosage approach can cause severe hepatotoxicity as the liver attempts to clear the viral particles, and may trigger immunological over-reactions to the sudden high viral load [86]. Similarly, in the context of T-cell engagers (TCEs), a common and serious adverse effect is cytokine release syndrome (CRS), an systemic inflammatory response caused by potent T-cell activation [87]. These toxicity profiles underscore the need for innovative strategies that can maintain or enhance therapeutic efficacy while minimizing harm to patients.
Comparative Analysis of Toxicity Profiles Across Therapeutic Modalities
Table 1: Comparison of Toxicity Profiles and Mechanisms Across Advanced Therapies
| Therapeutic Modality | Primary Toxicity Concerns | Underlying Mechanisms | Common Risk Mitigation Strategies |
|---|---|---|---|
| AAV-Based Gene Therapy | Hepatotoxicity, immunogenic reactions, genotoxicity [86] [88] | High vector doses, pre-existing immunity, viral capsid reactivity, insertional mutagenesis [86] | Immunosuppression, optimized dosing, novel capsids, enhanced potency vectors [86] [88] |
| T-Cell Engagers (TCEs) | Cytokine release syndrome (CRS), immune effector cell-associated neurotoxicity syndrome (ICANS) [88] [87] | Robust T-cell activation, inflammatory cytokine release, off-target binding [87] | Step-up dosing, corticosteroids, tocilizumab (IL-6 blockade), affinity tuning [87] |
| Somatic-Cell Therapies | Immunological toxicity, tumour formation [88] | Uncontrolled cell proliferation, inappropriate differentiation, host immune recognition [88] | Improved cell sorting, suicide genes, host conditioning [88] |
| Tissue-Engineered Products | Biocompatibility issues, scaffold degradation complications, poor host integration [88] | Foreign body response, degradation product toxicity, mechanical mismatch [88] | Biocompatible materials, controlled degradation rates, surface modification [88] |
Table 2: Experimental Models for Toxicity Assessment
| Model Type | Key Applications in Toxicity Assessment | Advantages | Limitations |
|---|---|---|---|
| In Vitro Cell Cultures | Screening for cellular toxicity, immunogenicity, off-target effects [88] | High-throughput, cost-effective, mechanistic studies | Limited complexity, lacks systemic response |
| Animal Models | Assessment of organ-specific toxicity, immune responses, biodistribution [86] [88] | Whole-organism context, pharmacokinetic/pharmacodynamic data | Species-specific differences in immune system and physiology |
| Advanced Preclinical Models | Microphysiological systems (organs-on-chips), humanized mouse models [88] | More human-relevant data, improved predictive value | Technically challenging, higher cost, validation ongoing |
Technological Innovations for Reduced Toxicity
Vector and Construct Engineering
Substantial progress has been made in engineering viral vectors and therapeutic constructs with improved safety profiles. For AAV-based gene therapies, research has focused on developing novel capsids with enhanced tissue targeting capabilities and reduced immunogenicity [86]. Simultaneously, genetic design innovations aim to boost expression efficiency, thereby allowing for dose reduction while maintaining therapeutic efficacy [86].
One promising approach involves circular RNA (circRNA) technology. The circVec system triggers circularization of the RNA molecule transcribed by the AAV vector inside the host cell. This circular structure confers a 75-fold increased half-life compared to conventional linear mRNA, enabling higher intracellular steady-state concentration and increased protein expression. In animal models, circVec has demonstrated the ability to boost AAV gene expression by 40-fold in the heart and 15-fold in the eye compared to conventional mRNA-based AAVs. This enhanced efficiency enables substantial dose reduction, potentially leading to improved safety profiles for patients [86].
In the realm of T-cell engagers, engineering efforts have progressed from simple 1+1 bispecific formats to more sophisticated 2+1 configurations and trispecific designs. The 2+1 format, which comprises two binding domains for the tumour antigen and one for CD3, harnesses avidity effects to enhance selectivity for tumour cells overexpressing the target antigen while sparing normal cells with physiological expression levels. This "affinity tuning by avidity" approach allows the use of lower-affinity binding domains that collectively achieve strong binding only to cells with high antigen density, thus improving the therapeutic window [87].
AI and Machine Learning Approaches
Artificial intelligence (AI) and machine learning (ML) are playing an increasingly important role in designing safer therapeutics and predicting toxicity. AI-driven approaches can analyze complex datasets to identify favourable epitope interactions, reduce immunogenicity risks, and enhance overall design efficiency [87]. In pharmacovigilance, AI technologies are revolutionizing adverse event detection by processing both structured and unstructured data from diverse sources, including electronic health records, spontaneous reporting systems, and even social media [89].
For antibiotic resistance prediction, ML frameworks leveraging transcriptomic data can identify minimal, highly predictive gene sets that distinguish resistant from susceptible strains with accuracies of 96-99% [90]. This approach demonstrates how advanced computational methods can enhance our understanding of resistance mechanisms while maintaining clinical applicability through focused gene sets.
Experimental Approaches for Evaluating Therapeutic Safety
Biomarker Identification and Validation
The identification and validation of safety biomarkers is crucial for monitoring and predicting host toxicity in advanced therapies. Recent research has demonstrated the utility of transcriptomic data analysis, weighted gene co-expression network analysis (WGCNA), and machine learning in identifying key biomarkers associated with adverse effects.
In a study investigating mitochondrial and programmed cell death-related genes in obsessive-compulsive disorder, researchers employed a sophisticated biomarker identification pipeline. The process began with differentially expressed gene (DEG) analysis between patient and control samples, followed by intersection with mitochondrial-related genes (MRGs) and programmed cell death-related genes (PCD-RGs) to identify DE-MPCD-RGs. Weighted gene co-expression network analysis (WGCNA) was then applied to identify key modules correlated with the condition of interest. Candidate genes identified through this process were further refined using machine learning algorithms, including Support Vector Machine Recursive Feature Elimination (SVM-RFE) and univariate logistic regression, to identify potential biomarkers [91].
This comprehensive approach led to the identification of NDUFA1 and COX7C as reliable biomarkers, which were significantly downregulated across datasets and validated using reverse transcription-quantitative polymerase chain reaction (RT-qPCR) in patient samples. Gene Set Enrichment Analysis (GSEA) revealed that these biomarkers were significantly co-enriched in pathways such as "ribosome," "oxidative phosphorylation," and "Parkinson's disease" [91]. This methodology provides a robust framework for identifying toxicity biomarkers in advanced therapy development.
Protocol for Transcriptomic Signature Identification
For researchers investigating toxicity signatures, the following protocol provides a methodological framework for identifying minimal gene signatures predictive of adverse outcomes:
Sample Collection and RNA Extraction: Collect target tissues or cells from treated and control models. Isolate high-quality RNA using standardized extraction methods.
Transcriptomic Profiling: Conduct RNA sequencing using appropriate platforms (e.g., Illumina). Ensure sufficient sequencing depth and replicates for statistical power.
Differential Expression Analysis: Process raw sequencing data through a standardized bioinformatics pipeline including quality control, adapter trimming, alignment, and quantification. Perform differential expression analysis using tools such as DESeq2 or limma with thresholds of |log2 fold-change| ≥ 0.5 and p ≤ 0.05 [91].
Feature Selection Using Genetic Algorithms: Implement a hybrid genetic algorithm (GA) and automated machine learning (AutoML) pipeline to identify minimal, highly predictive gene subsets. Begin with a randomly initialized population of gene subsets (e.g., 40 genes) and iteratively refine them over multiple generations (e.g., 300 generations per run). In each generation, evaluate candidate subsets using classifiers such as support vector machines (SVM) and logistic regression, assessing performance through metrics like ROC-AUC and F1-score [90].
Validation and Functional Analysis: Validate identified gene signatures in independent datasets. Perform functional enrichment analysis (GO and KEGG) to identify biological pathways associated with the signature. Conduct immune cell infiltration analysis if relevant to the toxicity mechanism [91].
This protocol has demonstrated success in identifying compact gene sets (35-40 genes) capable of predicting antibiotic resistance with accuracies of 96-99% [90], and can be adapted for toxicity signature identification.
Table 3: Key Research Reagents and Databases for Toxicity Research
| Resource Category | Specific Tools/Databases | Primary Function | Application in Safety Research |
|---|---|---|---|
| Gene Expression Databases | GEO (Gene Expression Omnibus) [91] | Repository of functional genomics data | Access to toxicogenomic datasets for biomarker discovery |
| Mitochondrial Gene Databases | MitoCarta [91] | Inventory of mammalian mitochondrial proteins | Study mitochondrial-related toxicity mechanisms |
| Antibiotic Resistance Databases | CARD (Comprehensive Antibiotic Resistance Database) [4] [90] | Curated resource of antimicrobial resistance genes | Understand resistance mechanisms and collateral toxicity |
| Machine Learning Frameworks | AutoML, Genetic Algorithms [90] | Automated machine learning pipeline development | Identify minimal gene signatures predictive of toxicity |
| Pathway Analysis Tools | clusterProfiler [91] | GO and KEGG enrichment analysis | Understand biological pathways affected by toxic insults |
| Protein Interaction Databases | STRING database [91] | Protein-protein interaction networks | Elucidate mechanisms of toxicity at protein level |
| Adverse Event Databases | FAERS, VigiBase [89] | Spontaneous adverse event reporting systems | Monitor real-world safety signals for approved therapies |
The field of advanced therapeutics stands at a pivotal moment, where addressing host toxicity is no longer an afterthought but a fundamental consideration in therapeutic design. The integration of innovative vector technologies, intelligent construct design, and sophisticated computational approaches provides a multi-faceted strategy for mitigating safety concerns while maintaining therapeutic efficacy.
Future directions in safer therapeutic design will likely focus on several key areas: First, the development of conditional activation strategies that restrict therapeutic activity to specific tissues or disease contexts. Second, the refinement of personalized approaches that account for individual patient factors influencing toxicity risk. Third, the implementation of advanced preclinical models that better predict human-specific toxicities before clinical advancement. Finally, the continued integration of AI and machine learning across the therapeutic development lifecycle, from initial design to post-marketing surveillance, will enable a more proactive approach to safety optimization.
As these innovations mature, they promise to deliver a new generation of advanced therapies with substantially improved safety profiles, expanding treatment options for patients with serious diseases while minimizing the burden of treatment-related toxicity. The ongoing validation of intrinsic resistance gene function and its application to therapeutic design will play a crucial role in this evolution, ultimately enabling more targeted, effective, and safer therapeutic interventions.
Benchmarking Function and Assessing Clinical Translation Potential
The global health threat of antimicrobial resistance (AMR) necessitates precise methods to understand how genetic mechanisms translate into observable resistance. Phenotypic validation serves as the critical bridge between identifying resistance genes in bacterial genomes and confirming their functional impact on antimicrobial efficacy. While genotypic resistance refers to the presence of genes or mutations conferring resistance potential, phenotypic resistance demonstrates the actual, observable ability of bacteria to grow in the presence of antimicrobials [92]. This correlation is not always direct, as factors like gene expression levels, synergistic genetic interactions, and environmental conditions can influence whether a genetic potential manifests as a resistant phenotype [93]. For researchers validating intrinsic resistance gene function, establishing this genotype-phenotype link through rigorous experimental workflows remains fundamental to understanding resistance mechanisms, developing accurate diagnostics, and guiding therapeutic decisions.
The cornerstone of phenotypic validation is Antimicrobial Susceptibility Testing (AST), which provides measurable data on bacterial response to antibiotics. Conventional AST methods, while reliable, require significant time—often 24-48 hours after pure isolate acquisition—creating critical delays in both clinical decision-making and research validation pipelines [94]. Next-generation rapid phenotypic AST technologies are addressing this limitation, with over 90 platforms identified in development, offering results within 8 hours and some investigational methods achieving AST within 1 hour directly from blood samples without pre-incubation [95] [96]. This guide systematically compares conventional and emerging AST methodologies, providing experimental protocols and performance data to inform research on validating resistance gene function.
Fundamental Concepts: Genotypic and Phenotypic Resistance Mechanisms
Genetic Basis of Antimicrobial Resistance
Antimicrobial resistance arises through two primary genetic mechanisms: chromosomal mutations and acquisition of mobile genetic elements. Chromosomal mutations occur spontaneously at frequencies of 10⁻⁶ to 10⁻¹⁰ per cell generation and may confer resistance through: (1) alteration of antibiotic target sites (e.g., mutations in gyrase genes leading to fluoroquinolone resistance), (2) reduced drug permeability or active efflux, (3) antibiotic inactivation, or (4) bypass of inhibited metabolic pathways [97] [98]. In contrast, acquired resistance typically occurs via plasmid-mediated transfer of resistance genes, which can confer resistance to clinically achievable antibiotic levels in a single step and disseminate rapidly among bacterial populations through conjugation, transduction, or transformation [97]. These acquired genes often encode enzymes that inactivate antibiotics (e.g., β-lactamases), produce modified drug targets, or implement efflux systems that reduce intracellular antibiotic concentrations [98].
Phenotypic Expression of Resistance Mechanisms
The phenotypic expression of resistance genes depends on multiple factors beyond mere genetic presence. Drug indifference describes situations where non-dividing or stationary-phase cells exhibit reduced susceptibility to antibiotics despite genetic susceptibility [93]. Biofilm-associated resistance creates physical and metabolic barriers to antibiotic penetration, with bacteria in hypoxic biofilm regions showing different resistance patterns than their aerobic counterparts [93]. Additionally, bacterial metabolism significantly influences phenotypic resistance, as global metabolic regulators can modulate antibiotic susceptibility through changes in bacterial permeability, efflux pump expression, and target accessibility [93]. Understanding these phenotypic modulators is essential for designing validation experiments that accurately reflect resistance behavior in infection contexts, where bacteria may encounter nutrient limitation, hypoxia, and other stressors differing from standard laboratory conditions.
Table 1: Key Resistance Mechanisms and Their Detection Methods
| Resistance Mechanism | Genetic Basis | Phenotypic Detection Method | Validation Challenges |
|---|---|---|---|
| Antibiotic Inactivation | Acquisition of β-lactamase genes (e.g., blaCTX-M, blaCMY) | MIC elevation; synergy tests with inhibitors (e.g., clavulanic acid) | Inducible expression; enzyme stability |
| Target Site Modification | Mutations in gyrase/topoisomerase genes; acquisition of rRNA methylase genes (e.g., ermB) | Elevated MICs to drug class; specific resistance patterns | Heteroresistance; variable expression levels |
| Efflux Pump Overexpression | Mutations in regulatory genes; acquisition of efflux pump genes (e.g., tetA) | Reduced MIC with efflux pump inhibitors; characteristic MDR profile | Substrate specificity; regulation by environmental factors |
| Membrane Permeability Reduction | Porin mutations/loss; LPS modifications | MIC changes to multiple drug classes; growth rate effects | Difficult to distinguish from other mechanisms |
| Biofilm Formation | Regulation of adhesion and matrix production genes | Increased tolerance vs. planktonic cells; minimal biofilm eradication concentration | Standardization of biofilm AST methods |
Established AST Methodologies for Phenotypic Validation
Conventional Phenotypic AST Methods
Conventional AST methods remain the gold standard for phenotypic validation due to their standardization, reproducibility, and extensive validation history. The broth microdilution method involves preparing two-fold serial dilutions of antibiotics in liquid growth medium, inoculating with standardized bacterial suspensions (typically 5 × 10⁵ CFU/mL), and incubating for 16-20 hours at 35°C ± 2°C [94]. The Minimum Inhibitory Concentration (MIC) represents the lowest antibiotic concentration that completely inhibits visible growth. For agar dilution, antibiotics are incorporated into solid media at serial two-fold concentrations, spotted with standardized inoculum, and incubated similarly [94]. The Kirby-Bauer disk diffusion method employs antibiotic-impregnated disks on Mueller-Hinton agar plates seeded with standardized bacterial suspensions; after incubation, zone diameters of inhibition are measured and interpreted according to Clinical and Laboratory Standards Institute (CLSI) or European Committee on Antimicrobial Susceptibility Testing (EUCAST) guidelines [94]. Each method requires strict quality control using reference strains like E. coli ATCC 25922, S. aureus ATCC 29213, and P. aeruginosa ATCC 27853 to ensure accurate results.
Experimental Protocol: Broth Microdilution for MIC Determination
Materials Required:
- Cation-adjusted Mueller-Hinton broth (CAMHB)
- Sterile 96-well microtiter plates with lids
- Antibiotic stock solutions at appropriate concentrations
- Bacterial isolates grown on non-selective media
- Sterile saline (0.85% NaCl)
- McFarland standards (0.5) or photometric standardization device
- Incubator at 35°C ± 2°C
Procedure:
- Prepare antibiotic working solutions from certified reference powders of known potency.
- Dispense CAMHB into microtiter plate wells, then create two-fold antibiotic dilutions directly in the plates using serial dilution technique.
- Adjust bacterial inoculum to 0.5 McFarland standard (approximately 1-2 × 10⁸ CFU/mL) in sterile saline, then further dilute in CAMHB to achieve final inoculum of 5 × 10⁵ CFU/mL.
- Add standardized inoculum to all test wells, ensuring final volume of 100μL per well.
- Include growth control (inoculum without antibiotic), sterility control (medium only), and quality control strains.
- Cover plates and incubate at 35°C ± 2°C for 16-20 hours without CO₂.
- Read MIC endpoints as the lowest concentration completely inhibiting visible growth.
- Interpret results according to current CLSI or EUCAST breakpoints [94] [99].
Technical Considerations: For fastidious organisms, supplement media with blood or specific growth factors. For inducible resistance phenotypes, consider extended incubation or indicator antibiotics. Always include appropriate quality control strains with known MIC ranges.
Next-Generation Rapid Phenotypic AST Platforms
Comparative Analysis of Commercial Rapid AST Systems
The limitations of conventional AST have spurred development of rapid phenotypic technologies that accelerate genotype-phenotype correlation studies. These systems employ diverse detection methods including microfluidics, single-cell imaging, mass spectrometry, and flow cytometry to reduce time-to-result from 24 hours to 2-7 hours [95] [94]. The table below compares performance characteristics of FDA-cleared and CE-marked rapid AST platforms relevant for research applications.
Table 2: Commercial Rapid Phenotypic AST Platforms for Research Applications
| Platform (Manufacturer) | Technology Principle | Time to Result | Organism Coverage | Performance (Categorical Agreement) | Sample Input |
|---|---|---|---|---|---|
| PhenoTest BC (Accelerate Diagnostics) | Morphokinetic cellular analysis, FISH | ID: 2h, AST: 7h | Gram-positive & Gram-negative | 92-99% [94] | Positive blood cultures |
| LifeScale (Affinity Biosensors) | Microfluidic sensor, resonant frequency measurement | 5h | Gram-negative | >93.1% [94] | Positive blood cultures |
| ASTar (Q-linea) | Time-lapse imaging of bacterial growth | 6h | Gram-negative | 95-97% [94] | Positive blood cultures |
| VITEK REVEAL (bioMérieux) | Colorimetric sensors for volatile organic compounds | 5h | Gram-negative | >96.3% [94] | Positive blood cultures |
| Selux NGP (SeluxDX) | Fluorescent growth indicator (viability assay) | 6-7h | Gram-positive & Gram-negative | >95% [94] | Isolates & positive blood cultures |
| QuickMIC (Gradientech) | Microscopic analysis in microfluidic device | 2-4h | Gram-negative | 78-100% (varies by drug) [94] | Positive blood cultures |
| FASTinov | Flow cytometry with fluorescent dyes | 2h | Gram-positive & Gram-negative | >96% [94] | Positive blood cultures |
Experimental Protocol: Single-Cell Imaging AST (ASTar System)
Principle: The ASTar platform employs high-speed time-lapse microscopy to monitor individual bacterial cell growth under antibiotic pressure in nano-scale channels, enabling rapid MIC determination through precise quantification of bacterial replication kinetics [96] [94].
Materials Required:
- ASTar instrument with microscopy capabilities
- Specialty ASTar culture cards pre-loaded with antibiotics
- Positive blood culture bottles or standardized bacterial suspensions
- Sample preparation reagents
- Quality control strains
Procedure:
- Prepare bacterial inoculum from positive blood culture using proprietary separation system or standardize isolate to 0.5 McFarland.
- Load sample into ASTar culture card containing pre-formulated antibiotic gradients.
- Insert card into instrument and initiate time-lapse imaging program.
- System automatically captures images of bacterial cells in microchannels at predetermined intervals.
- Proprietary algorithms analyze growth kinetics by tracking cell division events under different antibiotic conditions.
- Determine MIC based on lowest antibiotic concentration that inhibits cell division over 4-6 hour monitoring period.
- System software provides MIC values and categorical interpretations (S/I/R) based on current breakpoints.
Technical Considerations: This method demonstrates excellent essential agreement (90-98%) with reference methods but may show lower performance for specific drug combinations like amoxicillin/clavulanic acid and piperacillin/tazobactam [94]. The method is particularly valuable for detecting heteroresistance and studying early bacterial response to antimicrobial pressure.
Integrating Genotypic and Phenotypic Data for Comprehensive Validation
Workflow for Correlating Genetic and Phenotypic Findings
The complete phenotypic validation workflow integrates genotypic detection methods with phenotypic confirmation to establish functional correlations. This systematic approach ensures that genetic predictions of resistance are confirmed through observable phenotypic expression.
Machine Learning Approaches for Resistance Prediction
Advanced computational methods are enhancing genotype-phenotype correlation studies. Machine learning algorithms applied to comprehensive surveillance datasets (e.g., Pfizer ATLAS containing 917,049 bacterial isolates) can predict resistance phenotypes from genotypic markers with high accuracy (AUC values of 0.95-0.96) [55]. The XGBoost algorithm has demonstrated particular efficacy in these predictions, with the specific antibiotic agent emerging as the most influential feature in resistance outcome predictions [55]. These models facilitate rapid resistance prediction when complete phenotypic validation is impractical, though they require careful handling of missing genotypic data and geographic representation biases in training datasets. SHAP (SHapley Additive exPlanations) analysis provides model interpretability by quantifying the contribution of individual genetic features to resistance predictions, offering insights into potential genetic mechanisms worthy of experimental validation [55].
Essential Research Reagents and Materials
Successful phenotypic validation requires carefully selected reagents and reference materials. The following table outlines essential components for establishing AST workflows in research settings.
Table 3: Essential Research Reagents for Phenotypic Validation Studies
| Reagent Category | Specific Examples | Research Application | Quality Considerations |
|---|---|---|---|
| Culture Media | Mueller-Hinton Broth/Agar (cation-adjusted); Blood Agar; CHROMagar | Standardized growth conditions for AST | pH verification (7.2-7.4); cation content; batch consistency |
| Reference Antibiotics | USP-grade reference powders; CLSI-approved sources | Preparation of exact drug concentrations for MIC testing | Potency certification; purity >90%; proper storage conditions |
| Quality Control Strains | E. coli ATCC 25922; S. aureus ATCC 29213; P. aeruginosa ATCC 27853 | Method validation and quality assurance | Authenticated sources; proper cryopreservation; passage control |
| Sample Preparation Tools | McFarland standards; automated inoculum preparation systems | Standardization of bacterial inoculum | Regular verification of turbidity standards; calibration |
| Detection Reagents | Fluorescent viability dyes; enzyme substrates; VOC sensors | Rapid growth detection in novel AST systems | Lot-to-lot consistency; stability testing; interference assessment |
| Molecular Validation Kits | β-lactamase detection assays; PCR reagents for resistance genes | Genotypic-phenotypic correlation studies | Sensitivity/specificity verification; contamination prevention |
Phenotypic validation remains an indispensable component of antimicrobial resistance research, providing the critical functional link between genetic determinants and clinically relevant resistance outcomes. While conventional AST methods offer standardized approaches for MIC determination, emerging technologies now enable rapid phenotypic profiling within 2-8 hours, dramatically accelerating validation workflows [95] [94]. The integration of machine learning approaches with comprehensive surveillance datasets further enhances our ability to predict resistance phenotypes from genetic signatures, though these computational methods still require phenotypic confirmation for definitive validation [55]. As research continues to unravel the complex relationships between bacterial metabolism, gene expression, and phenotypic resistance [93], robust validation frameworks that systematically correlate genetic findings with AST results will remain fundamental to understanding resistance mechanisms, developing novel therapeutic approaches, and informing clinical practice in the face of the escalating AMR crisis.
Comparative genomic analyses have become indispensable for understanding the differential risk posed by bacterial species within the same genus, particularly regarding their antimicrobial resistance (AMR) burden. The distinction between Enterococcus faecium and Enterococcus lactis provides a compelling case study for such comparisons. Historically, many E. faecium isolates were misclassified, but recent taxonomic reclassification now allows for clearer distinction using advanced genomic tools like whole-genome sequencing (WGS) and average nucleotide identity (ANI) analysis [100]. This scientific comparison guide objectively analyzes the differential AMR gene burden between these two species, providing researchers with critical data on their relative risks and genomic characteristics. Understanding these differences is fundamental for developing targeted surveillance and control strategies in both clinical and food production environments.
Comparative Resistance Profiles: Phenotypic and Genotypic Analysis
Phenotypic Resistance Patterns
Antimicrobial susceptibility testing (AST) reveals significant differences in phenotypic resistance between E. faecium and E. lactis. A comprehensive analysis of isolates from the food chain across China demonstrated that E. faecium exhibits substantially higher resistance rates to a broad spectrum of antimicrobials compared to E. lactis [100].
Table 1: Comparative Phenotypic Resistance Profiles of E. faecium vs. E. lactis
| Antibiotic Class | Specific Antibiotic | E. faecium Resistance Rate | E. lactis Resistance Rate | P-value |
|---|---|---|---|---|
| β-lactams | Ampicillin (AMP) | Significantly higher | Significantly lower | <0.05 |
| β-lactams | Penicillin (PEN) | Significantly higher | Significantly lower | <0.05 |
| Macrolides | Erythromycin (ERY) | Lower | Higher | <0.01 |
| Quinolones | Enrofloxacin (ENR) | Significantly higher | Significantly lower | <0.05 |
| Quinolones | Ciprofloxacin (CIP) | Significantly higher | Significantly lower | <0.05 |
| Tetracyclines | Doxycycline (DOX) | Significantly higher | Significantly lower | <0.05 |
| Tetracyclines | Tetracycline (TET) | Significantly higher | Significantly lower | <0.05 |
| Glycopeptides | Vancomycin (VAN) | Significantly higher | Significantly lower | <0.05 |
| Phenicols | Chloramphenicol (CHL) | Significantly higher | Significantly lower | <0.05 |
| Multidrug Resistance | MDR (overall) | 49.4% (43/87 isolates) | 10.5% (16/153 isolates) | <0.001 |
The markedly higher multidrug-resistant (MDR) rate in E. faecium (49.4%) compared to E. lactis (10.5%) underscores the substantially greater public health risk posed by E. faecium within the food chain [100]. This pattern is consistent with global trends in clinical settings, where studies of clinical E. faecium isolates have found substantial heterogeneity in resistance proportions, ranging from 2% for linezolid to 62.8% for erythromycin, with significant variations across geographical regions and time periods [101].
Genomic Determinants of Resistance
Comparative genomic analysis elucidates the genetic foundations underlying the observed phenotypic differences. E. faecium possesses a significantly expanded arsenal of antibiotic resistance genes (ARGs) compared to E. lactis [100].
Table 2: Comparative Genomic Features Related to AMR Burden
| Genomic Feature | E. faecium Characteristics | E. lactis Characteristics |
|---|---|---|
| Antibiotic Resistance Genes (ARGs) | Significantly more abundant | Fewer ARGs |
| Mobile Genetic Elements (MGEs) | Enriched | Less prevalent |
| Plasmid Replicons | Higher diversity and abundance | Fewer plasmid types |
| Vancomycin Resistance Genes | vanA, vanB common in clinical isolates | Less common |
| Aminoglycoside Resistance | aac(6′)-Ie-aph(2″)-Ia, aph(3′)-IIIa common | Less common |
| Macrolide Resistance | ermB prevalent | ermB less prevalent |
| Genetic Context | ARGs often associated with MGEs | Fewer ARG-MGE associations |
The enrichment of mobile genetic elements (MGEs) and plasmid replicons in E. faecium genomes facilitates greater horizontal gene transfer, enabling the acquisition and dissemination of ARGs across bacterial populations [100] [102]. This genetic mobility is a key factor in the emergence of successful hospital-adapted vancomycin-resistant E. faecium (VREfm) clones, which are listed by the WHO as high-priority pathogens [102].
In contrast, the genomic analysis of E. lactis strains often reveals a more limited ARG repertoire. For instance, the safety evaluation of E. lactis RB10 isolated from goat feces identified only two intrinsic antimicrobial resistance genes: aac(6′)-Ii (aminoglycoside resistance) and msr(C) (macrolide resistance), with no significant associations with transferable virulence factors [103].
Experimental Methodologies for Comparative Genomic Analysis
Sample Collection and Bacterial Identification
Robust species identification is fundamental to accurate comparative analyses. The following protocol outlines standard methodology for distinguishing between E. faecium and E. lactis:
Sample Collection: Collect samples from relevant sources (clinical, food chain, environmental). In a recent food chain study, 2,233 samples were collected from multiple nodes across 5 Chinese provincial-level administrative divisions [100].
Isolate Purification: Plate samples on selective media such as Slanetz-Bartley agar or bile-esculin azide agar. Incubate at 35-37°C for 24-48 hours. Select typical Enterococcus colonies for purification [104].
DNA Extraction: Use commercial kits such as the QIAamp Power Fecal Pro DNA kit (Qiagen) for metagenomic studies or the Maxwell 16 Cell DNA Purification Kit (Promega) for pure cultures [105] [102].
Species Identification:
- Perform whole-genome sequencing (WGS) using Illumina short-read technology (pair-end, 2 × 150 bp) or Oxford Nanopore Technologies (ONT) for long-read sequencing [104] [103].
- Conduct average nucleotide identity (ANI) analysis against reference genomes for accurate species demarcation [100].
- Utilize the Genome Taxonomy Database Toolkit (GTDB-Tk) and Type (Strain) Genome Server (TYGS) for phylogenetic placement [104].
Antimicrobial Susceptibility Testing
Phenotypic resistance profiles are determined using standardized antimicrobial susceptibility testing:
Testing Method Selection: Employ either broth microdilution methods following CLSI/EUCAST guidelines or use automated systems such as the Phoenix Automated Microbiology System (BD) [102].
Antibiotic Panel Testing: Test against a comprehensive panel of antibiotics including ampicillin, penicillin, erythromycin, enrofloxacin, ciprofloxacin, tetracycline, vancomycin, teicoplanin, linezolid, and high-level aminoglycosides (gentamicin and streptomycin) [100] [102].
Interpretation: Determine minimum inhibitory concentration (MIC) values and interpret according to established breakpoints (e.g., EUCAST guidelines) [102].
Quality Control: Include reference strains for quality assurance in each batch of testing.
Genomic Analysis of Resistance Determinants
Comprehensive genomic characterization identifies the genetic basis of observed resistance patterns:
Genome Assembly and Annotation:
Resistance Gene Detection:
Mobile Genetic Element Analysis:
Virulence Factor Screening:
Phylogenetic Analysis:
Comparative Genomic Analysis Workflow for AMR Studies
Molecular Mechanisms Underlying Differential Resistance
Genomic Adaptations in E. faecium
The heightened resistance burden in E. faecium stems from several genomic adaptations that facilitate horizontal gene transfer (HGT) and resistance gene accumulation:
Restriction-Modification Systems: E. faecium possesses diverse type I restriction-modification systems with varying HsdS specificity subunits that may influence DNA uptake and recombination frequencies [108]. However, functional methylome analysis reveals that most clinical E. faecium strains lack active adenine methylation despite having intact RM systems, suggesting complex regulation of foreign DNA acquisition [108].
Mobile Genetic Element Proliferation: Hospital-adapted E. faecium clones exhibit increased plasmid content compared to commensal strains, with this "plasmidome" enhancing their fitness in healthcare environments [108]. These MGEs serve as vectors for transmitting crucial resistance determinants such as vanA (vancomycin resistance), aac(6')-Ie-aph(2'')-Ia (aminoglycoside resistance), and ermB (macrolide resistance) [102].
Chromosomal Mutations: Key mutations in housekeeping genes contribute to resistance, particularly mutations in the pbp5 gene that confer ampicillin resistance, which is present in 89.7% of Italian VREfm isolates [102].
Anti-Restriction Mechanisms
The ability to acquire foreign DNA is further modulated by anti-restriction systems that facilitate horizontal gene transfer:
DNA Restriction-Modification and Anti-Restriction Systems
Some E. faecium strains encode anti-restriction proteins such as ArdA, which specifically inhibit type I restriction-modification system function. When heterologously expressed, E. faecium ArdA variants can inhibit RM system function in other Gram-positive bacteria like Staphylococcus aureus [108]. However, deletion studies indicate that additional unidentified factors beyond ArdA likely control foreign DNA acquisition in E. faecium, highlighting the complexity of DNA defense mechanisms in this species [108].
Essential Research Reagents and Tools
Table 3: Essential Research Reagents for Comparative Genomic Analyses of AMR
| Category | Specific Tool/Reagent | Application/Function |
|---|---|---|
| Sequencing Platforms | Illumina NovaSeq | Short-read WGS for high-quality assemblies |
| Oxford Nanopore Technologies (ONT) | Long-read sequencing for resolving repeats and MGEs | |
| Bioinformatics Tools | SPAdes, Unicycler | Genome assembly |
| PROKKA, RAST | Genome annotation | |
| ABRicate, AMRFinderPlus | Resistance gene identification | |
| Roary | Pan-genome analysis | |
| FastTree | Phylogenetic tree construction | |
| Reference Databases | CARD (Comprehensive Antibiotic Resistance Database) | Curated ARG reference |
| ResFinder | ARG detection and typing | |
| VFDB (Virulence Factor Database) | Virulence factor identification | |
| GTDB (Genome Taxonomy Database) | Standardized taxonomic classification | |
| Laboratory Reagents | Selective media (Slanetz-Bartley, bile-esculin) | Enterococcus isolation |
| DNA extraction kits (QIAamp Power Fecal Pro) | High-quality DNA purification | |
| AST panels (CLSI/EUCAST standards) | Phenotypic resistance testing |
Comparative genomic analyses unequivocally demonstrate that E. faecium carries a significantly greater burden of antimicrobial resistance genes compared to E. lactis, with markedly higher rates of multidrug resistance. This differential resistance profile is genetically encoded through a combination of enriched antibiotic resistance genes, greater abundance of mobile genetic elements, and diverse plasmid replicons in E. faecium.
These findings have profound implications for public health surveillance and intervention strategies. The substantial AMR risks posed by E. faecium, particularly within the food chain and healthcare settings, necessitate enhanced species-specific surveillance programs [100]. Future interventions should prioritize targeted control strategies tailored to each species to effectively mitigate One Health threats.
For researchers validating intrinsic resistance gene function, these comparative approaches provide a framework for assessing the relative risks of closely related bacterial species. The methodological pipelines outlined here enable comprehensive characterization of resistance mechanisms, from phenotypic resistance patterns to the genetic determinants and their genomic context. This integrated approach is essential for understanding and mitigating the ongoing threat of antimicrobial resistance across healthcare, agricultural, and community settings.
The silent pandemic of antimicrobial resistance (AMR) poses a monumental threat to global health, with antibiotic resistance genes (ARGs) serving as fundamental vectors for resistance propagation. Current environmental AMR surveillance often overlooks a critical determinant of risk: the mobility potential of ARGs mediated by mobile genetic elements (MGEs) [68]. This oversight substantially limits the accuracy of risk assessment frameworks, as ARGs located on MGEs can undergo horizontal gene transfer (HGT) to pathogenic hosts, dramatically increasing clinical relevance compared to chromosomally-encoded ARGs in non-pathogenic bacteria [68]. Assessing ARG risk based solely on abundance, without contextual genetic information, leads to overestimation of potential epidemiological threats and flawed prioritization of mitigation measures [68].
This guide provides a comparative analysis of methodologies and tools for integrating ARG-MGE associations into risk prediction frameworks. We objectively evaluate experimental approaches, computational pipelines, and analytical techniques that enable researchers to move beyond simple ARG quantification toward functionally relevant risk assessment validated through gene expression and transfer potential. The presented comparison focuses on performance metrics, technical capabilities, and practical implementation considerations within the broader context of validating intrinsic resistance gene function.
Methodological Comparison for ARG-MGE Association Analysis
Core Methodologies and Workflows
Table 1: Comparative Analysis of ARG-MGE Association Methodologies
| Methodology | Key Features | Detection Sensitivity | Mobility Context | Implementation Complexity | Primary Applications |
|---|---|---|---|---|---|
| Metagenomic Sequencing | Identifies ARGs and co-located MGEs via contig analysis | ~1 gene copy per 103 genomes [68] | High (direct sequence context) | High (requires bioinformatics expertise) | Comprehensive resistome profiling, ARG host identification [109] |
| qPCR Approaches | High-precision quantification of specific ARG-MGE combinations | ~1 gene copy per 105-107 genomes [68] | Limited (pre-defined targets only) | Low to Moderate | Targeted surveillance, time-series monitoring [68] |
| Metatranscriptomic Sequencing | Links ARG presence to expression activity | Varies with transcript abundance | High (when combined with metagenomics) | Very High | Functional activity assessment, expression efficiency quantification [110] |
| Exogenous Plasmid Capture | Experimental validation of conjugation potential | Dependent on transfer efficiency | Direct functional evidence | High (specialized laboratory setup) | Experimental validation of HGT potential [68] |
Experimental Protocols for ARG-MGE Analysis
Metagenomic Assembly-Based Mobility Assessment
Sample Preparation and Sequencing: Extract high-molecular-weight DNA from environmental samples (water, soil, wastewater) using standardized kits with mechanical lysis for comprehensive cell disruption. Quality control via fluorometric quantification and fragment analysis. Prepare sequencing libraries using Illumina-compatible protocols with 350-500bp insert sizes, followed by paired-end sequencing on Illumina platforms (2x150bp) to generate sufficient read length for subsequent assembly [109] [111].
Bioinformatic Processing: Quality trim raw reads using Trimmomatic or FastP with parameters: LEADING:20, TRAILING:20, SLIDINGWINDOW:4:20, MINLEN:50. Perform metagenomic assembly using MEGAHIT or metaSPAdes with k-mer range 21-121 (in increments of 10). Predict open reading frames (ORFs) on contigs >1kb using Prodigal with meta-mode. Annotate ARGs using DeepARG or ARGpore2 against comprehensive ARG databases (CARD, ARDB). Simultaneously, identify MGEs using MobileElementFinder, PlasmidFinder, and ICEberg for plasmids, transposons, and integrative conjugative elements, respectively [109].
ARG-MGE Association Determination: Establish genetic linkage when ARGs and MGEs are identified on the same contig with separation <10kb. Calculate co-localization frequency as: (number of ARG-containing contigs with MGEs / total ARG-containing contigs) × 100%. Determine potential mobility using a scoring system that considers MGE type, proximity, and genetic context [111].
Metatranscriptomic Expression Analysis
RNA Extraction and Sequencing: Preserve samples immediately in RNAlater or flash-freeze in liquid nitrogen. Extract total RNA using kits with DNase treatment, with additional mechanical lysis for difficult environmental matrices. Deplete ribosomal RNA using probe-based methods. Prepare cDNA libraries with unique dual indexing. Sequence on Illumina platforms with sufficient depth (minimum 20 million reads per sample) [110].
Expression Quantification: Map quality-controlled reads to ARG and MGE databases using Salmon or kallisto with sequence-based mapping. Calculate transcripts per million (TPM) for normalized cross-sample comparison. Determine expression ratios between MGE-associated and chromosomal ARGs. Statistical analysis (DESeq2 or edgeR) identifies differentially expressed ARG categories with FDR correction for multiple testing [110].
Quantitative Data Synthesis
Experimental Findings on ARG Mobility and Expression
Table 2: Quantitative Comparison of MGE-associated vs. Chromosomal ARGs
| Parameter | MGE-Associated ARGs | Chromosomal ARGs | Study Context |
|---|---|---|---|
| Average Expression Efficiency | 2.5× higher [110] | Baseline reference | Pig farm wastewater |
| Contribution to Total Transcript Pool | 62.07% [110] | 37.93% | Pig farm wastewater |
| Proportion in Environmental Samples | 34.87% of ARG-like ORFs [110] | 65.13% of ARG-like ORFs | Pig farm wastewater |
| Location on Plasmids | 50.4%-70.6% variation under stress [111] | 29.4%-49.6% variation | Constructed wetlands under antibiotics/heavy metals |
| Active Transcription Rate | 71.02% of ARGs actively transcribed [110] | Varies with host activity | Pig farm wastewater |
Impact of Co-selection Pressures on ARG Mobility
Table 3: Effect of Antibiotic and Heavy Metal Co-selection on ARG Mobility
| Experimental Condition | ARG Abundance | MGE Abundance | Plasmid-associated ARGs | Chromosomal ARGs |
|---|---|---|---|---|
| Control (no stress) | Baseline | Baseline | 35.2% | 64.8% |
| Low DC + Low Cd | 1.8× increase | 2.1× increase | 42.7% | 57.3% |
| High DC only | 3.2× increase | 2.8× increase | 28.5% | 71.5% |
| High Cd only | 2.9× increase | 3.3× increase | 31.2% | 68.8% |
| High DC + High Cd | 4.1× increase | 4.7× increase | 50.4% | 49.6% |
Note: DC = Doxycycline; Cd = Cadmium. Data compiled from constructed wetlands study [111].
Visualization of Methodological Frameworks
ARG-MGE Association Analysis Workflow
Workflow for ARG-MGE Analysis: This diagram outlines the comprehensive process for determining ARG-MGE associations, from sample collection to final risk assessment. The workflow emphasizes the critical pathway from genetic annotation to association analysis that enables mobility potential quantification [68] [109] [111].
ARG Mobility Risk Assessment Logic
Risk Assessment Logic: This visualization illustrates the logical framework for integrating multiple data types into a comprehensive ARG mobility risk prediction. The model incorporates genetic context, host association, and expression data to generate functionally validated risk assessments [68] [110].
The Scientist's Toolkit: Essential Research Reagents and Platforms
Table 4: Key Research Reagents and Computational Tools for ARG-MGE Studies
| Tool/Reagent | Type | Primary Function | Application Notes |
|---|---|---|---|
| ARGem Pipeline | Computational Pipeline | Full-service analysis from DNA reads to visualization | Integrates comprehensive ARG/MGE databases; enables statistical and network analysis [109] |
| DeepARG Database | Reference Database | ARG annotation and classification | Uses deep learning models for ARG identification; includes likelihood scores [109] |
| MobileElementFinder | Computational Tool | MGE identification and classification | Detects plasmids, transposons, insertion sequences; critical for mobility context [109] |
| CARD | Reference Database | Comprehensive antibiotic resistance database | Curated resource linking ARGs to antibiotics and mechanisms [68] |
| Prodigal | Computational Tool | ORF prediction from metagenomic contigs | Essential for gene boundary identification in assembled sequences [109] |
| Trimmomatic | Computational Tool | Read quality control and adapter removal | Pre-processing essential for accurate assembly [109] |
| MetaSPAdes | Computational Tool | Metagenome assembly | Generates contigs for ARG-MGE co-localization analysis [109] |
| RNAlater | Preservation Reagent | RNA stabilization for expression studies | Critical for accurate metatranscriptomic analysis [110] |
Integrating ARG-MGE association data into risk assessment frameworks represents a paradigm shift in how we evaluate the threat potential of environmental resistomes. The methodologies and data presented in this comparison guide demonstrate that mobility potential, rather than simple ARG abundance, provides significantly improved predictive accuracy for epidemiological risk. The experimental evidence clearly shows that MGE-associated ARGs exhibit higher expression efficiency and greater contribution to functional resistance pools than their chromosomal counterparts [110]. Furthermore, co-selection pressures from antibiotics and heavy metals significantly alter ARG localization patterns, preferentially enriching for MGE-associated variants under stressful conditions [111].
For researchers and drug development professionals, these findings underscore the necessity of moving beyond categorical ARG detection toward contextual genetic analysis. The tools and protocols outlined here provide a roadmap for implementing mobility-centric risk assessment that more accurately reflects the true threat landscape of antimicrobial resistance in environmental compartments. Future methodological developments should focus on standardizing mobility potential metrics and integrating them into quantitative microbial risk assessment (QMRA) frameworks to better inform intervention strategies and policy decisions aimed at curbing the global AMR crisis [68].
The escalating crisis of antimicrobial resistance (AMR) necessitates a deep understanding of the genetic and molecular mechanisms that empower bacteria to survive antibiotic treatments. Research into intrinsic resistance—the innate ability of a bacterial species to resist antibiotic classes due to its core genetic makeup—is fundamental to this understanding. However, the findings from such research are not universally applicable, as resistance mechanisms, their validation, and their clinical implications can vary significantly across different bacterial pathogens. This guide explores these critical differences by comparing the validation of intrinsic resistance in three clinically significant bacteria: Mycobacterium abscessus, Pseudomonas aeruginosa, and Escherichia coli. By contrasting their unique validation methodologies, resistance mechanisms, and the pathogen-specific context that shapes research outcomes, this article provides a framework for developing more effective, targeted therapeutic strategies.
Comparative Analysis of Resistance Mechanisms and Validation Approaches
The table below summarizes the key differences in the biology, resistance mechanisms, and primary research tools used for M. abscessus, P. aeruginosa, and E. coli.
Table 1: Pathogen Comparison Overview
| Feature | Mycobacterium abscessus | Pseudomonas aeruginosa | Escherichia coli |
|---|---|---|---|
| Classification | Rapidly growing non-tuberculous mycobacterium [112] | Gram-negative, obligate aerobic rod [113] | Gram-negative, facultative anaerobic rod [114] |
| Primary Intrinsic Resistance Mechanism | Functional erm(41) gene conferring inducible macrolide resistance [112] |
Efflux pumps (e.g., MexAB-OprM) & low outer membrane permeability [2] | Efflux pumps (e.g., AcrAB-TolC) and chromosomally encoded enzymes [2] |
| Key Validation Method | MALDI-TOF MS with Machine Learning for subspecies ID [112] | PCR validation of 16S rRNA following culture-based diagnosis [113] | Genome-wide knockout screens (e.g., Keio collection) [2] |
| Clinical Challenge | Subspecies-specific treatment outcomes; long AST turnaround [112] | High misdiagnosis rate with culture-based methods [113] | High prevalence of multidrug-resistant strains [2] |
Detailed Experimental Protocols for Validating Resistance
Validation of intrinsic resistance and its genetic determinants relies on distinct, pathogen-appropriate methodologies.
Protocol for M. abscessus: MALDI-TOF MS and Machine Learning for Subspecies Identification
Subspecies identification in M. abscessus is critical due to its direct correlation with macrolide resistance. A novel protocol combining MALDI-TOF MS and machine learning has been developed for rapid discrimination [112].
- Sample Preparation: Bacterial stocks are inactivated at 95°C for 30 minutes. Cells are washed repeatedly with distilled water and ethanol, followed by enhanced lysis using silica beads and acetonitrile. The supernatant is mixed with formic acid and centrifuged [112].
- Spectra Acquisition: The processed sample is spotted onto a steel plate with a matrix solution and analyzed using a Microflex LT MS. Spectra are collected in a mass-to-charge ratio (m/z) range of 2000 to 20,000 [112].
- Data Processing and Model Training: Informative peaks (e.g., m/z 6715, 4739) are identified from the complex spectral data using random forest importance. Machine learning models, including random forests and support vector machines, are trained on this data to classify subspecies (abscessus vs. massiliense) [112].
- Validation: The model's performance is rigorously validated using repeated five-fold cross-validation to prevent over-fitting. The random forest model has achieved an AUROC of 0.9166 [112].
Protocol for P. aeruginosa: Molecular Validation of Culture-Based Diagnosis
Given the high rate of misidentification with conventional methods, the following protocol is used to validate isolates presumed to be P. aeruginosa [113].
- Initial Culture and Phenotypic Testing: Isolates are cultured and subjected to morphological and biochemical tests, including growth on cetrimide agar, and testing for oxidase, catalase, and gelatinase production [113].
- DNA Extraction and PCR Amplification: Genomic DNA is extracted from the isolates. The 16S ribosomal RNA (rRNA) gene is amplified using polymerase chain reaction (PCR) with specific primers [113].
- Gel Electrophoresis and Confirmation: The PCR products are separated by gel electrophoresis. A distinct band at 1451 base pairs confirms the isolate as P. aeruginosa [113].
Protocol for E. coli: Genome-Wide Screens for Intrinsic Resistance Genes
Genetic screens in E. coli help identify genes that constitute its "intrinsic resistome" [2].
- Screen Setup: The Keio collection, a library of approximately 3,800 single-gene E. coli knockouts, is grown in liquid media with sub-inhibitory concentrations of antibiotics like trimethoprim or chloramphenicol, and in a control medium without antibiotics [2].
- Identification of Hypersensitive Mutants: Bacterial growth (optical density) is measured. Knockout strains that show significantly poor growth in the antibiotic-containing medium but not in the control medium are classified as hypersensitive [2].
- Hit Validation and Characterization: Hypersensitive hits, such as knockouts of the efflux pump gene
acrBor genes involved in lipopolysaccharide (LPS) synthesis likerfaGandlpxM, are validated on solid antibiotic media. Their ability to sensitize resistant strains to antibiotics is further investigated [2].
Data Presentation: Quantitative Findings from Key Studies
The following tables consolidate quantitative experimental data that highlights the distinct resistance profiles and research outcomes for each pathogen.
Table 2: Validation of P. aeruginosa Diagnosis in Clinical Isolates (n=50)
| Diagnosis Method | Number of Isolates Confirmed as P. aeruginosa | Confirmation Rate | Key Biochemical Traits of Confirmed Isolates |
|---|---|---|---|
| Culture-Based (Phenotypic) | 50 | 100% (Pre-validation) | All Gram-negative, motile, non-lactose fermenters [113] |
| PCR (16S rRNA) | 30 | 60% | 100% produced pigments (pyoverdin/pyocyanin); 93.3% produced gelatinase [113] |
Table 3: Machine Learning Model Performance in Discriminating M. abscessus Subspecies
| Machine Learning Algorithm | AUROC (Area Under the Receiver Operating Characteristic Curve) | 95% Confidence Interval |
|---|---|---|
| Random Forest (RF) | 0.9166 | 0.9072 - 0.9196 [112] |
| Other Algorithms (SVM, LR, etc.) | Lower than RF | Reported as outperformed by RF [112] |
Table 4: E. coli Gene Knockouts Conferring Hypersensitivity to Antibiotics
| Gene Knocked Out | Gene Function | Phenotype: Hypersensitivity to |
|---|---|---|
acrB |
Component of AcrAB-TolC multidrug efflux pump [2] | Trimethoprim, Chloramphenicol, Multiple other antimicrobials [2] |
rfaG |
Lipopolysaccharide (LPS) glucosyl transferase I (cell envelope biogenesis) [2] | Trimethoprim, Chloramphenicol [2] |
lpxM |
Lipid A myristoyl transferase (cell envelope biogenesis) [2] | Trimethoprim, Chloramphenicol [2] |
nudB |
Dihydroneopterin triphosphate diphosphatase (folate metabolism) [2] | Trimethoprim (Drug-specific) [2] |
Visualizing Workflows and Pathways
The diagrams below illustrate the core experimental workflow for validating intrinsic resistance and a specific application for M. abscessus.
General Workflow for Validating Intrinsic Resistance
MALDI-TOF MS with ML for M. abscessus Subspecies ID
Successful research in this field depends on specific, high-quality reagents and tools.
Table 5: Key Research Reagent Solutions for Intrinsic Resistance Studies
| Reagent / Tool | Function / Application | Pathogen-Specific Example |
|---|---|---|
| MALDI-TOF MS Instrumentation | Rapid, accurate identification of bacterial species and subspecies based on protein mass fingerprints. | Discriminating M. abscessus subsp. abscessus from massiliense to predict macrolide resistance [112]. |
| Curated Mutant Libraries | Genome-wide collections of single-gene knockouts for high-throughput genetic screens. | Keio collection for E. coli to identify hypersensitive mutants and intrinsic resistance genes [2]. |
| Bioinformatics Tools (AMRFinder) | In silico identification of antimicrobial resistance genes from whole-genome sequence data. | Validating AMR gene content in E. coli and other pathogens; correlates genotype with phenotype [3]. |
| Selective Culture Media | Media formulations that promote the growth of target pathogens while inhibiting others. | Cetrimide agar for the selective isolation and presumptive identification of P. aeruginosa [113]. |
| Standardized AST Protocols | Reference methods (e.g., broth microdilution) for determining minimum inhibitory concentrations (MICs). | Essential for phenotypically confirming resistance in all pathogens and validating genotypic findings [112] [113] [115]. |
Discussion: Implications for Research and Drug Development
The comparative data underscores that a one-size-fits-all approach is ineffective for combating antimicrobial resistance. The validation of intrinsic resistance is deeply rooted in pathogen-specific biology. For M. abscessus, the clinical need centers on rapidly differentiating subspecies to guide macrolide therapy, a challenge addressed by innovative MALDI-TOF and ML models [112]. In contrast, for P. aeruginosa, a primary issue is diagnostic accuracy in clinical settings, where reliance on culture-based methods leads to significant misidentification, potentially exacerbating AMR through inappropriate treatment [113]. Research on E. coli provides a powerful platform for discovering fundamental resistance mechanisms via well-established genetic tools, offering insights that can sometimes be extrapolated to other Gram-negative pathogens [2].
Furthermore, the ecological interactions between these pathogens, as illustrated by the evidence that antibiotic treatment for P. aeruginosa can eliminate competitive inhibition and promote M. abscessus survival in biofilms, highlight the complex clinical landscape [115]. This interplay necessitates a holistic view of polymicrobial infections and treatment consequences. The push for tools like AMRFinder, which standardizes and validates AMR gene annotation from genomic data, is a critical step toward improving the consistency and clinical utility of resistance research across all pathogens [3].
Validating the function of intrinsic resistance genes is a cornerstone of modern antimicrobial research. However, as this comparison of M. abscessus, P. aeruginosa, and E. coli elucidates, the pathways, methodologies, and clinical implications of this validation are profoundly pathogen-specific. Researchers and drug developers must therefore tailor their strategies, selecting the most appropriate models and tools—from machine learning and genomic screens to precise molecular diagnostics—to match the unique biological and clinical challenges posed by each target bacterium. Embracing this nuanced, pathogen-focused approach is essential for translating basic research on resistance mechanisms into effective therapeutic interventions that can curb the global AMR crisis.
Antimicrobial resistance (AMR) represents one of the most severe threats to global public health, with projections indicating it could cause up to 10 million deaths annually by 2050 [45] [40]. The escalating crisis of antibiotic-resistant pathogens, particularly the rise of multidrug-resistant and pan-resistant strains of priority pathogens like Pseudomonas aeruginosa, has underscored the critical limitations of conventional antibiotic susceptibility testing and resistance gene identification methods [116] [40]. Traditional culture-based methods require 48-72 hours to yield results, necessitating empirical treatment with broad-spectrum antibiotics that may prove ineffective and further drive resistance dynamics [40]. While molecular methods like PCR and next-generation sequencing offer faster alternatives, they often lack the predictive power for novel resistance mechanisms and exhibit limited scalability for comprehensive surveillance [116] [4].
The research community faces a critical bottleneck in translating the vast amounts of genomic and transcriptomic data into clinically actionable insights for combating high-risk resistance targets. This challenge is particularly acute for intrinsic resistance genes and cryptic resistance determinants that evade conventional detection methods but contribute significantly to treatment failure [4] [40]. Frameworks that systematically prioritize these resistance targets based on their clinical relevance, functional validation, and potential for therapeutic intervention are urgently needed to bridge the gap between fundamental research and clinical application. This review objectively compares contemporary computational frameworks for antibiotic resistance gene (ARG) prioritization, focusing on their underlying methodologies, performance metrics, and applicability for validating intrinsic resistance gene function.
Comparative Analysis of ARG Prioritization Frameworks
Performance Metrics Across Contemporary Tools
The landscape of ARG detection and prioritization has evolved significantly from basic alignment-based methods to sophisticated hybrid approaches integrating deep learning with traditional bioinformatics. The table below summarizes the quantitative performance metrics of leading tools, highlighting their respective strengths in different aspects of ARG prediction.
Table 1: Performance Comparison of ARG Prioritization Frameworks
| Tool | Underlying Methodology | Reported Accuracy | Key Strength | Limitations |
|---|---|---|---|---|
| ProtAlign-ARG [45] | Hybrid protein language model + alignment scoring | Remarkable accuracy (specific metrics not provided) | Superior recall; integrates protein embeddings with bit-score/e-value | Limited details on specific antibiotic class performance |
| Protein Language Model (ProtBert-BFD + ESM-1b) [54] | Ensemble of two protein language models with LSTM networks | Higher accuracy, precision, recall, and F1-score than existing methods | Significantly reduces false negatives and false positives | Computational intensity of multiple model integration |
| GA-AutoML Framework [40] | Genetic algorithm feature selection with automated machine learning | 96-99% (test set accuracy) | Identifies minimal (35-40) gene signatures; high interpretability | Platform-specific (P. aeruginosa); transcriptomic dependency |
| HMD-ARG [45] [54] [4] | Hierarchical multi-task classification with CNN | Not explicitly quantified in results | Comprehensive annotations from 7 databases; handles 33 ARG classes | Performance varies across less prevalent ARG classes |
| DeepARG [45] [54] [4] | Multilayer perceptron model | Not explicitly quantified in results | Effective for novel ARG prediction; dissimilarity matrix approach | Limited mechanistic interpretability |
Methodological Approaches and Experimental Protocols
Hybrid Protein Language Model Framework (ProtAlign-ARG)
ProtAlign-ARG represents a novel methodology that synergistically combines the pattern recognition capabilities of protein language models with the precision of alignment-based scoring systems [45]. The experimental workflow begins with translating DNA sequencing data into protein sequences, which are then processed through a pre-trained protein language model to generate raw embeddings that capture complex structural and functional patterns. These embeddings serve as input for a classification model that predicts ARG identity and associated antibiotic classes. In instances where the model exhibits low confidence in predictions, ProtAlign-ARG automatically defaults to an alignment-based scoring method that incorporates traditional bit scores and e-values from comparisons to curated ARG databases [45]. This hybrid approach demonstrates particular strength in identifying remote homologs and divergent ARG variants that conventional alignment-based tools often miss.
The framework employs a multi-task learning architecture that simultaneously addresses four distinct prediction tasks: (1) ARG identification, (2) ARG class classification, (3) ARG mobility identification, and (4) ARG resistance mechanism prediction [45]. For model training and validation, the developers utilized HMD-ARG-DB, one of the largest repositories integrating ARG annotations from seven established databases (AMRFinder, CARD, ResFinder, Resfams, DeepARG, MEGARes, and ARG-ANNOT), containing over 17,000 ARG sequences distributed across 33 antibiotic resistance classes [45]. To ensure rigorous evaluation and prevent data leakage, the dataset was partitioned using GraphPart, which guarantees precise separation between training and testing sets based on specified similarity thresholds, a significant improvement over traditional CDHIT partitioning that often allows >50% similarity between training and testing sequences [45].
Figure 1: ProtAlign-ARG Hybrid Workflow for Resistance Target Prioritization
Genetic Algorithm with Automated Machine Learning
The GA-AutoML framework takes a distinct approach to resistance target prioritization by focusing on transcriptomic profiles to identify minimal gene signatures predictive of antibiotic resistance [40]. The methodology begins with transcriptomic data collection from clinical bacterial isolates under antibiotic exposure, typically utilizing RNA sequencing to capture genome-wide expression patterns. A genetic algorithm then initiates with randomly generated 40-gene subsets and iteratively evolves these subsets over 300 generations per run, employing selection, crossover, and mutation operations to explore the feature space [40]. In each generation, candidate gene subsets are evaluated through support vector machines (SVM) and logistic regression (LR) classifiers, with performance assessed using ROC-AUC and F1-score metrics.
This process is repeated extensively (1,000 runs per antibiotic) to identify consistently high-performing gene combinations rather than converging on a single optimal solution [40]. The final step involves consensus gene set generation by ranking genes based on their selection frequency across all iterations, typically resulting in minimal signatures of 35-40 genes that preserve predictive accuracy while maximizing clinical feasibility. When validated on Pseudomonas aeruginosa clinical isolates, this approach achieved exceptional accuracy (96-99%) in predicting resistance to meropenem, ciprofloxacin, tobramycin, and ceftazidime while revealing that only 2-10% of the predictive genes overlapped with known resistance markers in the Comprehensive Antibiotic Resistance Database (CARD), highlighting its potential for discovering novel resistance determinants [40].
Ensemble Protein Language Model Architecture
A third methodological approach integrates two distinct protein language models (ProtBert-BFD and ESM-1b) to leverage their complementary strengths in capturing protein sequence and structural information [54]. The framework processes input protein sequences through both models simultaneously, with ProtBert-BFD generating embeddings that capture key sequential information and ESM-1b encoding features containing secondary and tertiary structural information [54]. To address class imbalance in ARG datasets, the method employs a novel cross-referencing data augmentation technique that exponentially increases limited resistance gene data by manipulating embedding representations.
The model architecture subsequently processes the dual embeddings through Long Short-Term Memory (LSTM) networks with multi-head attention mechanisms to capture temporal dependencies and identify critical features within the protein sequences [54]. The final prediction integrates results from both processing streams through ensemble learning strategies, generating a 16-dimensional output vector representing probabilities across different ARG classes, with the position containing the maximal value determining the final classification [54]. This approach demonstrates superior performance in reducing both false negative and false positive predictions compared to traditional nucleotide-based and earlier AI-based ARG identification methods, making it particularly valuable for distinguishing between closely related resistance and non-resistance genes [54].
Figure 2: Ensemble Protein Language Model Architecture for ARG Prediction
Research Reagent Solutions for Resistance Prioritization
Implementing the described prioritization frameworks requires specific computational reagents and reference databases. The table below catalogues essential resources mentioned across the evaluated studies, along with their primary functions in resistance target identification and validation.
Table 2: Essential Research Reagents and Databases for Resistance Prioritization
| Resource | Type | Primary Function | Application Context |
|---|---|---|---|
| HMD-ARG-DB [45] | Consolidated ARG Database | Integrates annotations from 7 source databases; >17,000 ARG sequences | Training and validation data for machine learning models |
| CARD [4] [40] | Manually Curated Database | Antibiotic Resistance Ontology (ARO); reference sequences and mechanisms | Gold standard for known ARG comparison and validation |
| ResFinder/PointFinder [4] | Specialized Tool & Database | Identifies acquired AMR genes and chromosomal point mutations | Detection of known acquired resistance determinants |
| ProtBert-BFD [54] | Protein Language Model | Extracts protein sequence embeddings capturing sequential patterns | Feature extraction for deep learning-based ARG prediction |
| ESM-1b [54] | Protein Language Model | Encodes protein structural information (secondary/tertiary) | Complementary structural feature extraction for ARG prediction |
| GraphPart [45] | Data Partitioning Tool | Precise separation of datasets with guaranteed similarity thresholds | Rigorous training-testing splits for model validation |
| iModulons [40] | Regulatory Module Database | Independently modulated gene sets from independent component analysis | Mapping resistance signatures to transcriptional regulatory programs |
Discussion: Integration Pathways for Clinical Translation
The comparative analysis reveals distinctive strengths and application domains for each prioritization framework. ProtAlign-ARG's hybrid approach offers particularly robust performance for detecting divergent ARG variants through its intelligent switching mechanism between deep learning and alignment-based methods [45]. The GA-AutoML framework excels in identifying minimal, clinically actionable gene signatures from transcriptomic data, demonstrating that resistance prediction can be achieved with high accuracy using compact gene sets (35-40 genes) rather than entire transcriptomes [40]. The ensemble protein language model architecture provides superior discrimination between closely related resistance and non-resistance genes, significantly reducing both false positives and false negatives that plague conventional methods [54].
A critical finding across multiple studies is the limited overlap between computationally prioritized resistance targets and previously characterized ARGs in curated databases. The GA-AutoML framework identified that only 2-10% of its predictive gene signatures corresponded to known resistance markers in CARD [40], suggesting substantial undiscovered territory in the resistance landscape. This underscores the value of these frameworks for uncovering novel intrinsic and acquired resistance mechanisms that evade conventional detection methods. For drug development professionals, this implies that target prioritization must extend beyond known resistance genes to include transcriptional regulators, metabolic pathways, and stress response systems that contribute to the resistant phenotype.
The translation of these computational frameworks into clinical practice faces several challenges. The GA-AutoML approach requires transcriptomic data from clinical isolates under antibiotic exposure, which may present practical hurdles for routine implementation [40]. Protein language model-based methods demand substantial computational resources and expertise that may not be universally accessible [45] [54]. Furthermore, clinical validation remains essential for establishing the predictive value of prioritized targets in patient outcomes. Future developments should focus on creating more streamlined workflows, expanding model training across diverse pathogen populations, and establishing standardized validation protocols that bridge computational predictions with clinical susceptibility testing.
For researchers validating intrinsic resistance gene function, these frameworks offer powerful complementary approaches. ProtAlign-ARG's mobility predictions can help distinguish intrinsic chromosomal genes from acquired elements [45], while the GA-AutoML's ability to link transcriptomic patterns to resistance phenotypes provides functional validation for candidate intrinsic resistance genes [40]. The ensemble protein language model's high precision reduces misclassification of non-resistance genes as ARGs [54], particularly valuable when studying chromosomal genes with primary metabolic functions that may contribute to intrinsic resistance.
The evolving landscape of ARG prioritization frameworks demonstrates a clear trajectory toward more accurate, interpretable, and clinically actionable computational tools. Integration of protein language models, evolutionary algorithms, and hybrid approaches has substantially advanced our ability to identify high-risk resistance targets from complex genomic and transcriptomic datasets. These frameworks increasingly bridge the gap between computational prediction and biological validation, offering researchers multidimensional insights into resistance mechanisms beyond what conventional methods provide.
For the antimicrobial research community, adopting these frameworks can accelerate the identification of critical resistance targets, guide experimental validation efforts, and ultimately inform the development of novel therapeutic strategies against multidrug-resistant pathogens. As these tools continue to evolve, their integration into standardized resistance surveillance pipelines and drug development workflows will be essential for addressing the escalating AMR crisis. The future of resistance target prioritization lies in the intelligent combination of complementary approaches—leveraging the pattern recognition capabilities of deep learning with the biological precision of alignment methods and the feature optimization of evolutionary algorithms—to build robust, clinically translatable systems for combating antimicrobial resistance.
Conclusion
The validation of intrinsic resistance gene function is a critical frontier in overcoming antimicrobial resistance. This synthesis demonstrates that effective strategies must move beyond simple gene identification to encompass a deep understanding of mechanistic action, evolutionary trajectories, and clinical context. The integration of genome-wide screens, machine learning, and evolutionary experiments provides a powerful toolkit for pinpointing high-value targets, such as efflux pumps, for resistance-breaking interventions. However, the persistent challenge of evolutionary recovery underscores the need for combinatorial approaches that anticipate bacterial counter-adaptation. Future research must prioritize the translation of these validated targets into next-generation therapeutics, including optimized prodrugs and combination regimens, while advancing diagnostic frameworks that incorporate gene mobility and host context. Embracing this multifaceted, forward-looking approach is essential for developing durable solutions to the escalating AMR crisis.
References
- 1. of antibacterial Mechanism , strategies and next-generation... resistance [https://pmc.ncbi.nlm.nih.gov/articles/PMC11362070/]
- 2. Impeding pathways of intrinsic resistance in Escherichia coli ... [https://pmc.ncbi.nlm.nih.gov/articles/PMC12543169/]
- 3. Validating the AMRFinder Tool and Resistance Gene ... [https://pmc.ncbi.nlm.nih.gov/articles/PMC6811410/]
- 4. Identification of antibiotic resistance genes from whole ... [https://onehealthadv.biomedcentral.com/articles/10.1186/s44280-025-00079-x]
- 5. Global pathogenomic analysis identifies known and ... [https://www.nature.com/articles/s41467-023-43549-9]
- 6. Approach to combat antibiotic resistance turns bacterium's ... [https://www.stjude.org/media-resources/news-releases/2025-medicine-science-news/approach-to-combat-antibiotic-resistance-turns-bacteriums-genes-against-it.html]
- 7. Types and Mechanisms of Efflux Pump Systems and the ... [https://pmc.ncbi.nlm.nih.gov/articles/PMC10974122/]
- 8. Interplay Between Membrane Permeability and ... - PMC [https://pmc.ncbi.nlm.nih.gov/articles/PMC6034560/]
- 9. Advances in the Discovery of Efflux Pump Inhibitors as ... [https://pmc.ncbi.nlm.nih.gov/articles/PMC10525980/]
- 10. Function and Inhibitory Mechanisms of Multidrug Efflux ... [https://www.frontiersin.org/journals/microbiology/articles/10.3389/fmicb.2021.737288/full]
- 11. Bacterial Enzymes and Antibiotic Resistance - PMC [https://pmc.ncbi.nlm.nih.gov/articles/PMC6351036/]
- 12. Predicting drug inactivation by changes in bacterial growth ... [https://www.nature.com/articles/s44259-025-00152-w]
- 13. Time-Dependent Influence of Cell Membrane Permeability ... [https://pmc.ncbi.nlm.nih.gov/articles/PMC4676747/]
- 14. The Global Challenge of Antimicrobial Resistance [https://pmc.ncbi.nlm.nih.gov/articles/PMC12284435/]
- 15. Impeding pathways of intrinsic resistance in Escherichia coli ... [https://journals.plos.org/plosbiology/article?id=10.1371/journal.pbio.3003443]
- 16. WHO warns of widespread resistance to common ... [https://www.who.int/news/item/13-10-2025-who-warns-of-widespread-resistance-to-common-antibiotics-worldwide]
- 17. An overview of the antimicrobial resistance mechanisms ... [https://pmc.ncbi.nlm.nih.gov/articles/PMC6604941/]
- 18. Identification and Functional Analysis of ncRNAs ... [https://pmc.ncbi.nlm.nih.gov/articles/PMC11356903/]
- 19. Evaluation of Antibiotic Resistance Mechanisms in Gram ... [https://pmc.ncbi.nlm.nih.gov/articles/PMC10668847/]
- 20. Resistance mechanisms in Gram-negative bacteria [https://medintensiva.org/en-resistance-mechanisms-in-gram-negative-bacteria-articulo-S2173572722000947]
- 21. Structure of the Tripartite Multidrug Efflux Pump AcrAB-TolC ... [https://pmc.ncbi.nlm.nih.gov/articles/PMC4332038/]
- 22. Escherichia coli resistance mechanism AcrAB-TolC efflux ... [https://www.nature.com/articles/s41598-024-52536-z]
- 23. Expression of multidrug efflux pump gene acrAB in ... [https://pubmed.ncbi.nlm.nih.gov/41120967/?utm_source=FeedFetcher&utm_medium=rss&utm_campaign=None&utm_content=1R3QZIpFgeaXQJt8K9w8_oRDFOUkgIho18PKxDpWTR1UFZLoNX&fc=None&ff=20251023005157&v=2.18.0.post22+67771e2]
- 24. An allosteric transport mechanism for the AcrAB-TolC ... [https://elifesciences.org/articles/24905]
- 25. Comparative reassessment of AcrB efflux inhibitors reveals ... [https://pmc.ncbi.nlm.nih.gov/articles/PMC10846202/]
- 26. Expression of multidrug efflux pump gene acrAB in ... [https://bmcinfectdis.biomedcentral.com/articles/10.1186/s12879-025-11778-6]
- 27. Antimicrobial efflux and biofilms: an interplay leading to ... [https://www.sciencedirect.com/science/article/pii/S0966842X25001234]
- 28. Emerging antibiotic resistance by various novel proteins /enzymes [https://link.springer.com/article/10.1007/s10096-025-05126-4]
- 29. Unveiling the role of BON domain-containing proteins ... - PMC [https://pmc.ncbi.nlm.nih.gov/articles/PMC11747388/]
- 30. Functional characterization and mechanism of the ... [https://www.sciencedirect.com/science/article/abs/pii/S0141813024099264]
- 31. Structure of dual BON - domain DolP identifies phospholipid... protein [https://elifesciences.org/articles/62614]
- 32. Determination of Antibiotic Hypersensitivity among 4000 ... [https://pmc.ncbi.nlm.nih.gov/articles/PMC2519525/]
- 33. Genome-wide Screening of the Escherichia coli Keio ... [https://link.springer.com/article/10.1007/s10096-025-05183-9]
- 34. Genome-Wide Screens Identify Genes Responsible for ... [https://link.springer.com/article/10.1007/s12011-024-04129-0]
- 35. Drivers of intrinsic resistance - PMC [https://pmc.ncbi.nlm.nih.gov/articles/PMC9149149/]
- 36. CRISPR screening strategies: resistance vs. sensitivity [https://www.revvity.com/blog/crispr-screening-strategies-resistance-vs-sensitivity-whats-right-your-study]
- 37. CRISPR-Cas9 high-throughput screening to study drug ... [https://pubmed.ncbi.nlm.nih.gov/38864609/]
- 38. Advances in high-throughput drug screening based on ... [https://www.sciencedirect.com/science/article/pii/S2090123225006897]
- 39. Determination of hypersensitivity to genotoxic agents ... [https://www.sciencedirect.com/science/article/abs/pii/S1568786410002065]
- 40. Minimal gene signatures enable high-accuracy prediction ... [https://www.nature.com/articles/s41540-025-00584-0]
- 41. Minimal gene signatures enable high-accuracy prediction of ... [https://pubmed.ncbi.nlm.nih.gov/41038842/]
- 42. Machine Learning-Based identification of resistance genes ... [https://plantmethods.biomedcentral.com/articles/10.1186/s13007-025-01383-8]
- 43. A machine learning-based gene signature of response to the ... [https://bmcbioinformatics.biomedcentral.com/articles/10.1186/s12859-021-04040-8]
- 44. Transcriptomic analysis and machine learning modeling ... [https://pmc.ncbi.nlm.nih.gov/articles/PMC12209200/]
- 45. ProtAlign-ARG: antibiotic resistance gene characterization ... [https://www.nature.com/articles/s41598-025-14545-4]
- 46. [PDF] PLM-ARG: antibiotic resistance gene identification using a ... [https://www.semanticscholar.org/paper/PLM-ARG%3A-antibiotic-resistance-gene-identification-Wu-Jian/b4f6aa44b92a8a09684ac7fae3d41a36a7968164]
- 47. Prediction of antibiotic resistance mechanisms using a ... [https://pmc.ncbi.nlm.nih.gov/articles/PMC11464418/]
- 48. Identification & classification of antibiotic resistance genes ... [https://www.semanticscholar.org/paper/LM-ARG%3A-Identification-%26-classification-of-genes-Ahmed-Emon/8ecd3c3b4526e3f390460b61693e0537cb2cf5c8]
- 49. ARGNet: using deep neural networks for robust identification ... [https://microbiomejournal.biomedcentral.com/articles/10.1186/s40168-024-01805-0]
- 50. Metagenomics as a Transformative Tool for Antibiotic ... [https://pmc.ncbi.nlm.nih.gov/articles/PMC11939754/]
- 51. Antibiotic Resistance: A Genetic and Physiological Perspective [https://pmc.ncbi.nlm.nih.gov/articles/PMC12579171/]
- 52. Researchers capture new antibiotic resistance mechanisms ... [https://aces.illinois.edu/news/researchers-capture-new-antibiotic-resistance-mechanisms-trace-amounts-dna]
- 53. Global diversity and distribution of antibiotic resistance ... [https://www.nature.com/articles/s41467-025-59019-3]
- 54. Predicting antibiotic resistance genes and bacterial ... [https://www.frontiersin.org/journals/microbiology/articles/10.3389/fmicb.2025.1628952/full]
- 55. Prediction of antibiotic resistance from ... [https://www.nature.com/articles/s41598-025-14078-w]
- 56. Comparative Evaluation of Time Series Forecasting ... [https://www.medrxiv.org/content/10.1101/2025.04.17.25325964v1.full-text]
- 57. Prodrug florfenicol amine is activated by intrinsic resistance ... [https://www.nature.com/articles/s41564-025-02147-9]
- 58. Antibiotic Prodrug Uses Bacteria's Resistance Genes to ... [https://www.insideprecisionmedicine.com/topics/translational-research/antibiotic-prodrug-uses-bacterias-resistance-genes-to-turn-against-itself/]
- 59. smProdrugs: A repository of small molecule prodrugs [https://www.sciencedirect.com/science/article/abs/pii/S0223523423000685]
- 60. Genome-Wide Identification of Antimicrobial Intrinsic ... [https://www.frontiersin.org/journals/microbiology/articles/10.3389/fmicb.2016.02018/full]
- 61. Genes Contributing to the Unique Biology and Intrinsic ... [https://pmc.ncbi.nlm.nih.gov/articles/PMC7701990/]
- 62. Systematic analysis of bypass suppression of essential genes [https://pmc.ncbi.nlm.nih.gov/articles/PMC7507402/]
- 63. Gene Essentiality Is a Quantitative Property Linked to ... [https://www.sciencedirect.com/science/article/pii/S0092867415014257]
- 64. Effect of compensatory evolution in the emergence and ... [https://www.sciencedirect.com/science/article/pii/S2666524723001106]
- 65. Mutualism breakdown underpins evolutionary rescue in an ... [https://www.nature.com/articles/s41467-025-58742-1]
- 66. Compensatory evolution to DNA replication stress is robust ... [https://pmc.ncbi.nlm.nih.gov/articles/PMC12494895/]
- 67. Gene Loss Predictably Drives Evolutionary Adaptation - PMC [https://pmc.ncbi.nlm.nih.gov/articles/PMC7530610/]
- 68. Towards the integration of antibiotic resistance gene ... [https://www.nature.com/articles/s44259-025-00154-8]
- 69. Transcriptional regulatory factor AHA_4052 regulates ... [https://www.frontiersin.org/journals/microbiology/articles/10.3389/fmicb.2025.1689335/full]
- 70. Small-molecule strategies to combat antibiotic resistance [https://pubs.rsc.org/en/content/articlehtml/2025/ra/d5ra04047g?page=search]
- 71. Expression of multidrug efflux pump gene acrAB in ... [https://pmc.ncbi.nlm.nih.gov/articles/PMC12539121/]
- 72. Efflux pump knockout minimizes crosstalk and boosts ... [https://pmc.ncbi.nlm.nih.gov/articles/PMC12613691/]
- 73. Evolutionary loss of an antibiotic efflux pump increases ... [https://www.nature.com/articles/s41467-025-63284-7]
- 74. Antibiotic resistance mediated by gene amplifications [https://www.nature.com/articles/s44259-024-00052-5]
- 75. Comprehensive genome catalog analysis of the resistome ... [https://www.nature.com/articles/s41522-025-00746-2]
- 76. Understanding antimicrobial resistance (AMR) ... [https://www.sciencedirect.com/science/article/abs/pii/S073288932500272X]
- 77. Molecular Methods for Detection of Antimicrobial Resistance [https://pmc.ncbi.nlm.nih.gov/articles/PMC11687549/]
- 78. Expressions of resistome is linked to the key functions and ... [https://pmc.ncbi.nlm.nih.gov/articles/PMC9167530/]
- 79. Quantitative Data Analysis. A Complete Guide [2025] [https://www.6sigma.us/six-sigma-in-focus/quantitative-data-analysis/]
- 80. The intrinsic resistome of bacterial pathogens [https://www.frontiersin.org/journals/microbiology/articles/10.3389/fmicb.2013.00103/full]
- 81. The WHO presents a new roadmap to combat drug ... [https://biotech-spain.com/en/articles/the-who-presents-a-new-roadmap-to-combat-drug-resistance-with-the-participation-of-irsicaixa-researcher-roger-paredes-/]
- 82. The Effect of Antibiotic‐Cycling Strategy on ... - PubMed Central [https://pmc.ncbi.nlm.nih.gov/articles/PMC7496894/]
- 83. Guiding model‐driven combination dose selection using multi ... [https://pmc.ncbi.nlm.nih.gov/articles/PMC10681518/]
- 84. Optimizing drug combination and mechanism analysis ... [https://www.nature.com/articles/s41597-024-02915-y]
- 85. Quantitative systems-based prediction of antimicrobial ... [https://www.nature.com/articles/s41540-023-00304-6]
- 86. Overcoming Toxicity Challenges in Gene Therapy [https://www.technologynetworks.com/biopharma/blog/overcoming-toxicity-challenges-in-gene-therapy-406245]
- 87. T cell engagers: expanding horizons in oncology and beyond [https://www.nature.com/articles/s41416-025-03125-y]
- 88. The clinical toxicity of advanced therapy medicinal products [https://pubmed.ncbi.nlm.nih.gov/40509780/]
- 89. Artificial intelligence in pharmacovigilance: advancing drug ... [https://pmc.ncbi.nlm.nih.gov/articles/PMC12317250/]
- 90. Minimal gene signatures enable high-accuracy prediction ... [https://pmc.ncbi.nlm.nih.gov/articles/PMC12491527/]
- 91. Identification and experimental validation of biomarkers ... [https://www.nature.com/articles/s41598-025-17606-w]
- 92. What Is The Difference Between Phenotypic Versus ... [https://www.idstewardship.com/difference-phenotypic-versus-genotypic-resistance/]
- 93. Phenotypic Resistance to Antibiotics - PMC [https://pmc.ncbi.nlm.nih.gov/articles/PMC4790337/]
- 94. Rapid Phenotypic and Genotypic Antimicrobial ... [https://pmc.ncbi.nlm.nih.gov/articles/PMC11351821/]
- 95. Next-generation rapid phenotypic antimicrobial ... [https://www.nature.com/articles/s41467-024-53930-x]
- 96. Making AST fast [https://myadlm.org/cln/articles/2025/mayjune/making-act-fast]
- 97. Genetics of Antimicrobial Resistance - NCBI - NIH [https://www.ncbi.nlm.nih.gov/books/NBK216503/]
- 98. Genetic mechanisms of antimicrobial resistance identified ... [https://www.frontiersin.org/journals/microbiology/articles/10.3389/fmicb.2013.00135/full]
- 99. CLSI AST News Updates [https://clsi.org/resources/clsi-ast-news-updates/]
- 100. Comparative Analysis of Antibiotic Resistance and ... [https://weekly.chinacdc.cn/en/article/doi/10.46234/ccdcw2025.241]
- 101. Global trends in antimicrobial resistance of Enterococcus ... [https://www.frontiersin.org/journals/pharmacology/articles/10.3389/fphar.2025.1505674/full]
- 102. Enterococcus faecium as an Emerging Pathogen [https://www.mdpi.com/2076-0817/14/5/483]
- 103. Genomic Characterization and Safety Evaluation of ... [https://www.mdpi.com/2079-6382/14/6/612]
- 104. Comparative Genomic Analysis and Antimicrobial ... [https://pmc.ncbi.nlm.nih.gov/articles/PMC12390221/]
- 105. Differences in antimicrobial resistance gene abundance and ... [https://pmc.ncbi.nlm.nih.gov/articles/PMC12144387/]
- 106. Species-resolved profiling of antibiotic resistance genes in ... [https://www.nature.com/articles/s41467-025-57088-y]
- 107. Comparative Genomic Analysis of Antimicrobial-Resistant ... [https://pmc.ncbi.nlm.nih.gov/articles/PMC9501560/]
- 108. Comparative and functional genomic analysis of foreign ... [https://pmc.ncbi.nlm.nih.gov/articles/PMC12323599/]
- 109. ARGem: a new metagenomics pipeline for antibiotic ... [https://pmc.ncbi.nlm.nih.gov/articles/PMC10558085/]
- 110. MGE-associated ARGs exhibit higher expression efficiency ... [https://www.sciencedirect.com/science/article/pii/S0160412025004040]
- 111. Metagenomic deciphers the mobility and bacterial hosts of ... [https://www.sciencedirect.com/science/article/abs/pii/S0013935125001720]
- 112. Rapid and Accurate Discrimination of Mycobacterium ... [https://pmc.ncbi.nlm.nih.gov/articles/PMC9856018/]
- 113. Accurate Diagnosis of Pseudomonas aeruginosa Is Critical to ... [https://pmc.ncbi.nlm.nih.gov/articles/PMC12108264/]
- 114. Difference between E. Coli and Pseudomonas Aeruginosa [https://byjus.com/neet/difference-between-e-coli-and-pseudomonas-aeruginosa/]
- 115. Antimicrobial Treatment Provides a Competitive Advantage ... [https://pmc.ncbi.nlm.nih.gov/articles/PMC6811427/]
- 116. Detecting antibiotic resistance: classical, molecular, advanced ... [https://pmc.ncbi.nlm.nih.gov/articles/PMC12531165/]