gDNA vs. cfDNA in NGS for Chemogenomics: A Strategic Guide for Drug Development
This article provides a comprehensive comparison of genomic DNA (gDNA) and cell-free DNA (cfDNA) based Next-Generation Sequencing (NGS) methodologies within chemogenomic studies.
gDNA vs. cfDNA in NGS for Chemogenomics: A Strategic Guide for Drug Development
Abstract
This article provides a comprehensive comparison of genomic DNA (gDNA) and cell-free DNA (cfDNA) based Next-Generation Sequencing (NGS) methodologies within chemogenomic studies. Aimed at researchers and drug development professionals, it explores the foundational biology and distinct origins of these analytes—gDNA from intact cells and cfDNA from apoptotic or necrotic cells. The scope covers their methodological applications from target discovery to treatment monitoring, addresses key challenges like host DNA depletion and low cfDNA yield, and offers a direct performance comparison on sensitivity, specificity, and clinical utility. By synthesizing current trends and data, this guide aims to inform strategic decisions in assay selection to accelerate precision medicine and oncology research.
The Biological Blueprint: Understanding the Origins and Characteristics of gDNA and cfDNA
In chemogenomic studies and drug development, the choice of genetic analyte is fundamental. Genomic DNA (gDNA) isolated from cellular nuclei and cell-free DNA (cfDNA) circulating in blood plasma represent two distinct sources of biological information with different origins, characteristics, and applications [1]. gDNA provides a comprehensive blueprint of an organism's genetic makeup, typically extracted from intact cells. In contrast, cfDNA consists of short, fragmented DNA molecules released into bodily fluids through cellular processes such as apoptosis and necrosis [2] [1]. These differences directly influence their utility in research settings, particularly for next-generation sequencing (NGS) applications in cancer research, biomarker discovery, and therapeutic monitoring.
The fragmentation pattern of cfDNA is non-random and provides a rich source of biological information. The most frequent fragment size is approximately 167 base pairs (bp), corresponding to DNA wrapped around a single histone complex [2]. Other complexes like transcription factors and transcription machinery also protect DNA from degradation, resulting in unique fragmentation patterns specific to genomic locations where these complexes are bound [2]. This fragmentomics data can infer epigenetic and transcriptional information about the tissue of origin, which is particularly valuable in cancer research for identifying tumor subtypes and responses to treatment.
Fundamental Characteristics and Comparative Analysis
gDNA and cfDNA differ significantly in their physical properties, molecular origins, and the type of biological information they yield. The table below summarizes the key distinctions between these two analytes:
Table 1: Core Characteristics of gDNA vs. cfDNA
| Characteristic | gDNA from Cellular Nuclei | cfDNA as Circulating Biomarker |
|---|---|---|
| Source Material | Intact cells (tissue biopsies, blood cells) | Bodily fluids (plasma, serum, CSF) [1] |
| Isolation Difficulty | Moderate (requires cellular material) | High (low concentration, requires careful handling) [1] |
| DNA Fragment Size | Long, high molecular weight strands | Short, fragmented (∼167 bp is most common) [2] |
| Primary Origin | Nuclei of all sampled cells | Apoptosis, necrosis of various cells [1] |
| Tumor Representation | Limited to sampled tissue site | May represent heterogeneous tumor clones [3] |
| Application in NGS | Whole genome, exome, targeted sequencing | Liquid biopsy, fragmentomics, methylation studies [2] [3] |
The analytical approaches for gDNA and cfDNA have diverged to leverage their unique properties. gDNA is typically used for comprehensive variant discovery, including single nucleotide variants (SNVs), insertions/deletions (indels), and copy number variations (CNVs) across the entire genome or exome [3]. cfDNA analysis, while also used for variant detection, has expanded to include fragmentomics—the study of DNA fragmentation patterns—which can infer epigenetic and transcriptional data from the cell of origin [2]. Additionally, methylation profiling of cfDNA is increasingly used for cancer detection and monitoring, as methylation changes are early events in tumorigenesis [4].
Table 2: Analytical Approaches for gDNA and cfDNA in NGS
| Analytical Method | gDNA Applications | cfDNA Applications |
|---|---|---|
| Variant Calling | Primary application (SNVs, indels, CNVs) [3] | Possible but limited by low tumor fraction [4] |
| Fragmentomics | Not applicable | Emerging method for inferring epigenetic state [2] |
| Methylation Analysis | Possible but requires bisulfite conversion | Tumor-agnostic detection; early cancer signals [4] |
| Copy Number Analysis | Standard approach | Possible via shallow whole-genome sequencing [4] |
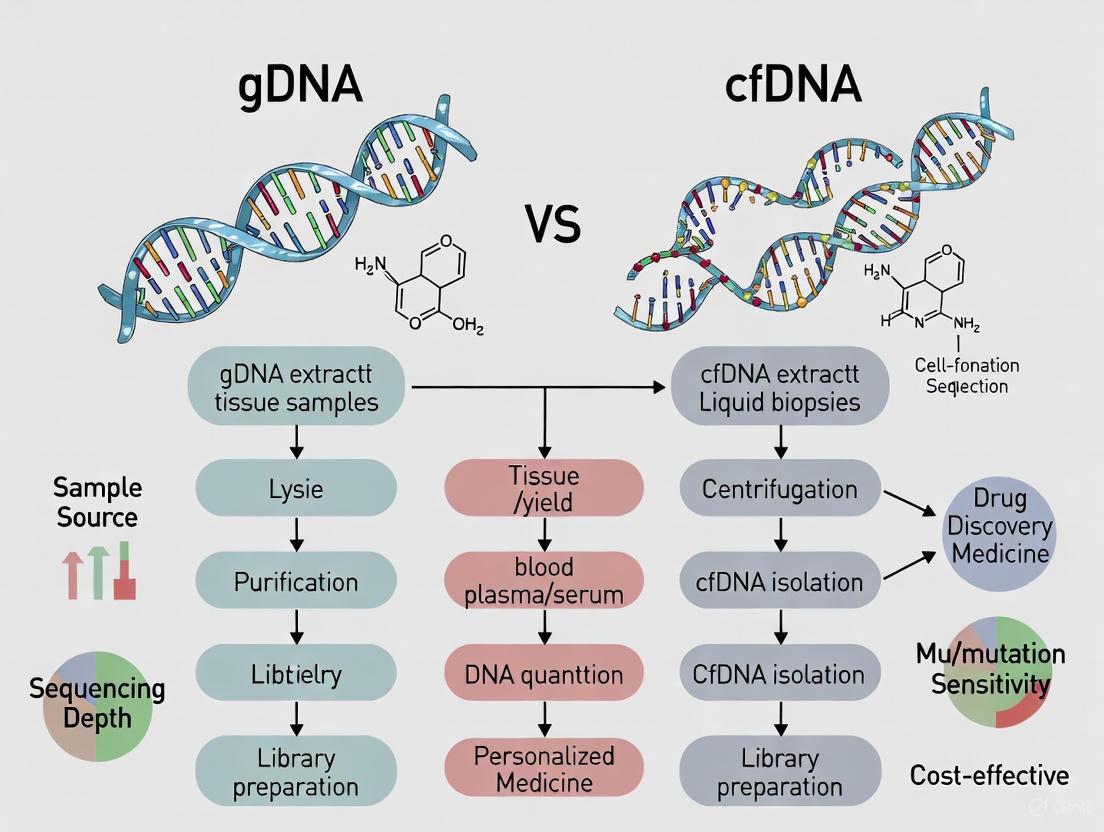
Experimental Protocols: From Sample to Data
Sample Collection and Isolation Methods
Proper sample collection and processing is particularly critical for cfDNA analysis due to its low concentration in circulation. For cfDNA isolation from blood, samples should be collected in tubes containing stabilizers (e.g., EDTA, Streck, or CellSave tubes) and processed within a narrow timeframe (within 4 hours for EDTA tubes up to 96 hours for CellSave/Streck tubes) [4]. Plasma must be separated through a two-step centrifugation process to remove intact cells and debris [4] [1]. The choice of extraction methodology significantly impacts cfDNA yield and quality, with automated systems like the Maxwell RSC ccfDNA Plasma Kit demonstrating high efficiency and reproducibility compared to manual kits [1] [5].
For gDNA isolation from tissue, the process begins with tissue homogenization followed by cell lysis. DNA is then purified using various methods including silica-based membrane columns, magnetic beads, or organic extraction, with quality and quantity assessed via spectrophotometry or fluorometry [6].
DNA Quantification Methods
Accurate DNA quantification is essential for successful NGS library preparation. The table below compares common quantification methods:
Table 3: DNA Quantification Methods for NGS Applications
| Method | Principle | Sensitivity | Information Provided |
|---|---|---|---|
| UV-Vis Spectrophotometry | Absorption of UV light by nucleic acids [6] | Low (2-5 ng/μL) | Concentration; protein/salt contamination [6] |
| Fluorometry | Fluorescent dyes binding to dsDNA [6] | High (<0.5 ng/μL) | Specific dsDNA concentration [6] |
| Digital PCR (dPCR) | Partitioning and endpoint PCR detection [7] | Very High (single copy) | Absolute quantification of specific targets [7] |
| qPCR | Real-time fluorescence during PCR [7] | High | Relative quantification via standard curve [7] |
| Capillary Electrophoresis | Electrokinetic separation in capillaries [6] | Moderate | Size distribution and quantitation [6] |
Digital PCR has demonstrated superior sensitivity and quantification precision, particularly at low DNA concentrations (<1 copy/μL), making it especially suitable for cfDNA analysis and rare mutation detection [7].
Sequencing Approaches and Workflows
NGS applications for both gDNA and cfDNA can be divided into several approaches: whole-genome sequencing (WGS), whole-exome sequencing (WES), targeted sequencing panels, and RNA sequencing [3] [8]. For cfDNA, two additional approaches are metagenomic sequencing (mNGS) and targeted NGS (tNGS) [9].
The following diagram illustrates the core workflows for preparing gDNA and cfDNA for NGS analysis:
For targeted NGS panels—commonly used in clinical settings for their cost-effectiveness and high coverage depth—the process involves either amplicon-based or hybridization capture-based approaches to enrich for genes of interest before sequencing [3]. Fragmentomics analysis, an emerging application for cfDNA, utilizes various metrics including fragment length proportions, normalized fragment read depth, end motif diversity, and patterns around transcription factor binding sites or open chromatin regions to infer epigenetic information [2].
Essential Research Reagents and Kits
Table 4: Key Reagent Solutions for DNA Isolation and Analysis
| Reagent/Kits | Primary Function | Application Notes |
|---|---|---|
| QIAamp Circulating Nucleic Acid Kit | Manual cfDNA isolation from plasma | High efficiency; labor-intensive [1] [5] |
| Maxwell RSC ccfDNA Plasma Kit | Automated cfDNA isolation | High yield; reproducible [1] [5] |
| DNeasy Blood & Tissue Kit | gDNA isolation from tissues/cells | Standard for cellular DNA extraction [7] |
| Qubit dsDNA HS Assay Kit | Fluorometric DNA quantification | Specific for dsDNA; highly sensitive [1] |
| Agilent 2100 Bioanalyzer | Fragment size analysis | Essential for cfDNA quality control [1] |
| Digital PCR Systems | Absolute DNA quantification | Superior for low-abundance targets [7] [1] |
Application in Chemogenomic Studies and Cancer Research
In chemogenomic studies, gDNA and cfDNA offer complementary insights. gDNA from tumor biopsies remains the gold standard for comprehensive molecular profiling, enabling the detection of a wide variety of genetic alterations and providing material for transcriptomic and proteomic analyses [3]. However, cfDNA analysis through liquid biopsies addresses several limitations of tissue biopsies, including invasiveness, tumor heterogeneity, and the inability to perform serial monitoring [1].
Fragmentomics-based analysis of cfDNA has recently emerged as a powerful method for cancer phenotyping. Research has demonstrated that multiple fragmentomics metrics can predict cancer types and subtypes using commercially available targeted sequencing panels, with normalized read depth across all exons providing the best overall performance (AUROC of 0.943-0.964 across cohorts) [2]. This approach successfully differentiates between various cancer types (bladder, breast, prostate, renal cell, lung) and subtypes (ER-positive vs. ER-negative breast cancer, adenocarcinoma vs. neuroendocrine prostate cancer) [2].
The following diagram illustrates how gDNA and cfDNA analysis can be integrated in cancer research and therapeutic monitoring:
For therapeutic monitoring, cfDNA offers unique advantages. Studies have shown that changes in ctDNA levels during neoadjuvant chemotherapy (NAC) for breast cancer are associated with treatment response and survival outcomes [4]. Tumor-agnostic methods for ctDNA detection, including methylation profiling (MeD-Seq) and fragmentomics, show promise for monitoring treatment response without requiring prior knowledge of tumor-specific mutations [4].
gDNA from cellular nuclei and cfDNA as a circulating biomarker represent complementary analytes that together provide a more complete picture of tumor genetics and dynamics in chemogenomic research. gDNA remains essential for comprehensive initial molecular profiling, while cfDNA enables non-invasive serial monitoring of treatment response and clonal evolution. The emerging field of fragmentomics adds another dimension to cfDNA analysis, allowing inference of epigenetic information from fragmentation patterns.
The choice between these analytes depends on research objectives, sample availability, and required sensitivity. As isolation methods improve and sequencing costs decrease, the integration of both gDNA and cfDNA analysis will likely become standard practice in precision oncology and chemogenomic studies, providing a holistic approach to understanding tumor biology and therapeutic response.
In the landscape of chemogenomic studies and drug development, the choice of genetic material for next-generation sequencing (NGS) is pivotal. While genomic DNA (gDNA) has traditionally been the cornerstone of genetic analysis, cell-free DNA (cfDNA) has emerged as a powerful alternative, offering a non-invasive window into physiological and pathological states. The biological origins of cfDNA—primarily through apoptosis, necrosis, and active secretion—fundamentally shape its characteristics and analytical utility. Understanding these mechanisms is essential for researchers and drug development professionals to appropriately select and interpret gDNA-based versus cfDNA-based NGS approaches. This guide objectively compares these DNA sources within chemogenomic research, providing experimental data and methodologies to inform your study designs.
Core Release Mechanisms of cfDNA
Cell-free DNA is released into bodily fluids through distinct pathways, each imparting unique molecular signatures. These origins influence fragment characteristics, molecular features, and ultimately, the applications in clinical and research settings.
Apoptotic Cell Death
Apoptosis, a form of programmed cell death, is a major source of cfDNA, particularly in healthy individuals [10]. This process is executed by caspases, leading to cell shrinkage, chromatin condensation, and systematic fragmentation of cellular contents [10].
- Mechanism: During apoptosis, caspase-activated nucleases (such as CAD, DNaseI L-3, NM23-H1, and EndoG) are activated. These enzymes cleave DNA at internucleosomal regions, creating fragments wrapped around nucleosomal structures [10].
- Fragment Characteristics: Apoptosis produces cfDNA with a distinctive ladder-like pattern on gel electrophoresis. The dominant fragment size is approximately 167 base pairs (bp), which corresponds to the length of DNA wrapped around one nucleosome (147 bp) plus a linker DNA [10] [11]. This population is often described as short-sized fragments.
- Biological Significance: As the primary source of background cfDNA in circulation, apoptotic fragments form the baseline against which tumor-derived signals must be detected. In chemogenomic studies, drugs that induce apoptosis may cause a transient increase in this short-fragment cfDNA population.
Necrotic Cell Death
Necrosis is an unprogrammed form of cell death resulting from cellular damage, often prevalent in tumor microenvironments due to factors like hypoxia and nutrient deprivation [10].
- Mechanism: Unlike the controlled process of apoptosis, necrosis involves organelle dysfunction and plasma membrane rupture, leading to the random release of cellular contents, including DNA, into the extracellular space [10]. This DNA is exposed to intracellular and extracellular degradative agents.
- Fragment Characteristics: Necrosis releases longer, more heterogeneous DNA fragments, ranging up to many kilo-base pairs (kbp) in size [10] [11]. The fragmentation is non-systematic.
- Biological Significance: The presence of longer cfDNA fragments can indicate pathological conditions, such as tumor progression or treatment-induced cytotoxicity. In cancer patients, necrosis within tumors contributes significantly to the pool of circulating tumor DNA (ctDNA) [10].
Active Secretion
Beyond passive release from dead cells, viable cells can actively release DNA through regulated processes.
- Mechanisms: Active secretion primarily occurs via extracellular vesicles (EVs), such as exosomes and apoptotic bodies [10]. DNA can be packaged within these vesicles, which protect it from degradation during circulation.
- Fragment Characteristics: The size profile of actively secreted DNA is less well-defined but is likely heterogeneous, as vesicles can encapsulate DNA of varying lengths.
- Biological Significance: Active secretion represents a potential pathway for intercellular communication and may contribute to the spread of oncogenic material in cancer [12]. Its role is an emerging area of focus in liquid biopsy research.
The following diagram illustrates the pathways and resulting cfDNA fragments from these core release mechanisms:
Comparative Analysis: gDNA vs. cfDNA in Sequencing
The distinct origins of cfDNA create fundamental differences in its properties and performance in NGS compared to traditional gDNA. A 2025 study directly compared cfDNA and gDNA from 186 healthy individuals using the same sequencing platform, revealing critical performance distinctions [13].
Sequencing Performance and Coverage
- gDNA Advantages: gDNA sequencing typically provides more uniform coverage across the genome and identifies a greater number of variants due to its intact, high-molecular-weight nature [13].
- cfDNA Challenges: cfDNA exhibits a higher duplication rate and achieves a lower effective sequencing depth at the same raw sequencing output, partly due to its fragmented state. Significant coverage differences are particularly noted in centromeric regions [13].
Despite these technical differences, the allele frequency (AF) spectra, population structure analysis, and genomic association results (e.g., from genome-wide association studies or expression quantitative trait locus analysis) were largely consistent between the two DNA types, supporting the utility of cfDNA for many genetic studies [13].
Fragment Length and Integrity
The following table summarizes key differences in DNA characteristics that impact sequencing:
Table 1: Characteristic Differences Between gDNA and cfDNA
| Characteristic | Genomic DNA (gDNA) | Cell-Free DNA (cfDNA) |
|---|---|---|
| Primary Source | Nucleated blood cells (e.g., leukocytes) | Mixed cellular turnover, tumor cells (in cancer) [10] |
| Dominant Release Mechanism | N/A (extracted from cells) | Apoptosis (major), Necrosis, Active Secretion [10] |
| Typical Fragment Length | High molecular weight, intact | Short, fragmented (~167 bp peak) [11] [14] |
| Half-Life | N/A (stable in cells) | Short (16 min to several hours) [12] [14] |
| Key Challenge in NGS | Cellularity requirements, represents a single time point | Low abundance of target DNA (e.g., ctDNA), requires high-sensitivity assays [11] |
Experimental Protocols and Data Comparison
Robust experimentation is required to characterize cfDNA and validate its performance against gDNA. Below are summarized protocols from key studies and a comparative table of quantitative findings.
Pre-analytical and Extraction Methods
The pre-analytical phase is critical for cfDNA analysis due to its low concentration and short half-life.
- Blood Collection Tubes: Studies compare standard K3EDTA tubes with specialized cell-stabilizing tubes (e.g., Streck Cell-Free DNA BCT). While cfDNA levels in K3EDTA tubes increase with processing delay due to white blood cell lysis, they remain stable in BCT tubes for up to 96 hours and even after shipment [15].
- Centrifugation Protocols: A two-step centrifugation is standard. A first, slow-speed step (e.g., 820-1600 × g for 10 minutes) separates plasma from cells, followed by a high-speed step (e.g., 14,000-16,000 × g for 10 minutes) to remove any remaining cellular debris [15]. Studies show that a second centrifugation at 3000 × g yields similar cfDNA results as higher-speed protocols [15].
- Extraction Kits: Performance varies significantly. A 2020 study comparing the Qiagen CNA, Maxwell RSC ccfDNA Plasma, and Zymo Quick ccfDNA kits found that the Qiagen CNA kit consistently yielded the highest quantity of ccfDNA from cancer patient plasma [11]. However, the Maxwell RSC kit often resulted in higher variant allelic frequencies (VAFs) for tumor-specific mutants, which is crucial for detecting low-frequency variants in ctDNA [11].
Sequencing Technologies and Performance
The choice of sequencing platform profoundly impacts the ability to leverage the unique features of cfDNA.
- Next-Generation Sequencing (NGS): Short-read Illumina platforms are widely used. They provide high accuracy but struggle to capture long fragments from necrosis and require bisulfite conversion for methylation analysis, which damages DNA [14].
- Oxford Nanopore Technologies (ONT): A emerging powerful alternative for cfDNA. ONT sequences single molecules in real-time, providing long reads, direct detection of epigenetic modifications (like methylation) without bisulfite conversion, and the ability to integrate multi-omics data (fragmentomics, epigenetics, genetics) in a single assay [12] [14]. Low-coverage ONT sequencing (~0.8X) has been successfully used to determine tissue-of-origin and detect pathogens in critically ill patients, demonstrating its sensitivity [16]. For reliable detection of low-abundance tissues or microbes, a minimum coverage of 5X is recommended [16].
Table 2: Quantitative Comparison of gDNA and cfDNA Sequencing Performance
| Performance Metric | gDNA-based NGS | cfDNA-based NGS | Experimental Context & Citation |
|---|---|---|---|
| Variant Call Concordance | High (Reference) | Largely consistent | 186 healthy individuals; same platform [13] |
| Effective Sequencing Depth | Higher | Lower (at same raw output) | 186 healthy individuals; higher duplication in cfDNA [13] |
| Coverage Uniformity | More uniform | Less uniform; gaps in centromeres | 186 healthy individuals [13] |
| Input Material Yield | Micrograms | Nanograms (from milliliters of plasma) | Standard extraction protocols [11] |
| Ability to Infer Tissue of Origin | No | Yes (via methylation profiling) | ONT sequencing of ICU patients [16] |
The Scientist's Toolkit: Essential Research Reagents
Successful cfDNA analysis requires careful selection of reagents and tools throughout the workflow. The table below details key solutions for different stages of experimentation.
Table 3: Key Research Reagent Solutions for cfDNA Analysis
| Reagent / Kit | Primary Function | Key Consideration |
|---|---|---|
| Streck Cell-Free DNA BCT | Blood collection; stabilizes nucleated cells for delayed plasma processing. | Maintains cfDNA levels for up to 96+ hours at room temp; crucial for multi-site trials [15]. |
| QIAamp Circulating Nucleic Acid Kit | Silica-membrane-based extraction of cfDNA from plasma/serum. | Often provides high yields of total cfDNA; widely used as a benchmark [11] [15]. |
| Maxwell RSC ccfDNA Plasma Kit | Automated, magnetic bead-based extraction of cfDNA. | May provide higher variant allelic frequency for ctDNA, improving mutation detection sensitivity [11]. |
| Oxford Nanopore LSK114 Kit | Library preparation for nanopore sequencing of cfDNA. | Enables PCR-free, multi-omics (genetic, epigenetic, fragmentomic) data from a single run [12] [14]. |
| Unique Molecular Identifiers | Molecular barcodes to tag original DNA molecules pre-amplification. | Reduces sequencing artifacts and enables accurate quantification of rare variants [14]. |
The decision to use gDNA or cfDNA in chemogenomic studies is not a matter of simple superiority but of strategic alignment with research goals. gDNA remains the standard for comprehensive variant discovery due to its uniform coverage and high integrity. In contrast, cfDNA, with its origins in apoptosis, necrosis, and active secretion, offers a dynamic, non-invasive snapshot of systemic biology, including insights from tissues inaccessible to biopsy.
The emergence of long-read sequencing technologies like ONT, capable of simultaneously querying genetic, epigenetic, and fragmentomic features from a single cfDNA sample, is poised to unlock deeper layers of biological information [12] [14]. This multi-modal approach is particularly promising for monitoring drug response and understanding resistance mechanisms in oncology and beyond. As standardization in pre-analytical procedures and bioinformatic analysis continues to improve, cfDNA-based NGS is set to become an indispensable tool in the pipeline of modern drug development and personalized medicine.
The analysis of cell-free DNA (cfDNA) has emerged as a cornerstone of liquid biopsy applications in oncology and other fields, offering a non-invasive window into disease dynamics. In chemogenomic studies, which explore the interplay between chemical compounds and the genome, understanding the fundamental physical and chemical properties of cfDNA is paramount for effective research design and data interpretation. This guide provides a systematic comparison of these properties, focusing on fragment size, half-life, and molecular integrity, with particular emphasis on how cfDNA differs from genomic DNA (gDNA) in next-generation sequencing (NGS) applications. The distinct biological origins of these DNA types—with gDNA representing intact cellular DNA and cfDNA deriving primarily from apoptotic or necrotic cells—result in markedly different molecular characteristics that significantly influence experimental outcomes [17] [18].
Fundamental Properties of cfDNA vs. gDNA
Biological Origins and Structural Implications
Table 1: Core Physical Properties of cfDNA vs. gDNA
| Property | Cell-free DNA (cfDNA) | Genomic DNA (gDNA) |
|---|---|---|
| Primary Origin | Apoptosis, necrosis, active release [17] [18] | Intact cells from tissue or blood |
| Typical Fragment Size | 150-180 bp (mononucleosomal); multiples (di-/tri-nucleosomal) common [17] [18] | High molecular weight (>20,000 bp) |
| Size Range | 100-250 bp (majority); up to 700 bp [18] | Essentially unrestricted |
| Half-Life | 16 minutes - 2.5 hours [19] [20] | Not applicable (within intact cells) |
| Molecular Integrity | Highly fragmented; size patterns reflect tissue of origin [21] [22] | Intact strands |
| Circulating Tumor DNA (ctDNA) Features | Often shorter fragments (90-150 bp) than non-mutant cfDNA [21] | Not applicable |
Fragment Size Distribution and Significance
The fragment size distribution of cfDNA is not random but reflects its nucleosomal origin. A prominent peak at approximately 167 bp corresponds to DNA wrapped around a single nucleosome plus a short linker region [17] [22]. This pattern differs significantly from the high molecular weight of gDNA, which remains largely intact during extraction from cellular material.
Notably, circulating tumor DNA (ctDNA) often exhibits a different fragmentation profile than non-malignant cfDNA. Multiple studies have demonstrated enrichment of tumor-derived fragments in the 90-150 bp range [21]. This size difference can be exploited to enhance tumor detection sensitivity; selecting for shorter fragments (90-150 bp) through in vitro or in silico methods can improve ctDNA detection, with one study reporting more than 2-fold median enrichment in >95% of cases and more than 4-fold enrichment in >10% of cases [21].
Table 2: Quantitative Fragment Size Differences in Health and Disease
| Sample Type | Peak Fragment Size (Mode) | Notable Size Characteristics | Clinical/Research Implications |
|---|---|---|---|
| Healthy Individuals | 167 bp [17] [22] | Predominantly mononucleosomal peak | Baseline fragmentation pattern |
| Advanced Cancer Patients | Variable | Increased shorter fragments (<150 bp) | Shorter fragments associated with poorer prognosis [23] |
| Pancreatic Cancer (Pre-treatment) | ≤167 bp vs >167 bp | Shorter fragment size associated with worse prognosis | Shorter size: median OS 4.3 mo vs 9.6 mo (longer) [23] |
| ctDNA-Enriched Fractions | 90-150 bp | 2-4 fold enrichment of mutant alleles possible | Enhances detection of tumor-specific alterations [21] |
Experimental Methodologies for Property Analysis
Determining cfDNA Half-Life
Protocol: Exercise-Induced cfDNA Clearance Measurement [19]
- Objective: Determine the half-life of cfDNA fragments (100-250 bp) following exercise-induced elevation.
- Participants: Healthy adult men (n=5, age 40±4.1 years).
- Exercise Regimen: 30-minute treadmill exercise at controlled speed of 8 km/h.
- Sample Collection:
- Blood collected at 0, 5, 10, 15, 30, and 60 minutes post-exercise.
- Use of PAXgene Blood ccfDNA Tubes to stabilize cfDNA and prevent nuclease-mediated degradation.
- cfDNA Isolation:
- Double centrifugation: 15 min at 1,900×g followed by 15 min at 1,900×g.
- Extraction with QuickGene cfDNA isolation kit on QuickGene-Mini8L system.
- Quantification & Size Analysis:
- Electrophoresis-based quantification using 4150 TapeStation system.
- Specific focus on 100-250 bp fragments.
- Half-Life Calculation:
- Measured rate of concentration decline post-exercise.
- Reported Result: cfDNA half-life of 24.2 minutes [19].
Analyzing Fragment Size Distribution
Protocol: Multiplex ddPCR for cfDNA Fragment Sizing [22]
- Principle: Simultaneous amplification of three size ranges (73-165 bp; 166-253 bp; >253 bp) from olfactory receptor (OR) genes, with STAT6 as a diploid reference.
- Assay Design:
- Targets multiple OR genes with high sequence conservation.
- Enables absolute quantification via STAT6 reference.
- Procedure:
- Partition cfDNA sample into ~20,000 nanodroplets.
- Amplify with size-specific probes.
- Count positive droplets for each target.
- Data Analysis:
- Calculate ratio of short to medium fragments (73-165 bp / 166-253 bp).
- Healthy controls typically show ratio of 1.0-1.20.
- Elevated ratios indicate higher fragmentation, potentially suggesting tumor origin.
- Validation: Strong correlation with capillary electrophoresis (R²=0.725) and high-throughput sequencing (R²=0.766) [22].
Fragment Size Selection for ctDNA Enrichment
Protocol: Enhancing ctDNA Detection by Fragment Size Selection [21]
- Background: ctDNA fragments are enriched in 90-150 bp range compared to non-mutant cfDNA.
- Method 1: In Vitro Size Selection
- Use microfluidic devices to physically separate shorter DNA fragments.
- Process plasma samples to enrich 90-150 bp fraction.
- Continue with standard NGS library preparation.
- Method 2: In Silico Size Selection
- Perform standard shallow whole-genome sequencing (0.4× coverage).
- Bioinformatically filter aligned reads to retain only those with 90-150 bp insert sizes.
- Performance Metrics:
- t-MAD score: Quantifies copy number alteration detection power.
- Enrichment factor: Ratio of tumor DNA signal after/before size selection.
- Results: >2-fold median enrichment in >95% of cases; >4-fold in >10% of cases [21].
Impact on Chemogenomic Study Outcomes
Pre-analytical Considerations
The significant differences in physical properties between cfDNA and gDNA necessitate distinct handling protocols throughout the research workflow.
Table 3: Pre-analytical Requirements for cfDNA vs. gDNA in NGS Studies
| Parameter | cfDNA-Based NGS | gDNA-Based NGS |
|---|---|---|
| Sample Collection | Plasma from blood collected in specialized tubes (EDTA, Streck, PAXgene) [4] [19] | Tissue biopsies or blood for cellular DNA |
| Processing Time | Critical: within 4h (EDTA) or 96h (Streck) [4] | Less critical; standard tissue preservation |
| Extraction Method | Optimized for low concentrations/small fragments (QIAamp CNA kit) [24] [23] | Standard phenol-chloroform or column-based |
| Quality Assessment | Fragment size analysis (Bioanalyzer, TapeStation) [22] [23]; ddPCR for quantification | Spectrophotometry (A260/280); gel electrophoresis |
| Input Requirements | Often limited (nanograms); may require whole genome amplification | Typically sufficient (micrograms) |
Analytical Performance in NGS Applications
The molecular integrity and fragment size of cfDNA directly impact sequencing library construction and data quality:
- Library Complexity: Fragmented nature of cfDNA reduces library complexity compared to gDNA, potentially affecting mutation detection sensitivity.
- Amplification Bias: Smaller fragment sizes may amplify more efficiently, potentially skewing variant allele frequency measurements.
- Error Rates: cytosine deamination damage in short cfDNA fragments can increase C>T/G>A errors, requiring specialized bioinformatic correction.
- Coverage Uniformity: Nucleosomal protection patterns can create coverage biases across the genome, unlike the more uniform coverage from fragmented gDNA.
The Scientist's Toolkit
Table 4: Essential Research Reagents and Tools for cfDNA Analysis
| Category | Product/Technology | Primary Function | Key Considerations |
|---|---|---|---|
| Blood Collection | PAXgene Blood ccfDNA Tubes [19] | Stabilize cfDNA, inhibit nucleases | Critical for half-life studies; prevents in vitro degradation |
| Blood Collection | Streck Cell-Free DNA BCT Tubes [4] | Stabilize blood cells, preserve cfDNA profile | Enables extended processing windows (up to 96h) |
| Extraction Kits | QIAamp Circulating Nucleic Acid Kit [24] [23] | Optimized recovery of short cfDNA fragments | Higher yields for low-concentration samples |
| Size Analysis | Agilent 2100 Bioanalyzer/TapeStation [22] [23] | Fragment size distribution and quantification | Essential quality control step |
| Quantification | Multiplex ddPCR Assay [22] | Absolute quantification and size distribution | More accurate than fluorometry; detects gDNA contamination |
| Size Selection | Microfluidic Systems [21] | Physical separation of fragment sizes | Enriches ctDNA by selecting 90-150 bp fragments |
The physical and chemical properties of cfDNA—particularly its characteristic fragment size around 167 bp, short half-life of minutes to hours, and distinct molecular integrity patterns—fundamentally differentiate it from gDNA in chemogenomic research applications. These differences necessitate specialized methodologies throughout the experimental workflow, from sample collection through data analysis. Researchers can leverage these property differences to enhance experimental outcomes, such as using size selection to enrich for tumor-derived fragments or employing appropriate stabilization methods to account for rapid clearance. Understanding these core properties enables more informed experimental design, improves data interpretation, and ultimately enhances the reliability of cfDNA-based liquid biopsy approaches in chemogenomic studies and drug development programs.
In the era of precision oncology, molecular profiling of tumors has become indispensable for guiding therapeutic decisions. Traditionally, this profiling has relied on genomic DNA (gDNA) extracted from tumor tissue obtained via invasive biopsies. However, these procedures carry inherent risks, are not always feasible, and often fail to capture the full spatial and temporal heterogeneity of the tumor. The analysis of cell-free DNA (cfDNA)—short fragments of DNA circulating in the bloodstream—presents a transformative, minimally invasive alternative. A critical subset of cfDNA is circulating tumor DNA (ctDNA), which is shed by tumor cells and carries tumor-specific genetic alterations. The clinical significance of ctDNA analysis lies in its ability to provide a real-time, comprehensive snapshot of the tumor's genomic landscape, enabling applications in treatment selection, response monitoring, minimal residual disease (MRD) detection, and tracking the emergence of resistance. This guide objectively compares the performance of ctDNA-based next-generation sequencing (NGS) to traditional gDNA-based tissue testing, framing the discussion within chemogenomic research for drug development professionals and scientists.
Fundamental Concepts: gDNA vs. cfDNA/ctDNA
To appreciate the technical and clinical comparisons, it is essential to understand the fundamental differences between the analyte sources.
Genomic DNA (gDNA) from Tissue Biopsy: Derived from intact tumor cells obtained through a tissue biopsy. This source provides high-quality, high-molecular-weight DNA but represents a single snapshot of a specific lesion at a single point in time. It is susceptible to sampling bias, particularly in heterogeneous tumors, and serial sampling to monitor evolution is challenging [25] [26].
Cell-free DNA (cfDNA) and Circulating Tumor DNA (ctDNA): cfDNA is released into the bloodstream primarily through cellular apoptosis and necrosis; in cancer patients, the fraction derived from tumor cells is termed ctDNA. ctDNA is highly fragmented (~167 bp), has a short half-life (from 16 minutes to several hours), and reflects the molecular characteristics of all tumor subclones across different disease sites, thereby capturing tumor heterogeneity. Its low concentration in early-stage disease (often <0.1% of total cfDNA) presents a significant analytical challenge [25] [26] [27].
The following diagram illustrates the origin and analysis pathways of gDNA and ctDNA.
Performance Comparison: Analytical Sensitivity and Specificity
The analytical performance of ctDNA-NGS assays is a critical focus of research, as it must overcome the challenge of detecting very low VAF mutations amidst a background of wild-type cfDNA. Direct comparative studies and analytical validations provide key performance metrics.
Direct Assay Comparison
A landmark study directly compared five major large-panel (≥500 genes) ctDNA NGS assays using validated reference samples. The results highlight that performance is highly dependent on input DNA quantity and mutation allele frequency [28].
Table 1: Performance of Five ctDNA-NGS Assays on Reference Samples [28]
| Assay | Panel Size | Sensitivity at 0.5% VAF | Sensitivity at 0.1% VAF | Key Technical Factors |
|---|---|---|---|---|
| Assay A | 500 genes | ≥90% | Decreased & Variable | Depth of coverage, background noise |
| Assay B | 600 genes | ≥90% | Decreased & Variable | Depth of coverage, background noise |
| Assay C | 500 genes | ≥90% | Decreased & Variable | Depth of coverage, background noise |
| Assay D | ~500 genes | ≥90% | Decreased & Variable | Depth of coverage, background noise |
| Assay E | ~100 genes | ≥90% | Decreased & Variable | Depth of coverage, background noise |
The study concluded that while all assays demonstrated high sensitivity (≥90%) and reproducibility for mutations at 0.5% or 1.0% VAF with optimal DNA input (30-50 ng), performance decreased dramatically at a 0.1% VAF and/or with lower DNA input (10 ng). The depth of coverage and background noise were identified as critical factors influencing performance [28].
gDNA (Tissue) vs. ctDNA (Plasma) Concordance
Multiple clinical studies have investigated the concordance of mutation profiles between tissue-based gDNA-NGS and plasma-based ctDNA-NGS.
A study of 190 NSCLC patients undergoing concurrent tissue and plasma testing with a 168-gene panel found a high overall concordance of 78.9%. Crucially, in the subset of patients with detectable ctDNA, the concordance rate rose to 91.2%, with plasma-NGS sensitivity reaching 93.5% for single nucleotide variants (SNVs) and short insertions/deletions (indels). However, plasma-NGS was significantly less capable of detecting copy number variations (CNVs) and gene fusions compared to tissue-NGS [29].
Another study in the Netherlands involving 59 advanced NSCLC patients reported a 71.2% concordance between standard-of-care tissue genotyping and ctDNA-NGS. In a minority of cases (3.4%), ctDNA-NGS missed an actionable driver alteration, underscoring that tissue testing remains the gold standard when available [30].
Table 2: Tissue vs. Plasma NGS Concordance in Advanced NSCLC [30] [29]
| Study | Cohort Size | Overall Concordance | Concordance When ctDNA Detectable | Plasma Sensitivity for SNV/Indel | Plasma Weaknesses |
|---|---|---|---|---|---|
| Lin et al. (2023) | 190 | 78.9% | 91.2% | 93.5% | CNVs, Fusions |
| LICA Study (2025) | 59 | 71.2% | N/R | N/R | May miss low-VAF actionable drivers |
Experimental Protocols and Methodologies
Robust and sensitive methodologies are paramount for reliable ctDNA analysis. The following section details the key experimental protocols cited in the performance comparisons.
- Reference Samples: Two sets of reference materials (Seracare Life Sciences) were used. Set one contained 40 mutations relevant to solid tumors; set two contained 23 mutations related to myeloid malignancy. Each set included samples with variant allele frequencies (VAFs) of 1%, 0.5%, 0.125%, and a negative control.
- DNA Input: Vendors were supplied with samples at different DNA concentrations (e.g., 10 ng and 30/50 ng) to evaluate input impact.
- Testing Procedure: Each vendor processed the samples according to their proprietary protocols for library preparation, target enrichment (hybrid capture for most), and sequencing.
- Data Analysis: A minimum of 4 variant-supporting reads was required for a positive call. Sensitivity was defined as the number of reference mutations detected divided by the total number of expected mutations.
- Assay: TruSight Oncology 500 ctDNA assay.
- Input: The primary validation used 30 ng of cfDNA.
- Performance Metrics: The assay demonstrated high sensitivity and low variability for SNVs, indels, and fusions down to 0.5% VAF. Sensitivity was considerably lower, and variability increased, at reduced input amounts (20, 15, and 5 ng) and VAFs below 0.5%.
- Sample Collection: Blood collected in Roche Cell-Free DNA collection tubes, processed within five days.
- ctDNA Isolation: Using the QIAamp Circulating Nucleic Acid kit.
- Library Prep & Target Enrichment: Used an in-house developed hybrid-capture probe set (117 kb, covering 45 genes) with Twist Library Preparation Kit. Incorporated Unique Molecular Identifiers (UMIs) for error correction.
- Sequencing & Analysis: Sequencing on Illumina NovaSeq6000. Bioinformatic pipelines (GATK Mutect2) were used with stringent filters, including a requirement that the VAF be >20 times higher than the average VAF in healthy control samples to reduce background noise.
The Scientist's Toolkit: Essential Reagents and Materials
Successful ctDNA analysis requires careful selection of reagents and materials throughout the workflow. The table below details key solutions and their functions.
Table 3: Essential Research Reagent Solutions for ctDNA-NGS
| Reagent / Material | Function / Application | Examples / Key Features |
|---|---|---|
| Blood Collection Tubes | Stabilizes blood cells to prevent lysis and genomic DNA contamination during transport and storage. | Roche Cell-Free DNA BCTs [30], Streck BCTs [31]. Roche tubes demonstrated superior prevention of WBC lysis over 14 days [31]. |
| cfDNA Extraction Kits | Isolate and purify short-fragment cfDNA from plasma. | QIAamp Circulating Nucleic Acid Kit (Qiagen) [30]. Optimized for low-concentration, fragmented DNA. |
| Library Prep Kits | Prepare NGS libraries from low-input, fragmented cfDNA. | Twist Library Preparation Kit (Twist Biosciences) [30]. Often used with UMIs for error correction. |
| Target Enrichment Panels | Hybrid-capture or amplicon-based panels to enrich for cancer-related genes. | Custom probe sets (e.g., Twist Biosciences) [30]. Panel sizes range from ~100 to >500 genes [28] [32]. |
| UMI Adapters | Molecular barcodes ligated to DNA fragments pre-amplification to distinguish true mutations from PCR/sequencing errors. | xGEN dual-index UMI adapters (Integrated DNA Technologies) [30]. Critical for achieving high specificity in low-VAF detection. |
Clinical Applications and Limitations
The primary clinical value of ctDNA analysis lies in its dynamic monitoring capabilities, which complement the more comprehensive but static profile from a tissue biopsy.
Key Clinical Applications
- Treatment Monitoring and Response Assessment: ctDNA levels can serve as a highly sensitive metric for tumor burden. A decrease or clearance of ctDNA (molecular response) often precedes radiographic response, while a rise can indicate emerging resistance, sometimes months before clinical progression [25].
- Minimal Residual Disease (MRD) Detection: Following curative-intent therapy, the presence of ctDNA is a highly specific indicator of residual disease and a powerful predictor of future relapse, offering a significant advantage over imaging, which cannot detect microscopic disease [25] [26].
- Identifying Resistance Mechanisms: Serial ctDNA analysis can uncover the molecular drivers of treatment resistance (e.g., EGFR T790M mutation after first-line EGFR inhibitor therapy), allowing for timely intervention and therapy modification [25].
- Comprehensive Genotyping when Tissue is Unavailable: For patients where tissue biopsy is infeasible or insufficient, ctDNA analysis can identify actionable genomic alterations to guide therapy [30] [29].
Current Limitations and Challenges
- Lower Sensitivity for Certain Alterations: As noted in performance comparisons, ctDNA-NGS has reduced sensitivity for detecting copy number variations (CNVs) and gene fusions compared to tissue-NGS [29].
- False Negatives and Low Shedding: Not all tumors shed sufficient DNA into the bloodstream, leading to false-negative results, particularly in early-stage, low-burden, or certain tumor types [25] [29].
- Background Noise and Clonal Hematopoiesis: Sequencing artifacts and mutations originating from clonal hematopoiesis (CH) of indeterminate potential can be misclassified as tumor-derived, leading to false positives. Specialized bioinformatic filters and sequencing of matched white blood cells can help mitigate this [30].
- Lack of Standardization: Differences in pre-analytical variables (collection tubes, processing time), analytical methods (panels, UMIs), and bioinformatic pipelines pose challenges for cross-assay comparisons and universal clinical adoption [25] [30].
The integration of cfDNA and ctDNA analysis into the oncology landscape represents a paradigm shift from static, invasive biopsies to dynamic, minimally invasive disease monitoring. For researchers and drug development professionals, the choice between gDNA-based and cfDNA-based NGS is not a binary one but rather a strategic decision based on the clinical or research question.
gDNA from tissue biopsies remains the gold standard for initial diagnosis and provides the most comprehensive genomic profile, including reliable detection of CNVs and fusions. ctDNA from liquid biopsies excels in longitudinal monitoring, assessing tumor heterogeneity, detecting MRD, and profiling tumors when tissue is unavailable.
Future directions in the field will focus on overcoming current limitations. This includes standardizing pre-analytical and analytical protocols, improving the sensitivity for all variant types through techniques like duplex sequencing [25], and exploring the potential of long-read sequencing technologies (e.g., Oxford Nanopore) to simultaneously capture genetic, epigenetic, and fragmentomic information from a single cfDNA molecule [27]. For chemogenomic studies, the ability to non-invasively track the evolution of tumor genomes under therapeutic pressure will be invaluable for understanding drug resistance and developing next-generation targeted therapies.
gDNA as a Static Snapshot vs. cfDNA as a Dynamic Monitor of Disease
In chemogenomic studies and cancer drug development, the choice of genomic material for analysis is paramount. Genomic DNA (gDNA) from tissue biopsies and cell-free DNA (cfDNA) from liquid biopsies offer fundamentally different perspectives on the disease. gDNA provides a static, historical snapshot of a tumor's genotype from a single site at a single point in time. In contrast, cfDNA analysis offers a dynamic, real-time monitor that captures the evolving genomic landscape of the entire disease burden. This comparison guide objectively examines the performance characteristics, experimental protocols, and clinical applications of these complementary approaches within the context of next-generation sequencing (NGS), providing researchers with the data necessary to inform their study designs.
Performance Comparison: Analytical Characteristics
The intrinsic biological properties of gDNA and cfDNA directly translate to distinct performance characteristics in analytical workflows. The table below summarizes key comparative metrics.
Table 1: Performance Characteristics of gDNA and cfDNA in NGS Analysis
| Characteristic | gDNA (Tissue Biopsy) | cfDNA (Liquid Biopsy) |
|---|---|---|
| Sample Type | Formalin-Fixed Paraffin-Embedded (FFPE) or fresh frozen tissue [33] | Plasma derived from peripheral blood [33] [34] |
| Representativeness | Single-site, subject to spatial heterogeneity [33] | Cross-sectional, captures spatial (multi-site) heterogeneity [35] |
| Temporal Resolution | Single time point; repeat sampling difficult [33] | Enables repeated sampling for longitudinal monitoring [35] |
| Turnaround Time (Typical) | ~60 days (for re-biopsy) [33] | ~29 days [33] |
| DNA Fragmentation | Highly fragmented (especially FFPE), variable size [33] | Regularly fragmented (~167 bp peak), nucleosome-derived [2] [34] |
| Limit of Detection (VAF) | ~5% (for standard NGS panels) [36] | 0.01% - 0.08% (with high-depth NGS/ddPCR) [36] [34] |
| Analytical Sensitivity | High for high tumor purity samples | Dependent on ctDNA fraction (often 0.01%-10%) [35] [34] |
| Primary Clinical Use | Gold standard for diagnosis and initial genomic profiling [33] | Identification of actionable mutations, therapy monitoring, MRD detection [35] |
Beyond these core characteristics, the difference in dynamic monitoring is profound. One study noted that archival tissue "might not represent the current malignancy due to clonal evolution," a limitation directly addressed by the serial assessment capability of cfDNA [33]. Furthermore, while tissue biopsies are unusable in 20-30% of non-small cell lung cancer patients, cfDNA profiling provides a feasible alternative [33].
Experimental Data: Supporting Evidence from Clinical Studies
Empirical data from clinical studies underscores the practical performance differences summarized above.
Table 2: Comparative Performance Data from Analytical Studies
| Study Context | gDNA Performance | cfDNA Performance | Key Finding |
|---|---|---|---|
| Rectal Cancer (ddPCR vs NGS) [36] | N/A | ddPCR: 58.5% (24/41) detection in baseline plasma.NGS Panel: 36.6% (15/41) detection (p=0.00075). | ddPCR showed a significantly higher detection rate for ctDNA in localized rectal cancer compared to an NGS panel. |
| Feasibility in Phase I Setting [33] | Turnaround: Median 60 days (n=6). | Turnaround: Median 29 days (n=24). | Selected cancer-associated alterations were identified in 70% (31/44) of patients via cfDNA, primarily by WES. |
| Cancer Phenotyping (UW Cohort) [2] | N/A | Normalized depth across all exons achieved an average AUROC of 0.943 for predicting cancer types/subtypes. | Fragmentomics patterns from targeted cfDNA panels enable accurate cancer phenotyping. |
| Healthy Individual Screening [34] | N/A | Pathogenic cancer mutations detected in donors up to 10 years before clinical diagnosis. | Demonstrated the technical feasibility of cfDNA analysis for early detection, with a LOD of 0.08% VAF. |
A critical finding from a 2025 study is that fragmentomics analysis, which infers epigenetic and transcriptional data from cfDNA fragmentation patterns, can be successfully applied to the targeted sequencing panels already in clinical use, without requiring whole-genome sequencing [2]. This significantly broadens the potential applications of existing clinical datasets.
Experimental Protocols: Methodologies for gDNA and cfDNA NGS
gDNA Workflow from Tissue Biopsies
The standard protocol for gDNA-based NGS begins with tissue acquisition.
- Tissue Collection and DNA Extraction: A tumor specimen is obtained via surgical resection or core needle biopsy. For archival material, DNA is extracted from 4-5 sections of 10 µm thick FFPE tissue after deparaffinization using a column-based recovery kit [34]. DNA quantity is assessed using a fluorometer (e.g., Qubit).
- NGS Library Preparation: Depending on the assay, 5-40 ng of input DNA is used. For targeted panels (e.g., Oncomine Solid Tumor or Focus Assay), libraries are prepared through a series of amplification steps to attach sequencing adapters and sample barcodes. The resulting libraries are purified using bead-based cleanup [34].
- Sequencing and Analysis: Libraries are quantified by qPCR, diluted to a standard concentration, and sequenced. Bioinformatic analysis pipelines are used for variant calling, with a typical detection threshold around 5% Variant Allele Frequency (VAF) for standard panels [36].
cfDNA Workflow from Liquid Biopsies
The cfDNA workflow emphasizes sensitivity and handling of low-input material.
- Blood Collection and Plasma Separation: Blood is drawn into specialized collection tubes (e.g., Streck Cell-Free DNA BCT or K2EDTA tubes). The plasma fraction is separated from cellular components by two consecutive centrifugation steps (e.g., 1600 x g for 30 minutes) [34]. Plasma is aliquoted and stored at -80°C.
- cfDNA Extraction and QC: cfDNA is extracted from plasma volumes (0.4-5.5 mL) using a magnetic bead-based nucleic acid isolation kit. The eluted cfDNA is quantified by fluorometry. Quality control is critical and is performed using a High Sensitivity microfluidic system to confirm a dominant fragment size peak between 140-200 bp [34].
- Ultra-Sensitive NGS Library Preparation: For plasma cfDNA, NGS libraries are prepared from a small input (e.g., 2.5-105.5 ng) using molecular barcoding techniques. A two-cycle multiplex touch-down PCR first amplifies target regions and introduces unique molecular identifiers. After a bead-based cleanup, a second PCR (e.g., 18 cycles) adds sequencing adapters and sample barcodes [34]. This method allows for a limit of detection as low as 0.08% VAF [34].
- Sequencing and Bioinformatic Analysis: Libraries are quantified, pooled, and sequenced at high depth (often >50,000x coverage). Bioinformatics pipelines use the molecular barcodes to error-correct and accurately call variants at very low frequencies.
The following diagram illustrates the core procedural differences and logical relationship between the two workflows:
The Scientist's Toolkit: Essential Research Reagents and Materials
Successful implementation of gDNA and cfDNA NGS requires a suite of specialized reagents and tools.
Table 3: Essential Research Reagent Solutions for gDNA and cfDNA NGS
| Item | Function/Description | Example Use Case |
|---|---|---|
| Streck Cell-Free DNA BCT Tubes | Blood collection tubes that stabilize nucleated blood cells to prevent background gDNA release, preserving the native cfDNA profile. | Preserving cfDNA fragmentomics patterns during blood sample transport and storage [36] [34]. |
| Magnetic Bead-based cfDNA Kits | (e.g., MagMax Cell-Free Total Nucleic Acid Isolation Kit). Optimized for high-efficiency isolation of short, low-concentration cfDNA fragments from plasma. | Extracting high-quality cfDNA for ultra-sensitive downstream NGS or ddPCR applications [34]. |
| Molecular Barcoding Kits | (e.g., Oncomine Pan-Cancer Cell-Free Assay). NGS library prep kits that incorporate unique molecular identifiers (UMIs) to tag original DNA molecules for error correction. | Achieving a low limit of detection (0.01%-0.08% VAF) by distinguishing true low-frequency variants from sequencing errors [34]. |
| Targeted NGS Panels | (e.g., Ion AmpliSeq Cancer Hotspot Panel v2). Focused gene panels enabling deep sequencing for variant discovery in specific genomic regions. | Profiling somatic alterations in tumor gDNA or cfDNA for hotspot mutations in 50+ genes [36]. |
| Droplet Digital PCR (ddPCR) | An absolute quantification method that partitions samples into thousands of droplets for endpoint PCR, detecting rare mutations with high sensitivity. | Ultra-sensitive validation and tracking of specific known mutations in cfDNA [36] [35]. |
| Agilent High Sensitivity D1000 ScreenTape | A microfluidic electrophoresis system used to quality control cfDNA extracts, confirming the characteristic ~170 bp fragmentation pattern. | QC step to ensure cfDNA sample integrity before proceeding to costly NGS library preparation [34]. |
The choice between gDNA and cfDNA is not a matter of selecting a superior technology, but of applying the right tool for the specific research question. gDNA from tissue biopsies remains the unparalleled static snapshot, providing the foundational histopathological and molecular diagnosis. However, for a dynamic monitor of disease evolution, treatment response, and resistance mechanisms, cfDNA is transformative. Its capacity for non-invasive, repeated sampling captures the spatiotemporal heterogeneity of cancer, making it an indispensable tool in modern chemogenomic research and the development of personalized cancer therapies. The future lies in the integrated interpretation of both the detailed, static landscape from gDNA and the evolving, systemic view from cfDNA.
From Bench to Biomarker: Practical NGS Workflows and Chemogenomic Applications
In the realm of chemogenomic studies and precision medicine, next-generation sequencing (NGS) has become an indispensable tool for elucidating disease mechanisms and identifying therapeutic targets. The choice of source material—genomic DNA (gDNA) from whole blood or cell-free DNA (cfDNA) from plasma—fundamentally shapes experimental design, analytical capabilities, and clinical applicability. Whole blood provides a stable source of germline genetic information through gDNA, while plasma offers a dynamic, minimally invasive window into pathologic states through cfDNA, particularly circulating tumor DNA (ctDNA) in oncology [12]. This guide objectively compares these two approaches by synthesizing current experimental data and methodologies, providing researchers with a evidence-based framework for selecting the appropriate sample type for their specific NGS applications in drug development and biomarker discovery.
Fundamental Characteristics and Experimental Workflows
The divergence between gDNA and cfDNA analysis begins at the biological level and extends throughout the entire NGS workflow. gDNA represents intact genomic material extracted from white blood cells, providing a comprehensive blueprint of an individual's hereditary genetic makeup. In contrast, cfDNA consists of short, fragmented DNA molecules (typically ~167 bp) released into the bloodstream primarily through cellular apoptosis and necrosis, with a minor contribution from active secretion [12]. In cancer patients, a subset of cfDNA originates from tumors (ctDNA), carrying genetic, epigenetic, and fragmentomic information about the malignancy.
Table 1: Fundamental Characteristics of gDNA and cfDNA
| Characteristic | gDNA from Whole Blood | cfDNA from Plasma |
|---|---|---|
| Primary Source | Leukocytes | Mixed cellular sources (apoptosis/necrosis) |
| Typical Fragment Size | High molecular weight, intact | ~167 bp dominant peak |
| Half-life | Stable long-term with proper storage | 16 minutes to several hours [12] |
| Representative Information | Germline genetics | Somatic alterations, tumor heterogeneity |
| Key Preparative Step | Cell lysis and DNA precipitation | Centrifugation for plasma separation |
The experimental workflows for processing these sample types differ significantly, particularly in the pre-analytical phase. Proper sample handling is critical for both, but requires distinct optimization strategies.
Workflow Diagram: gDNA vs cfDNA NGS Analysis
The following diagram illustrates the key procedural differences in processing whole blood for gDNA analysis versus plasma for cfDNA analysis:
Detailed Methodological Considerations
Whole Blood Processing for gDNA Extraction
Effective gDNA extraction from whole blood requires careful sample stabilization and processing. Blood samples should be collected in EDTA or specialized DNA stabilization tubes and processed within 24-48 hours when stored at 4°C. For long-term storage, freezing at -80°C is recommended [37]. The initial centrifugation step typically occurs at 1,900×g for 10 minutes at 4°C to separate plasma from the cellular fraction [38]. The buffy coat layer containing leukocytes is then collected for DNA extraction.
Mechanical homogenization methods, such as bead-based systems (e.g., Bead Ruptor Elite), can enhance DNA recovery from challenging starting materials while minimizing shearing [37]. Following extraction, gDNA quality control should assess concentration (via fluorometry), purity (A260/A280 ratio ~1.8), and integrity (via gel electrophoresis or automated systems like Agilent TapeStation) [39] [40]. Intact gDNA should show a high molecular weight band without smearing.
Plasma Processing for cfDNA Isolation
cfDNA analysis demands rigorous pre-analytical conditions to prevent contamination by cellular genomic DNA. Blood samples require double centrifugation: first at 1,900×g for 10 minutes at 4°C to separate plasma from blood cells, followed by a second centrifugation at 16,000×g for 10 minutes to remove remaining cellular debris [38]. Plasma should be frozen at -80°C if not processed immediately, with avoidance of repeated freeze-thaw cycles.
Specialized cfDNA extraction kits employing silica-membrane technology are recommended to recover short fragments efficiently. For library preparation, specific optimizations are needed for short cfDNA fragments, including adjusted bead-to-sample ratios (typically increased to 1.8×) during clean-up steps to enhance recovery of molecules <200 bp [12]. Quality assessment should include fragment size analysis (peak ~167 bp) and quantification using sensitive fluorescence-based methods compatible with low DNA concentrations.
Diagnostic Performance and Analytical Capabilities
The functional differences between gDNA and cfDNA analysis become particularly evident when examining their diagnostic performance across clinical applications. Multiple studies have systematically compared the sensitivity, specificity, and limitations of each approach in various disease contexts.
Table 2: Diagnostic Performance Comparison in Clinical Studies
| Application | Sample Type | Sensitivity | Specificity | Key Findings | Source |
|---|---|---|---|---|---|
| Febrile Illness in Immunocompromised Patients | Plasma cfDNA (mNGS) | 84.4% (positivity rate) | Lower specificity | Higher false positives; multiple pathogens detected in 68.5% of positive samples | [38] |
| Febrile Illness in Immunocompromised Patients | Blood Cell gDNA (mNGS) | 46.9% (positivity rate) | Higher specificity | Causative pathogens identified in 76.7% of mNGS-positive cases | [38] |
| Periprosthetic Joint Infection | mNGS (various sources) | 89% | 92% | Superior sensitivity for infection detection | [41] |
| Periprosthetic Joint Infection | Targeted NGS (various sources) | 84% | 97% | Higher specificity for confirming infection | [41] |
| Advanced NSCLC (EGFR mutations) | Tissue gDNA | 93% | 97% | High accuracy for point mutations | [42] |
| Advanced NSCLC (EGFR mutations) | Liquid biopsy cfDNA | 80% | 99% | Effective for point mutations but limited sensitivity for fusions | [42] |
The data reveals a consistent pattern: plasma cfDNA analyses generally offer higher sensitivity but may sacrifice specificity, while cellular gDNA approaches provide more specific but less sensitive detection. This trade-off has significant implications for clinical and research applications.
Multiomics Analytical Potential
Beyond simple pathogen detection or mutation identification, both sample types offer distinct advantages for multiomics approaches:
gDNA from Whole Blood provides comprehensive germline information including:
- Constitutional genetic variants and polymorphisms
- Structural variants and copy number variations
- Mitochondrial DNA sequences
- Stable genetic markers for pharmacogenomics
cfDNA from Plasma enables multidimensional analysis through:
- Fragmentomics: Non-random fragmentation patterns can infer gene expression and chromatin organization [2]. Tumor-derived cfDNA shows different fragmentation profiles than healthy cfDNA.
- Methylation Analysis: Cancer-specific methylation patterns in ctDNA serve as biomarkers for early detection and tumor typing [12]. Nanopore sequencing allows direct methylation detection without bisulfite conversion.
- Copy Number Variations (CNVs): Somatic CNVs in ctDNA can monitor tumor evolution and therapy response [12].
- Combined Approaches: Integrating fragmentomics with mutation detection improves cancer phenotyping accuracy in targeted panels [2].
Experimental Protocols for Comparative Studies
Protocol: Comparative Analysis of Pathogen Detection in Febrile Illness
This protocol is adapted from a 2024 study comparing plasma cfDNA and blood cell gDNA for pathogen detection in immunocompromised children [38].
Sample Collection and Processing:
- Collect 2-5 mL whole blood in EDTA tubes within 6 hours of fever onset
- Centrifuge at 1,900×g for 10 minutes at 4°C
- Carefully transfer supernatant (plasma) to a new tube without disturbing the buffy coat
- Aliquot plasma for cfDNA extraction
- Transfer the buffy coat layer to a separate tube for cellular gDNA extraction
Nucleic Acid Extraction:
- Plasma cfDNA: Extract using a commercial cfDNA kit with a minimum input of 1-3 mL plasma
- Blood Cell gDNA: Perform host depletion using differential lysis before DNA extraction [38]
Library Preparation and Sequencing:
- Construct libraries using compatible kits for cfDNA or gDNA
- Sequence on Illumina platforms (≥20 million reads per sample)
- For blood cell gDNA, include steps to enrich for microbial DNA
Bioinformatic Analysis:
- Quality control of raw reads (FastQC)
- Remove human sequences by alignment to hg19
- Classify non-human reads using Kraken2 against a curated pathogen database
- Apply threshold filters: RPTM ≥3 for viruses, ≥8 for bacteria/fungi [38]
Protocol: Fragmentomics Analysis from Targeted cfDNA Sequencing
This protocol enables extraction of fragmentomic features from targeted cfDNA sequencing data, adapted from a 2025 Nature Communications study [2].
Wet Lab Procedures:
- Extract cfDNA from 3-10 mL plasma using optimized bead-based cleanups (1.8× ratio)
- Prepare libraries using targeted cancer gene panels (e.g., 55-822 gene panels)
- Sequence to high depth (>3000×)
Computational Analysis:
- Process raw sequencing data through standard alignment pipelines
- Calculate multiple fragmentomics metrics:
- Normalized fragment depth across all exons
- Shannon entropy of fragment size distribution
- End motif diversity score (MDS)
- Proportion of small fragments (<150 bp)
- Fragment size distribution binnings
- Build predictive models using GLMnet elastic net with 10-fold cross-validation
- Validate performance via AUROC for cancer type classification
Key Finding: Normalized fragment read depth across all exons provides the best overall performance for cancer phenotyping (AUROC: 0.943-0.964) compared to first-exon only metrics [2].
Essential Research Reagent Solutions
Successful implementation of gDNA and cfDNA NGS requires specialized reagents and tools optimized for each sample type.
Table 3: Essential Research Reagents and Tools
| Category | Product/Technology | Specific Application | Key Features |
|---|---|---|---|
| Nucleic Acid Extraction | Bead Ruptor Elite | Mechanical homogenization for tough samples | Precise control of speed, cycle duration, temperature; minimizes DNA shearing [37] |
| Nucleic Acid Extraction | Silica-membrane cfDNA kits | Optimized cfDNA isolation | Enhanced recovery of short fragments; removal of contaminants |
| Library Preparation | ONT SQK-LSK114 | Nanopore cfDNA sequencing | Direct methylation detection; PCR-free option; long-read capabilities [12] |
| Library Preparation | Illumina DNA Prep | gDNA library preparation | Efficient fragmentation and adapter ligation; high complexity libraries |
| Quality Control | Agilent TapeStation | Nucleic acid integrity | RNA Integrity Number (RIN); DNA integrity assessment [39] |
| Quality Control | Fragment Analyzer | cfDNA size distribution | Precise sizing of short fragments; quantification of tumor-derived fragments |
| Target Enrichment | Commercial targeted panels (Guardant360, FoundationOne) | ctDNA mutation detection | Clinically validated; optimized for variant calling in background of wild-type DNA [2] |
| Bioinformatic Tools | FastQC | Raw read quality control | Per base sequence quality; adapter content; GC distribution [39] |
| Bioinformatic Tools | Kraken2 | Taxonomic classification | Rapid metagenomic analysis; pathogen identification [38] |
The choice between whole blood gDNA and plasma cfDNA for NGS applications represents a fundamental strategic decision in experimental design for chemogenomic studies. Whole blood gDNA provides stable, comprehensive germline genetic information ideal for constitutional variant analysis, pharmacogenomics, and establishing genetic baselines. Its higher specificity in pathogen detection makes it valuable for confirmatory diagnostics. Conversely, plasma cfDNA offers a dynamic, minimally invasive window into current pathological states, particularly in oncology, with superior sensitivity for detecting active infections and tumor-derived alterations. The emerging field of cfDNA fragmentomics further expands its utility beyond mutation detection to include epigenetic and transcriptomic inference.
Researchers should select whole blood gDNA when analyzing hereditary variants, requiring high specificity, or working with stable genetic markers. Plasma cfDNA is preferable for monitoring dynamic processes, detecting minimal residual disease, capturing tumor heterogeneity, or when minimally invasive serial sampling is needed. Future directions point toward integrated approaches that leverage both sample types to provide complementary information, as well as technological advances in long-read sequencing and multiomics analysis that will further enhance the informational yield from each source.
In chemogenomic studies, next-generation sequencing (NGS) has become an indispensable tool for understanding drug mechanisms and cellular responses. The choice between genomic DNA (gDNA) and cell-free DNA (cfDNA) as a sequencing source presents researchers with distinct technical challenges, particularly during library preparation. While gDNA from white blood cells has traditionally been the cornerstone of genomic investigations, cfDNA from bodily fluids is increasingly recognized as a valuable biomarker that reflects physiological and pathological states [43]. The nuanced handling of GC-bias and fragment length distribution during library preparation represents a pivotal factor determining the success of downstream applications, from variant calling to nucleosome profiling.
This guide provides a comprehensive comparison of library preparation strategies for managing these technical variables, with a specific focus on their impact within chemogenomic research. We present structured experimental data and methodological frameworks to empower researchers in selecting and optimizing protocols that ensure data integrity and maximize the unique informational content of their cfDNA samples.
A direct comparison of gDNA and cfDNA from the same individuals reveals both consistencies and critical technical divergences that must be addressed during library preparation. At equivalent effective sequencing depths (~37x), both DNA types demonstrate highly comparable quality metrics, allele frequency spectra, population structure, and genomic association results [43]. This foundational consistency underscores the reliability of cfDNA for genetic analyses.
However, key technical differences directly impact library preparation requirements:
- Fragmentation Origin: gDNA requires in vitro fragmentation (mechanical or enzymatic) during library prep, whereas cfDNA is naturally pre-fragmented in vivo (~167 bp) [44].
- Input Material: cfDNA samples typically yield minute quantities (5-10 ng/mL of plasma) [44], demanding kits compatible with low-input protocols.
- Duplication Rates: cfDNA demonstrates higher duplication rates, leading to lower effective sequencing depth after duplicate removal [43].
- Coverage Bias: Significant depth differences between cfDNA and gDNA are predominantly observed in centromeric regions [43].
These inherent differences necessitate tailored approaches for cfDNA library construction, particularly concerning bias mitigation.
Table 1: Core Characteristics of gDNA vs. cfDNA in Sequencing
| Characteristic | gDNA (White Blood Cells) | cfDNA (Blood Plasma) |
|---|---|---|
| Physical State | Long, complete double-helix strands [43] | Short, fragmented DNA (~167 bp) [44] |
| Fragmentation | In vitro (sonication/enzymatic) during prep | In vivo (apoptosis, necrosis) prior to extraction |
| Typical Input | Micrograms (e.g., 100-1000 ng) [45] | Nanograms (e.g., 1-100 ng) [45] |
| Variant Detection | Identifies ~100K more SNPs than cfDNA [43] | High genotype concordance with gDNA [43] |
| Primary Challenge | Uniform coverage and fragmentation | GC-bias correction; utilizing fragment length signatures |
The GC-Bias Challenge in cfDNA Library Preparation
GC bias describes the dependence between fragment count (read coverage) and GC content, which can dominate the genuine biological signal in analyses measuring fragment abundance [46]. This bias manifests as a unimodal curve where both GC-rich and AT-rich fragments are underrepresented in sequencing results [46]. In the context of cfDNA, this bias is particularly problematic for two reasons: it complicates copy number estimation, and it can obscure the subtle fragmentation patterns that are informative for cancer detection and nucleosome profiling [47] [48].
The underlying mechanisms of GC bias are rooted in the library preparation process itself. PCR amplification is identified as a major contributor, as fragments with extreme GC content amplify less efficiently [46] [49]. Furthermore, the GC content of the entire DNA fragment, not just the sequenced read, influences final coverage counts [46]. This effect varies between samples and even between different fragment lengths within a single sample, creating a complex bias landscape that requires sophisticated correction methods [48].
Experimental Data on GC-Bias Correction Methods
Recent methodological advances have produced specialized tools for GC-bias correction in cfDNA data. GCfix represents one such approach, developed following an in-depth analysis of cfDNA GC bias at the region and fragment length levels [47]. This method generates correction factors, tagged BAM files, and corrected coverage tracks, outperforming existing methods on two orthogonal performance metrics: (1) comparing the fragment count density distribution of GC content between expected and corrected samples, and (2) evaluating coverage profile improvement post-correction [47].
The Griffin framework implements a different strategy, employing a GC correction procedure tailored to variable cfDNA fragment sizes [48]. This approach computes genome-wide fragment-based GC bias for each sample, then reweights fragment midpoint coverage at sites of interest to remove these biases. The method has demonstrated significant improvements in nucleosome profiling, with correlations between central coverage at transcription factor binding sites and tumor fraction strengthening substantially after GC correction (e.g., for blood-specific TF LYL1, Pearson's r improved from 0.41 to 0.63) [48].
Table 2: Comparison of GC-Bias Correction Methods for cfDNA
| Method | Core Principle | Input Data | Key Advantage | Demonstrated Outcome |
|---|---|---|---|---|
| GCfix [47] | Fragment length-specific GC correction | WGS cfDNA data | Fast and accurate; works across diverse coverages | Outperforms existing methods on fragment count density and coverage profile metrics |
| Griffin Framework [48] | Fragment-based GC bias correction per sample; reweights midpoint coverage | ULP-WGS/WGS cfDNA data | Optimized for nucleosome profiling; suitable for ULP-WGS (0.1x) | Strengthened correlation between TFBS coverage and tumor fraction (e.g., r=0.41 to 0.63) |
| Benjamini & Speed Method [46] | Global expected coverage per fragment length/GC; assigns weights | Genomic DNA sequencing data | Foundational model for full-fragment GC bias correction | Inspired specialized cfDNA methods; identifies PCR as primary bias source |
Diagram 1: GC bias in cfDNA analysis arises from multiple sources during library preparation, particularly PCR amplification. It creates a unimodal coverage curve and can be addressed through both computational correction tools and optimized wet-lab protocols.
Fragment Length as an Informative Biomarker
Beyond its technical challenges, fragment length in cfDNA represents a rich source of biological information, particularly in oncology applications. Circulating tumor DNA (ctDNA) demonstrates distinct fragment length signatures compared to background cfDNA from healthy cells [50]. In xenograft models, human ctDNA in rat plasma derived from glioblastoma and hepatocellular carcinoma cells showed a shorter principal fragment length than the background rat cfDNA (134-144 bp vs. 167 bp, respectively) [50]. This size difference provides a potential mechanism for enriching the ctDNA fraction through experimental or bioinformatic size selection.
The fragment length distribution of cfDNA can reveal nucleosome positioning and chromatin organization of the cells of origin. When DNA is released into circulation through cell death, it is protected from degradation by nucleosomes, resulting in a fragmentation pattern that reflects the epigenetic state of source cells [48] [51]. Advanced computational methods like Non-Negative Matrix Factorization (NMF) can deconvolute fragment length distributions to identify distinct signatures and estimate their relative contributions in a sample [51]. In metastatic castration-resistant prostate cancer, one NMF-derived signature recapitulated known tumor features including left skew, increased 10 bp periodicity, and an enlarged second peak [51].
Experimental Protocol: Fragment Length Signature Analysis
Sample Preparation and Sequencing:
- Collect plasma from patients and healthy controls, followed by cfDNA extraction using standardized kits (e.g., QIAsymphony DSP Circulating DNA Kit) [44].
- Prepare sequencing libraries using kits compatible with low-input cfDNA (e.g., ThruPLEX Plasma-Seq, SureSelect XT HS2) [44].
- Perform shallow whole-genome sequencing (0.5-1x coverage) or targeted sequencing on Illumina platforms [51].
Bioinformatic Processing:
- Align sequencing reads to the reference genome using aligners optimized for short fragments (e.g., BWA) [43] [46].
- Calculate fragment lengths from aligned read pairs based on outer coordinates [51].
- Construct a fragment length histogram for each sample, with bins for each fragment length [51].
NMF Analysis:
- Normalize the fragment count matrix such that each sample's counts sum to one [51].
- Apply Non-Negative Matrix Factorization to the normalized matrix, specifying the number of expected components (sources) [51].
- Interpret resulting signatures: one component typically represents the healthy background profile, while others correspond to tumor-derived or tissue-specific profiles [51].
- Validate signatures using orthogonal methods, such as comparing with fragment length distributions of mutation-bearing fragments [51].
Library Preparation Kit Performance Comparison
The choice of library preparation kit significantly impacts data quality and feature extraction from cfDNA. Different kits exhibit variations in sequencing data properties, including the fraction of unmapped reads, mitochondrial reads, GC content, and mismatch rates [44]. These technical differences can confound biological interpretations if not properly accounted for.
Recent comparative studies have evaluated multiple library preparation methods for their performance with cfDNA samples. Key considerations include:
- Input Requirements: Many third-party kits now support incredibly low input amounts (as little as 1 ng or less), essential for cfDNA applications [45].
- PCR vs. PCR-Free Protocols: PCR-free kits reduce amplification bias and provide increased coverage across challenging genomic regions but typically require higher DNA input [45] [49].
- Fragmentation Method: Enzymatic fragmentation-based kits offer quicker workflows and greater input flexibility compared to sonication or tagmentation methods [52].
Table 3: Library Preparation Kits for cfDNA Applications
| Kit Name | Supplier | Input Range | PCR Requirement | Key Features | Best Suited For |
|---|---|---|---|---|---|
| Illumina DNA PCR-Free Prep [45] | Illumina | 25-300 ng | No | 1.5h protocol; 450bp insert size | De novo assembly, WGS |
| xGen ssDNA & Low-Input DNA Library Prep Kit [45] | Integrated DNA Technologies | 10pg-250ng | Yes | Specialized for degraded DNA/ssDNA | Low-quality, rare samples |
| SureSelect XT HS2 [44] | Agilent | 10-200 ng | Yes | Dual sample barcodes; easy capture steps | Targeted sequencing |
| NEBNext Enzymatic Methyl-seq [44] | New England Biolabs | Varies | Yes | Preserves methylation information | Multi-omics studies |
| Kapa HyperPrep [44] | Roche | Varies | Yes | Broadly used in research community | General cfDNA WGS |
The Scientist's Toolkit: Essential Reagents and Software
Successful cfDNA analysis requires both specialized laboratory reagents and bioinformatic tools. The following table details key resources for implementing robust cfDNA library preparation and analysis workflows.
Table 4: Essential Resources for cfDNA Library Preparation and Analysis
| Category | Item | Function | Example Products/Software |
|---|---|---|---|
| Laboratory Reagents | cfDNA Extraction Kit | Isolves cell-free DNA from plasma/serum | QIAsymphony DSP Circulating DNA Kit [44] |
| Library Prep Kit | Prepares sequencing libraries from cfDNA | Illumina DNA Prep, ThruPLEX Plasma-Seq, xGen kits [45] [44] | |
| Size Selection Beads | Selects fragments by size (e.g., for ctDNA enrichment) | SPRI beads [50] | |
| UMI Adapters | Unique Molecular Identifiers for error correction | Integrated Duplex UMI adapters [49] | |
| Bioinformatic Tools | QC Pipeline | Assesses sequencing quality and potential biases | FastQC, MultiQC [49] |
| GC Bias Correction | Corrects GC-dependent coverage biases | GCfix [47], Griffin [48] | |
| Fragmentomics Analysis | Extracts fragmentation features from sequencing data | cfDNAPro R package [44] | |
| Nucleosome Profiling | Maps nucleosome positions from fragment coverage | Griffin framework [48] | |
| Signature Decomposition | Separates fragment length sources | NMF methods [51] |
Library preparation for cfDNA analysis demands careful consideration of GC-bias and fragment length signatures, both as technical challenges and as sources of biological insight. Methodological choices during library construction—from kit selection to input amount and fragmentation method—profoundly impact downstream data quality and analytical possibilities. The emerging toolkit of specialized protocols and bioinformatic methods enables researchers to address these nuances more effectively than ever before.
For chemogenomic studies, leveraging these advanced preparation and analysis methods allows researchers to extract maximum information from limited cfDNA samples, transforming potential technical obstacles into opportunities for biological discovery. As the field progresses, standardized frameworks for fragmentomic feature extraction and GC-bias correction will be crucial for generating comparable, reproducible data across studies and institutions.
Next-generation sequencing (NGS) technologies have revolutionized genomic research, offering powerful tools for a wide range of applications. The fundamental division in this field lies between short-read sequencing platforms, dominated by Illumina, and long-read sequencing technologies, primarily represented by Pacific Biosciences (PacBio) and Oxford Nanopore Technologies (ONT). Each platform offers distinct advantages and limitations that make them suitable for different research scenarios. For chemogenomic studies investigating genomic alterations in response to chemical compounds, and particularly when working with different DNA sources like genomic DNA (gDNA) versus circulating cell-free DNA (cfDNA), the choice of sequencing platform can significantly impact research outcomes. This guide provides an objective comparison of these technologies to inform researchers, scientists, and drug development professionals in their experimental planning.
Short-Read Sequencing Platforms
Short-read technologies (e.g., Illumina, Ion Torrent) generate reads typically between 75-300 base pairs through sequencing by synthesis or ligation methods [53]. These platforms currently dominate microbiome research and clinical sequencing applications due to their high accuracy and throughput. Illumina sequencing involves single-stranded DNA-binding proteins for amplification, followed by the addition of fluorescent-labelled deoxynucleoside triphosphates to bridge the amplified DNA template [54]. The key advantage of these platforms is their extremely high per-base accuracy (>99.9%), which enables precise base-calling and reliable detection of single nucleotide variants [53]. However, the short read length poses challenges for assembling complex genomic regions and resolving structural variations.
Long-Read Sequencing Platforms
Long-read technologies produce reads ranging from 5,000 to over 30,000 base pairs, with Nanopore theoretically capable of reads up to 1 million base pairs [54]. Pacific Biosciences utilizes Single Molecule Real-Time (SMRT) sequencing on a zero-mode waveguide chip where DNA polymerase is fixed at the bottom, generating highly accurate HiFi reads through circular consensus sequencing [54]. Oxford Nanopore employs a fundamentally different approach, relying on changes in ion flow as nucleotides pass through a biological nanopore to determine the sequence [54]. The primary advantage of long-read platforms is their ability to span repetitive regions and structurally complex genomic areas, providing more complete genome assemblies and better characterization of structural variants.
Table 1: Fundamental Characteristics of Major Sequencing Platforms
| Platform | Read Length | Accuracy | Key Technology | Primary Applications |
|---|---|---|---|---|
| Illumina | 75-300 bp | >99.9% [53] | Sequencing by synthesis | Variant calling, expression profiling, targeted sequencing |
| PacBio | 5,000-30,000+ bp | ~99.9% (HiFi mode) [54] | Single Molecule Real-Time (SMRT) | De novo assembly, full-length transcript sequencing, epigenetics |
| Oxford Nanopore | Up to 1 million+ bp | ~99% (latest chemistries) [55] | Nanopore sensing | Real-time sequencing, structural variant detection, metagenomics |
Performance Comparison in Critical Applications
Diagnostic Accuracy and Sensitivity
In clinical diagnostics applications such as lower respiratory tract infections, a comparative meta-analysis found that short-read and long-read platforms demonstrate similar sensitivity (approximately 71.8% for Illumina vs. 71.9% for Nanopore) [53]. However, specificity varied substantially across platforms, ranging from 42.9% to 95% for Illumina and 28.6% to 100% for Nanopore [53]. Platform performance also varies by pathogen type, with Nanopore demonstrating superior sensitivity for detecting Mycobacterium species compared to Illumina platforms [53]. Concordance rates between platforms ranged from 56% to 100% across different studies, highlighting the context-dependent nature of platform performance [53].
Genome Coverage and Assembly Quality
Short-read platforms consistently produce superior genome coverage, approaching 100% in most reports, making them ideal for applications requiring comprehensive variant detection [53]. However, the assembly of short reads tends to be fragmented into hundreds of contigs in regions with repetitive elements or similar strains [53]. Long-read sequencing addresses this limitation by spanning repetitive regions, resulting in more contiguous assemblies and higher recovery of complete metagenome-assembled genomes (MAGs) [53]. Long reads also capture complete genes and operons intact, which improves functional annotation and detection of structural variants or antibiotic-resistance cassettes [53].
Variant Detection Performance
In cancer genomics, particularly colorectal cancer, comparative studies have revealed distinct platform strengths. Short-read sequencing demonstrates high precision for single nucleotide variant (SNV) detection with mapping quality scores of 33.67 (99.96% accuracy) [55]. Long-read sequencing shows enhanced capability for detecting structural variants (SVs) and complex rearrangements, with consistently high precision across different SV types, though recall varies by variant class and size [55]. For cfDNA analysis in cancer, targeted NGS panels can identify genetic alterations with high sensitivity (down to 0.1% allelic frequency with AmpliSeq HD), enabling detection of rare tumor-derived fragments in circulation [56].
Table 2: Quantitative Performance Metrics Across Platforms
| Performance Metric | Illumina (Short-Read) | Oxford Nanopore (Long-Read) | PacBio (Long-Read) |
|---|---|---|---|
| Average Sensitivity | 71.8% [53] | 71.9% [53] | Not specified |
| Specificity Range | 42.9-95% [53] | 28.6-100% [53] | Not specified |
| Per-Base Accuracy | >99.9% [53] | ~99% (latest) [55] | ~99.9% (HiFi) [54] |
| Mapping Quality | 33.67 (99.96%) [55] | 29.8 (99.89%) [55] | Not specified |
| Structural Variant Detection | Limited | Enhanced [55] | Enhanced |
Experimental Design and Methodological Considerations
DNA Source Considerations: gDNA vs. cfDNA
The source of DNA significantly impacts sequencing platform selection. For genomic DNA applications, long-read sequencing excels in de novo genome assembly and resolving complex regions, while short-read platforms provide cost-effective variant detection [55]. For circulating cell-free DNA analysis, short-read targeted sequencing currently dominates clinical applications due to its sensitivity for detecting low-frequency variants in limited material [56].
cfDNA fragments are typically short (~160 bp) due to their nuclease-dependent fragmentation pattern, making them naturally compatible with short-read platforms [56]. However, long-read sequencing of cfDNA can provide advantages for detecting larger structural variants and epigenetic markers, with Nanopore offering the additional benefit of direct detection of base modifications [55].
Library Preparation and Workflow Considerations
Library preparation protocols differ significantly between platforms. Short-read library preparation typically involves multiple steps: DNA fragmentation, end repair, adapter ligation, and amplification [54]. This process can introduce biases, particularly in GC-rich regions [54]. Long-read library preparation is often simpler, with PCR-free protocols available that preserve native methylation signals, enabling simultaneous detection of genetic and epigenetic variation [55].
Turnaround time represents another key differentiator. Nanopore platforms offer significantly faster turnaround times (under 24 hours) compared to most short-read platforms, enabling rapid clinical decision-making [53]. PacBio's Revio system now delivers human genomes at scale for less than $1,000, bridging the cost gap between platforms [54].
Experimental Protocols for Platform Comparison
A standardized methodology for comparing sequencing platforms in cancer research involves:
- Sample Preparation: Collect matched tumor and normal tissues, with cfDNA from plasma samples [56].
- DNA Extraction: Use standardized protocols for gDNA and cfDNA isolation [55].
- Library Preparation: Prepare libraries for each platform following manufacturer protocols:
- Sequencing: Sequence to appropriate coverage (e.g., 30x for WGS, >100x for targeted) [55].
- Data Analysis: Align reads, call variants, and compare detection rates for SNVs, indels, and SVs using standardized pipelines [55].
Diagram 1: Experimental workflow for comparative platform performance assessment showing parallel processing of gDNA and cfDNA samples through short-read and long-read pathways.
Technology Selection Guide
Decision Framework for Platform Selection
The choice between short-read and long-read sequencing depends on multiple factors, including research goals, sample type, and resource constraints. The following decision framework summarizes the optimal use cases for each technology:
Diagram 2: Decision framework for selecting between short-read and long-read sequencing technologies based on project requirements.
Application-Specific Recommendations
Chemogenomic Studies with gDNA
For chemogenomic studies investigating mutagenic effects of chemical compounds on genomic DNA, short-read sequencing is recommended for:
- High-throughput screening of mutation profiles across multiple compounds
- Detection of single nucleotide variants and small indels with high accuracy
- Cost-effective analysis of large sample numbers
Long-read sequencing is preferable for:
- Characterizing complex structural rearrangements induced by genotoxic compounds
- Resolving repetitive regions affected by chemical mutagens
- Simultaneous detection of genetic and epigenetic changes
Liquid Biopsy and cfDNA Applications
For monitoring chemogenomic responses through circulating tumor DNA, short-read targeted sequencing offers:
- Superior sensitivity for low-frequency variants (down to 0.1% allelic frequency)
- Established protocols for ctDNA analysis [56]
- Cost-effectiveness for monitoring minimal residual disease
Long-read sequencing of cfDNA provides advantages for:
- Detection of larger structural variants and fusion events
- Epigenetic profiling without bisulfite conversion [55]
- Comprehensive mutation profiling without predefined targets
The Scientist's Toolkit: Essential Research Reagents and Materials
Table 3: Essential Research Reagents for NGS Platform Implementation
| Reagent/Material | Function | Platform Applicability |
|---|---|---|
| SMRTbell Template Prep Kit | Prepares DNA libraries for PacBio sequencing | PacBio |
| NEBNext Single Cell/Low Input RNA Library | Prepares libraries from limited RNA input | PacBio, Illumina |
| ONT Direct cDNA Kit | PCR-free cDNA library preparation for Nanopore | Oxford Nanopore |
| TRI Reagent | Total RNA extraction from tissues | All platforms |
| DNase I (RNase-free) | Removal of genomic DNA from RNA preparations | All platforms |
| Agencourt AMPure XP Beads | Nucleic acid purification and size selection | All platforms |
| Twist Human Core Exome Panel | Target enrichment for exome sequencing | Illumina, compatible with Nanopore |
| Qubit dsDNA HS Assay Kit | Accurate quantification of DNA libraries | All platforms |
Both short-read and long-read sequencing technologies offer distinct advantages for chemogenomic studies utilizing gDNA and cfDNA. Short-read platforms maintain strengths in cost-effectiveness, accuracy for SNV detection, and established workflows for cfDNA analysis. Long-read technologies excel in resolving complex genomic regions, detecting structural variants, and providing epigenetic information. The optimal platform choice depends on specific research questions, with a hybrid approach often providing the most comprehensive solution. As both technologies continue to evolve, with improvements in accuracy, throughput, and cost, their applications in chemogenomic research and drug development will continue to expand, enabling more comprehensive characterization of genomic responses to chemical perturbations.
In chemogenomic studies and drug development, the choice of genomic source material is pivotal. For years, genomic DNA (gDNA) isolated from tissue biopsies has been the cornerstone for identifying hereditary predispositions and somatic mutations that drive cancer. This approach provides a comprehensive snapshot of the tumor's genetic makeup but is limited by its invasiveness and inability to capture spatial and temporal heterogeneity. The emergence of cell-free DNA (cfDNA) analysis from liquid biopsies offers a minimally invasive alternative that can profile tumor-derived DNA circulating in the blood, enabling repeated assessments and better representation of tumor heterogeneity. This guide objectively compares the performance of gDNA and cfDNA-based next-generation sequencing (NGS) methodologies for mutation discovery in cancer research, providing experimental data to inform platform selection for specific research applications.
Performance Comparison: gDNA vs. cfDNA-Based Approaches
Direct comparisons between gDNA and cfDNA sequencing reveal distinct performance characteristics across multiple parameters critical for target discovery. The following tables summarize key quantitative findings from comparative studies.
Table 1: Detection Performance of gDNA and cfDNA Sequencing
| Performance Metric | gDNA from Tissue | cfDNA from Plasma | Experimental Context |
|---|---|---|---|
| Overall Concordance Rate | Reference Standard | 86% | Driver gene detection in advanced NSCLC [24] |
| SNV/Small Indel Sensitivity | >99% at 500x depth | Varies by assay & tumor fraction | Validated on clinical tumor specimens [58] |
| Copy Number Alteration Detection | Robust in samples with ≥20% tumor cells | Lower sensitivity; technical challenges | Clinical cancer specimens [35] [58] |
| Gene Fusion Detection | 86% concordance with IHC | Limited sensitivity for fusions | ALK fusion detection in clinical samples [58] |
| Multisource cfDNA Concordance | Not applicable | 90% (plasma+sputum+urine) | Driver genes in advanced NSCLC [24] |
Table 2: Tumor-Agnostic cfDNA Detection Methods in Early Breast Cancer
| Method Type | Specific Assay | Detection Rate | Genomic Target |
|---|---|---|---|
| Targeted SNV Panel | Oncomine Breast cfDNA | 12.5% (3/24) | 150 hotspots in 10 genes [4] |
| CNV-based | mFAST-SeqS | 12.5% (5/40) | Genome-wide aneuploidy [4] |
| CNV-based | Shallow Whole Genome | 7.7% (3/40) | Copy number variations [4] |
| Methylation-based | MeD-Seq | 57.5% (23/40) | Genome-wide methylation [4] |
| Combined Approach | All four methods combined | 65% (26/40) | Multiple genomic features [4] |
Experimental Protocols and Methodologies
gDNA Sequencing from Tissue Specimens
The established protocol for gDNA sequencing from formalin-fixed paraffin-embedded (FFPE) tissues involves specific steps to ensure data quality from potentially degraded samples [58]:
- Pathological Examination: 4-μm paraffin sections are stained with hematoxylin and eosin for pathological review to determine that a sample has a volume of ≥1 mm³ and ≥20% tumor cells. For samples with ≤20% tumor content, macro-dissection is employed to enrich tumor cells.
- DNA Extraction: Paraffin is removed from FFPE sections using xylenes, followed by ethanol washing. Tissues are digested by proteinase K at 56°C overnight and incubated at 90°C for 5 minutes to reverse DNA crosslinks. Genomic DNA is extracted with QIAamp DNA FFPE Tissue Kit and quantified by PicoGreen fluorescence assay.
- Library Preparation: 50-200 ng of DNA is fragmented to ~200 bp by sonication and constructed into libraries with KAPA Hyper Prep Kit.
- Target Capture and Sequencing: A pool of 16,198 individually synthesized 5′-biotinylated 120 bp DNA oligonucleotides covering exons of 365 cancer-related genes and introns of 25 frequently rearranged genes is used for hybrid capture. Sequencing is performed on Illumina platforms at depths of 500x or higher.
- Variant Calling: For base substitutions, a Bayesian methodology is used with read depth >30x and variant frequency >1% (>0.5% at hotspots). For indel detection, de novo local assembly is performed using the de Bruijn approach.
cfDNA Sequencing from Liquid Biopsies
cfDNA analysis employs specialized methods to detect rare tumor-derived fragments against high background noise [4] [59]:
- Blood Collection and Plasma Isolation: Blood is collected in EDTA, CellSave, or Streck tubes. Plasma is isolated within 4 hours (EDTA) or 96 hours (CellSave/Streck) after collection by two centrifugation steps and stored at -80°C.
- cfDNA Extraction: cfDNA is extracted from plasma using the QiaAmp kit according to manufacturer's instructions. cfDNA concentration is estimated using the Quant-IT dsDNA high-sensitivity Assay and Qubit Fluorometer.
- Library Preparation for Various Assays:
- Targeted SNV Panels: The Oncomine Breast cfDNA panel uses 10 ng cfDNA with a 1.9 kb panel covering 150 hotspots in 10 genes.
- Whole-Genome Approaches: Methods like GEMINI involve sequencing individual cfDNA molecules to estimate mutation frequency and type genome-wide using non-overlapping bins.
- Unique Analytical Approaches: The GEMINI method compares mutation type and frequency in genomic regions more commonly altered in cancer versus regions more frequently mutated in normal cfDNA to determine multiregional differences in mutation profiles.
Experimental Workflows for gDNA and cfDNA Analysis
Technical Challenges and Limitations
gDNA Sequencing Constraints
gDNA sequencing from tissue specimens faces several limitations that impact its utility in comprehensive target discovery. Tumor heterogeneity presents a significant challenge, as a single biopsy may not represent the complete genomic landscape of a tumor, potentially missing subclonal mutations that drive resistance [35]. The requirement for sufficient tumor cellularity (typically ≥20%) excludes many samples with low tumor content or extensive stromal contamination from analysis [58]. For structural variants like ALK fusions, targeted NGS identified only 86% of IHC-positive cases, indicating limitations in comprehensive fusion detection [58]. Additionally, the analysis of trinucleotide repeats and other complex variants remains challenging, with one study noting that "expansion of trinucleotide repeats was not detected in one patient, though sequence depth was over 100×" [60].
cfDNA Sequencing Constraints
cfDNA analysis faces distinct technical hurdles primarily related to low tumor DNA fraction and biological background noise. The proportion of tumor-derived fragments in total cfDNA is often low, particularly in early-stage disease, creating sensitivity limitations [59] [35]. Detection of copy number alterations and fusions presents particular challenges in cfDNA due to technical limitations [35]. Biological background noise from clonal hematopoiesis of indeterminate potential can confound interpretation, as mutations from blood cells may be misclassified as tumor-derived [61] [35]. One study noted that "only 12% of predicted causal variants were recorded as causal mutations in public databases: 88% had no or insufficient records," highlighting the interpretive challenges with rare variants [60]. Method-specific limitations also exist, such as the low detection rates (7.7-12.5%) observed with copy number-based cfDNA assays compared to methylation-based approaches in early breast cancer [4].
The Scientist's Toolkit: Essential Research Reagents
Table 3: Key Reagents and Materials for gDNA and cfDNA Studies
| Reagent/Material | Function | Example Products |
|---|---|---|
| Specialized Blood Collection Tubes | Preserves cell-free DNA in blood samples | EDTA, CellSave, Streck tubes [4] |
| Nucleic Acid Extraction Kits | Isolates high-quality DNA from various sources | QIAamp DNA FFPE Tissue Kit, QIAamp Circulating Nucleic Acid Kit [4] [24] |
| DNA Quantitation Assays | Precisely measures DNA concentration | Quant-IT dsDNA HS Assay, PicoGreen assay [4] [58] |
| Library Preparation Kits | Prepares sequencing libraries from input DNA | KAPA Hyper Prep Kit [24] [58] |
| Target Capture Panels | Enriches cancer-relevant genomic regions | Custom 365-gene panels, Oncomine Breast cfDNA panel [4] [58] |
| Hybridization Baits | Captures targeted regions during library prep | 5′-biotinylated DNA oligonucleotides [58] |
Advanced Analytical Approaches
Machine Learning for Mutation Origin Prediction
Distinguishing tumor-derived mutations from background alterations in cfDNA requires sophisticated computational approaches. Semi-supervised generative adversarial network models have been developed to differentiate tumor- or clonal hematopoiesis-related mutations in cfDNA by analyzing genomic coordinates and nucleotide composition [61]. These models, trained on reference catalogs of approximately 25,000 single nucleotide variants with known origins, achieve 95% area under the curve in classifying uncharacterized variants as clonal hematopoiesis or tumor-derived [61].
Genome-Wide Mutation Profile Analysis
The GEMINI approach represents a significant advancement in cfDNA analysis by identifying somatic mutations genome-wide rather than in limited gene panels. This method examines mutation frequencies in non-overlapping genomic bins and compares profiles from regions more commonly altered in cancer versus normal cfDNA [59]. This approach enriches probable somatic mutations while accounting for individual variability in overall background changes, achieving 90% detection sensitivity for stage I and II lung cancer using low-coverage whole-genome sequencing [59].
Advanced Analysis of cfDNA Mutation Profiles
The choice between gDNA and cfDNA-based approaches for mutation discovery depends on research objectives, sample availability, and disease context. gDNA sequencing remains essential for comprehensive genomic profiling when tissue is available, offering high sensitivity for established variant types and serving as a reference standard for validation studies. In contrast, cfDNA analysis provides unique advantages for monitoring temporal evolution, assessing tumor heterogeneity, and accessing genomic information when tissue biopsies are contraindicated. The integration of multi-analyte approaches, including mutation profiling, fragmentomics, and methylation analysis, represents the future of liquid biopsy applications in oncology. As these technologies continue to evolve, they will collectively enhance our ability to identify novel therapeutic targets and monitor treatment responses in cancer patients.
In the era of precision oncology, the ability to monitor treatment response and detect minimal residual disease (MRD) represents a critical frontier in cancer management. Circulating cell-free DNA (cfDNA) analysis via liquid biopsy has emerged as a transformative technology that addresses fundamental limitations of traditional tissue biopsies and imaging [35] [25]. Unlike conventional diagnostic approaches, cfDNA analysis provides a minimally invasive method for obtaining real-time molecular information about tumor dynamics, heterogeneity, and treatment response [62] [25]. This capability is particularly valuable for assessing MRD—the presence of microscopic cancer cells after treatment with curative intent—which often precedes clinical recurrence by months or years [62].
The fundamental advantage of cfDNA lies in its biological properties. These short DNA fragments (approximately 160-200 base pairs) are released into the bloodstream through apoptosis and necrosis of both normal and tumor cells [63] [18]. The tumor-derived fraction, known as circulating tumor DNA (ctDNA), carries the same genetic alterations as the tumor tissue itself and has a short half-life of approximately 16 minutes to several hours [63] [25]. This rapid turnover enables cfDNA to provide a real-time snapshot of tumor burden and genomic evolution, making it an exceptionally dynamic biomarker for monitoring therapeutic efficacy and detecting early signs of resistance [64] [25].
When contextualized within a broader comparison of genomic DNA (gDNA) versus cfDNA-based next-generation sequencing (NGS) for chemogenomic research, cfDNA offers distinct advantages for longitudinal monitoring applications. While gDNA extracted from tissue biopsies or white blood cells provides comprehensive genetic information, it reflects a single point in time and cannot be repeatedly sampled to track molecular changes during treatment [65] [64]. The minimally invasive nature of cfDNA analysis facilitates frequent serial monitoring, enabling researchers and clinicians to observe the molecular trajectory of disease in response to therapeutic interventions without subjecting patients to repeated invasive procedures [62] [35].
Biological Foundations and Technical Advantages of cfDNA
Fundamental Characteristics of cfDNA
Cell-free DNA consists of short, double-stranded DNA fragments typically ranging from 100-300 base pairs that circulate in the bloodstream and other bodily fluids [63] [65] [18]. These fragments are released primarily through cellular apoptosis and necrosis, with tumor cells contributing the subset known as circulating tumor DNA (ctDNA) [62] [18]. In healthy individuals, most cfDNA originates from hematopoietic cells, while in cancer patients, the proportion of ctDNA can range from less than 0.1% in early-stage disease to over 90% in advanced malignancies [63] [25]. The fragment length of ctDNA differs slightly from non-tumor cfDNA, with mean lengths of approximately 143-166 base pairs, which can be exploited for analytical purposes [63] [62].
The concentration of cfDNA in blood plasma varies considerably (0-100 ng/mL) and is influenced by multiple factors including tumor type, burden, location, and patient-specific factors such as exercise or infection [63] [65]. This variability presents both challenges and opportunities for diagnostic applications. From a clinical monitoring perspective, a key advantage is the short half-life of cfDNA (approximately 16 minutes to 2.5 hours), which enables it to function as a real-time biomarker that reflects current disease status rather than historical biology [63] [64] [25].
Comparative Advantages Over Traditional Monitoring Methods
When evaluated against standard techniques for treatment monitoring, cfDNA analysis demonstrates several distinct technical and clinical advantages:
Table 1: Comparative Analysis of Cancer Monitoring Methodologies
| Monitoring Method | Invasiveness | Tumor Heterogeneity Capture | Turnaround Time | Sensitivity for MRD | Real-Time Capability |
|---|---|---|---|---|---|
| Tissue Biopsy | High (surgical) | Limited (single site) | Days to weeks | Low | No (single time point) |
| Imaging (CT/MRI) | Minimal | None (anatomical only) | Days | Low (requires macroscopic disease) | Limited |
| gDNA Analysis | High to moderate | Limited (single site) | Days to weeks | Low | No |
| cfDNA Liquid Biopsy | Minimal (blood draw) | High (systemic) | Hours to days | High (0.01% VAF*) | Yes (frequent serial monitoring) |
*VAF: Variant Allele Fraction [63] [62] [35]
The minimally invasive nature of cfDNA analysis—requiring only a blood draw—enables repeated sampling throughout treatment courses, providing unprecedented insights into dynamic molecular changes [62] [25]. This contrasts sharply with tissue biopsies, which capture only a single spatial and temporal snapshot of what is often a heterogeneous disease [64]. Furthermore, cfDNA analysis demonstrates superior sensitivity for MRD detection compared to radiological imaging, potentially identifying molecular recurrence months before clinical manifestation [62] [35]. By capturing DNA shed from all tumor sites, cfDNA provides a more comprehensive representation of tumor heterogeneity than single-site tissue biopsies [35] [25].
Figure 1: Comprehensive Workflow of cfDNA Analysis for Treatment Monitoring
Methodological Approaches for cfDNA Analysis in MRD
Next-Generation Sequencing Technologies
Next-generation sequencing platforms form the technological backbone of modern cfDNA analysis, enabling highly sensitive detection of tumor-specific alterations. The prevailing approach for MRD detection involves ultra-deep sequencing (typically >10,000x coverage) of patient-specific mutations using targeted panels [63] [25]. Key NGS methodologies include:
- Tumor-informed approaches: These methods first sequence the primary tumor tissue to identify patient-specific mutations, then design personalized assays to track these mutations in plasma [25]. Examples include Safe-Sequencing System (Safe-SeqS) and CAncer Personalized Profiling by deep Sequencing (CAPP-Seq) [25].
- Tumor-agnostic approaches: These methods analyze cfDNA without prior knowledge of tumor genetics, typically focusing on recurrent mutations in cancer-associated genes or genome-wide fragmentation patterns [63] [35].
A critical innovation in cfDNA sequencing is the implementation of unique molecular identifiers (UMIs), which are molecular barcodes attached to individual DNA fragments before amplification [63] [25]. UMIs enable bioinformatic correction of PCR and sequencing errors by distinguishing true mutations from technical artifacts, significantly enhancing detection sensitivity [63]. More advanced methods like Duplex Sequencing tag and sequence both strands of DNA duplexes, providing even higher accuracy by requiring true mutations to appear on both strands [25].
Table 2: Comparison of Key NGS Platforms for cfDNA Analysis
| Platform/Technology | Sequencing Principle | Read Length | Key Advantages | Limitations for cfDNA |
|---|---|---|---|---|
| Illumina | Sequencing-by-synthesis with reversible dye terminators | 36-300 bp | High accuracy (Q30+), high throughput | Short reads, PCR amplification bias |
| Ion Torrent | Semiconductor sequencing detecting H+ ions | 200-400 bp | Rapid turnaround, lower cost | Homopolymer errors, moderate throughput |
| CAPP-Seq | Targeted hybrid capture & deep sequencing | Customizable | High sensitivity (0.01% VAF), tumor-informed | Requires prior tumor sequencing |
| Duplex Sequencing | Barcoding both DNA strands | Varies | Ultra-high accuracy (error rate <10⁻⁷) | Lower efficiency, higher input requirements |
| PacBio HiFi | Single-molecule real-time sequencing | 10,000-25,000 bp | Long reads, detects structural variants | Higher cost, lower throughput for cfDNA |
PCR-Based Detection Methods
While NGS provides comprehensive genomic information, PCR-based methods offer alternative approaches for specific monitoring applications where target mutations are known:
- Droplet Digital PCR (ddPCR): This technique partitions samples into thousands of nanoliter-sized droplets, allowing absolute quantification of mutant DNA molecules with sensitivity down to 0.001% variant allele frequency [18]. ddPCR provides high sensitivity, rapid turnaround, and cost-effectiveness for tracking known mutations but is limited in the number of targets that can be simultaneously assessed [18] [25].
- BEAMing (Beads, Emulsion, Amplification, and Magnetics): This technology combines emulsion PCR with flow cytometry to detect and quantify specific mutant sequences, offering similar sensitivity to ddPCR for monitoring predetermined mutations [18] [25].
The choice between NGS and PCR-based methods depends on the clinical or research context. For monitoring known resistance mutations (e.g., EGFR T790M in NSCLC or ESR1 mutations in breast cancer), ddPCR provides a rapid and cost-effective solution [25]. For comprehensive assessment of MRD where the complete mutational landscape may evolve under therapeutic pressure, NGS-based approaches are preferred despite their greater complexity and cost [63] [35].
Successful implementation of cfDNA analysis for treatment monitoring requires specialized reagents and methodologies optimized for working with low-abundance targets in complex biological samples. The following toolkit outlines critical components for reliable cfDNA-based MRD detection:
Table 3: Essential Research Reagent Solutions for cfDNA Analysis
| Reagent/Category | Specific Examples | Function & Importance | Technical Considerations |
|---|---|---|---|
| cfDNA Extraction Kits | cfPure Cell Free DNA Extraction Kit, QIAamp Circulating Nucleic Acid Kit | Isolation of high-quality cfDNA from plasma with minimal contamination | Magnetic bead-based systems offer higher recovery than column-based methods; critical for low-concentration samples |
| Library Preparation Kits | Illumina TruSeq DNA PCR-Free, Swift Biosciences Accel-NGS | Preparation of sequencing libraries while maintaining fragment size information | PCR-free protocols reduce bias; UMI incorporation essential for error correction |
| Target Enrichment Panels | Illumina TruSeq Amplicon - Cancer Panel, ArcherDX VariantPlex | Selective capture of cancer-associated genomic regions | Custom panels enable tumor-informed approaches; off-the-shelf panels cover common cancer genes |
| Quantitation Standards | ERCC RNA Spike-In Mix, Digital PCR Absolute Quantitation Standards | Quality control and absolute quantification | Essential for assay standardization and cross-platform comparison |
| Unique Molecular Identifiers | Custom UMI adapters, Commercial UMI kits | Tagging individual DNA molecules pre-amplification | Enables bioinformatic error correction; critical for detecting variants <0.1% VAF |
| Bioinformatics Tools | MuTect, VarScan, custom UMI-aware pipelines | Variant calling from sequencing data | Specialized algorithms required for low-VAF detection in noisy NGS data |
Performance Comparison: cfDNA vs. gDNA in Clinical Monitoring
Analytical Sensitivity and Specificity
Direct comparison of cfDNA and gDNA-based approaches reveals fundamental differences in their performance characteristics for treatment monitoring applications. In a comparative study of whole blood samples from patients with positive blood cultures, gDNA-based mNGS achieved significantly increased microbial reads per million (RPM) with an average of 2,359 RPM, while cfDNA-based methods yielded only 95 RPM on average [65]. This substantial difference in target recovery highlights the abundance advantage of gDNA for microbial detection, though the implications for tumor-derived DNA differ due to the circulating nature of ctDNA.
For MRD detection in oncology, the critical performance metric is the ability to identify low-frequency variants against a background of wild-type DNA. Tumor-informed cfDNA assays can detect ctDNA at variant allele fractions as low as 0.01% (1 mutant molecule per 10,000 wild-type molecules), surpassing the sensitivity of gDNA-based approaches from tissue biopsies [63] [64]. This exceptional sensitivity enables cfDNA assays to identify molecular relapse significantly earlier than radiographic methods—in colorectal cancer, ctDNA detection preceded radiographic recurrence by a median of 3-5 months [62].
Comprehensive Performance Metrics
Table 4: Experimental Performance Comparison of cfDNA vs. gDNA NGS Approaches
| Performance Metric | cfDNA-Based NGS | gDNA-Based NGS | Clinical/Research Implications |
|---|---|---|---|
| Limit of Detection (VAF) | 0.001%-0.1% [63] [25] | 1%-5% [18] | cfDNA enables MRD detection; gDNA suitable for high tumor purity samples |
| Tumor Heterogeneity Representation | High (systemic) [35] [25] | Limited (single site) [64] | cfDNA captures comprehensive mutational landscape; gDNA reflects localized genetics |
| Serial Monitoring Capability | Excellent (minimally invasive) [62] [25] | Poor (invasive procedures required) [64] | cfDNA enables dynamic response assessment; gDNA limited to baseline assessment |
| Turnaround Time | 1-3 days [65] [25] | 3-7 days (including biopsy) [18] | cfDNA provides more rapid results for clinical decision-making |
| Input Material Requirements | Low (ng range of plasma cfDNA) [63] | High (μg range of tissue gDNA) [64] | cfDNA suitable for low-yield samples; gDNA requires sufficient tissue |
| Preanalytical Variability | High (affected by collection tubes, processing delays) [63] | Moderate (FFPE tissue relatively stable) [64] | cfDNA requires strict protocol standardization; gDNA more forgiving |
The comparative data reveal a fundamental trade-off: while gDNA from tissue biopsies provides more abundant genetic material for analysis, cfDNA offers superior capabilities for longitudinal monitoring and systemic disease assessment. The high preanalytical variability of cfDNA underscores the importance of standardized protocols from blood collection through DNA extraction [63]. Improper handling can lead to leukocyte lysis and contamination of cfDNA with genomic DNA, compromising assay sensitivity and specificity [63].
Clinical Validation and Applications
Monitoring Treatment Response in Solid Tumors
cfDNA analysis has demonstrated significant utility across multiple cancer types for monitoring treatment response and detecting emergent resistance mechanisms. In non-small cell lung cancer (NSCLC), ctDNA dynamics during EGFR tyrosine kinase inhibitor therapy can identify response within days of treatment initiation and detect resistance mutations months before clinical progression [63] [25]. For colorectal cancer, ctDNA levels after curative-intent surgery strongly predict recurrence risk and can guide adjuvant therapy decisions [62] [35]. In breast cancer, serial ctDNA analysis detects ESR1 mutations emerging under aromatase inhibitor therapy, enabling timely intervention with alternative treatments [35] [25].
The clinical value of ctDNA monitoring extends beyond simple mutation tracking to comprehensive assessment of molecular response, defined by metrics such as ctDNA clearance after treatment, percent change from baseline, and early changes in variant allele frequency [25]. These quantitative measures often correlate more closely with clinical outcomes than traditional imaging-based assessments, particularly for targeted therapies and immunotherapies where tumor size changes may not immediately reflect treatment efficacy [35] [25].
Clinical Trial Applications and Emerging Evidence
Growing evidence from prospective clinical trials supports the integration of cfDNA analysis into cancer management paradigms. The Circulating Cell-Free Genome Atlas (CCGA) study, one of the largest liquid biopsy validation efforts, demonstrated that cfDNA sequencing could detect multiple cancer types with stage-dependent sensitivity and high specificity [64]. Numerous ongoing trials are evaluating ctDNA-guided treatment strategies, including de-escalation of adjuvant therapy in ctDNA-negative patients and intensification or change of therapy in ctDNA-positive patients [62] [35].
Figure 2: Clinical Decision Pathway for MRD Detection Using cfDNA
Technical Challenges and Limitations
Despite its considerable promise, cfDNA analysis for treatment monitoring faces several technical challenges that must be addressed for broader clinical implementation:
- Low Abundance: The fraction of ctDNA can be extremely low, particularly in early-stage disease or low-shedding tumors, requiring highly sensitive detection methods [63] [25]. Preanalytical variables including blood collection tubes, processing delays, and DNA extraction methods significantly impact DNA yield and quality [63].
- Clonal Hematopoiesis: Age-related mutations in blood cells can confound ctDNA analysis, leading to false-positive results if not properly distinguished from tumor-derived variants [35]. Sequencing of matched white blood cell gDNA can help identify and filter these confounding mutations [25].
- Standardization Gaps: The field lacks universally standardized protocols for sample processing, analysis, and interpretation, complicating cross-study comparisons and clinical implementation [63] [62]. Initiatives like the Blood Profiling Atlas in Cancer (BloodPAC) Consortium are addressing these standardization challenges [64].
- Spatial Heterogeneity Limitations: While cfDNA captures systemic disease burden better than single-site biopsies, it may still underrepresent tumors in sanctuary sites or those with low shedding characteristics [63] [25].
Ongoing technological innovations are progressively addressing these limitations. Novel approaches like CODEC (Concatenating Original Duplex for Error Correction) achieve 1000-fold higher accuracy than conventional NGS while using significantly fewer reads [25]. Integration of multiparametric data including fragmentomics, methylation patterns, and protein markers may further enhance the sensitivity and specificity of cfDNA-based monitoring [62] [35].
cfDNA analysis has firmly established its unique role in treatment monitoring and MRD detection, offering unprecedented capabilities for minimally invasive, real-time assessment of treatment response and disease dynamics. When objectively compared to gDNA-based approaches within chemogenomic research, cfDNA demonstrates distinct advantages for longitudinal monitoring applications despite challenges related to preanalytical variability and low abundance targets.
The future trajectory of cfDNA analysis points toward several promising developments. Multimodal liquid biopsies that combine ctDNA mutation analysis with fragmentomics, methylation patterns, and protein biomarkers may further enhance sensitivity and specificity [62] [35]. Standardized ctDNA response criteria analogous to RECIST for imaging are emerging to harmonize molecular response assessment across clinical trials [25]. The ongoing validation of ctDNA-guided interventional trials will be crucial for establishing the clinical utility of treatment escalation or de-escalation based on MRD status [62] [35].
As technological innovations continue to enhance the sensitivity and accuracy of cfDNA analysis while reducing costs, its integration into routine oncology practice appears inevitable. For researchers and drug development professionals, cfDNA-based monitoring offers a powerful tool for accelerating therapeutic development and realizing the full potential of precision oncology through dynamic, molecularly-informed treatment strategies.
Pharmacogenomics (PGx) focuses on how an individual's genetic makeup influences their response to medications, with the primary goal of identifying which drugs are most likely to be safe and effective for a particular patient [67]. The field leverages genetic information to guide drug and dose selection, thereby helping to customize treatments and move away from a one-size-fits-all approach [67]. A central aspect of conducting pharmacogenomic studies is the choice of DNA source. Genomic DNA (gDNA), typically extracted from whole blood or tissue, contains the complete hereditary information of an organism. In contrast, cell-free DNA (cfDNA) consists of short, fragmented DNA strands circulating in bodily fluids such as plasma, serum, urine, or sputum, released through processes like apoptosis and necrosis [68] [24]. The selection between gDNA and cfDNA for next-generation sequencing (NGS) has profound implications for the scope, accuracy, and clinical applicability of research findings in chemogenomic studies. This guide provides an objective comparison of their performance, supported by experimental data and detailed methodologies.
Fundamental Comparison: gDNA vs. cfDNA
The choice between gDNA and cfDNA impacts all subsequent phases of a pharmacogenomics study, from sample collection and library preparation to data interpretation. The table below summarizes their core characteristics.
Table 1: Fundamental Characteristics of gDNA and cfDNA
| Characteristic | gDNA (from whole blood or tissue) | cfDNA (from plasma, urine, or sputum) |
|---|---|---|
| Origin & Structure | Intact, high-molecular-weight DNA from nucleated cells. | Short, fragmented DNA (typically 167 bp peaks) derived from apoptotic/necrotic cells or active release [68] [22]. |
| Genetic Content | Complete genome, including inherited (germline) variants. | Shed DNA, which can be a mix of germline and somatic (e.g., tumor-derived) variants [68] [24]. |
| Primary Applications | Germline pharmacogenetics, inherited variation in ADME genes, preemptive genotyping [69] [67]. | Liquid biopsy for oncology, therapy monitoring, detecting acquired resistance, cases where tissue biopsy is unfeasible [68] [24] [70]. |
| Sample Collection | Blood draw or tissue biopsy. Requires proper handling to prevent white blood cell lysis. | Minimally invasive (blood draw, urine collection). Plasma separation must occur within hours to prevent gDNA contamination [24] [22]. |
| Stability & Storage | Generally stable with standard freezing. | Highly fragile; requires rapid processing and specialized cfDNA-preservative tubes to prevent degradation [22]. |
Performance and Experimental Data in Pharmacogenomics
Concordance and Sensitivity for Variant Detection
A critical metric for evaluating DNA sources is their ability to accurately detect variants compared to a clinical gold standard, typically tissue biopsy. Studies have directly compared the genomic profiles obtained from different cfDNA sources against matched tumor tissue gDNA.
Table 2: Performance Comparison of gDNA and cfDNA from Different Sources in Detecting Driver Gene Alterations in Advanced NSCLC (N=50) [24]
| DNA Source | Overall Concordance Rate with Tissue gDNA | Key Findings and Context |
|---|---|---|
| Tumor Tissue gDNA | Gold Standard (100%) | The reference against which liquid biopsy sources are compared. |
| Plasma cfDNA | 86% | Considered a reliable source for liquid biopsy. |
| Sputum cfDNA | 74% | Concordance was significantly higher in patients with a smoking history (89%) than in non-smokers (66%) [24]. |
| Urine cfDNA | 70% | A viable non-invasive alternative, though with lower concordance. |
| Combined cfDNA (Plasma, Sputum, Urine) | 90% | Utilizing multiple cfDNA sources complementarily maximizes the detection of driver gene alterations [24]. |
Technical Performance in Sequencing
The physical characteristics of the DNA source directly influence the success of NGS library preparation and the quality of the resulting data.
Table 3: Technical Sequencing Performance and Workflow Considerations
| Performance Metric | gDNA | cfDNA |
|---|---|---|
| Input DNA Quantity | Requires hundreds of nanograms. | Effective with low input (nanograms) due to multi-copy nature of fragments [71]. |
| Input DNA Quality | Requires high-molecular-weight, intact DNA. | Tolerates fragmented state as it is native. Sensitive to gDNA contamination [22]. |
| Library Preparation | Requires a fragmentation step (enzymatic or sonication) before adapter ligation [71]. | Can be directly used for adapter ligation due to pre-existing fragmentation. |
| Variant Detection Sensitivity | Excellent for germline variants. | High sensitivity for somatic variants, capable of detecting mutant alleles at frequencies below 1% with deep sequencing [71]. |
| Coverage Uniformity | Generally even coverage across targeted regions. | Coverage can be influenced by fragmentomics and nucleosome protection patterns [22]. |
Detailed Experimental Protocols
Protocol for gDNA-Based Pharmacogenomic NGS
This protocol is standardized for germline variant discovery in pharmacogenes like CYP2D6, CYP2C19, and VKORC1 [67].
- DNA Extraction: Extract high-molecular-weight gDNA from whole blood or tissue using a silica-column or magnetic bead-based kit (e.g., Gentra Puregene Blood kit). Quantify DNA using fluorometry (e.g., Qubit dsDNA HS Assay) and assess quality/purity via Nanodrop and agarose gel electrophoresis [24].
- Library Preparation:
- Fragmentation: Fragment 250 ng–1 µg of gDNA to a target size of 200–500 bp using acoustic shearing or enzymatic digestion.
- Target Enrichment (Amplicon-based): Use a targeted NGS panel (e.g., Paragon Genomics' CleanPlex) designed against a custom pharmacogene panel. Amplify targets via PCR with primers containing Illumina adapter sequences [67].
- Alternatively, Target Enrichment (Hybrid Capture-based): After end-repair, A-tailing, and adapter ligation, perform hybridization with biotinylated probes (e.g., GeneseeqOne 416-gene panel) to pull down target regions. Wash away non-specific fragments [24] [71].
- PCR Amplification: Perform a limited-cycle PCR to amplify the final library and add sample index barcodes for multiplexing.
- Sequencing: Pool the indexed libraries and sequence on an NGS platform (e.g., Illumina HiSeq/NovaSeq) to a high depth of coverage (e.g., >100x) [24] [71].
- Data Analysis: Align sequences to a human reference genome (hg19/GRCh38). Call variants (SNPs, indels) and annotate using databases like dbSNP, gnomAD, and PharmGKB. Interpret variants following guidelines from CPIC or ACMG [67] [71].
gDNA NGS Workflow for PGx
Protocol for cfDNA-Based Pharmacogenomic NGS
This protocol is optimized for liquid biopsy applications, such as monitoring therapy resistance in oncology [24] [22].
- Sample Collection & cfDNA Extraction: Collect 10 mL of peripheral blood into EDTA or cfDNA-specific stabilizer tubes. Process within 2 hours to prevent lysis. Centrifuge to separate plasma. Extract cfDNA from 2-4 mL of plasma using a specialized kit for circulating nucleic acids (e.g., QIAamp Circulating Nucleic Acid Kit) [24] [22].
- Quality Control: Quantify cfDNA using a highly sensitive method like droplet digital PCR (ddPCR). Assess fragment size distribution via capillary electrophoresis (Bioanalyzer) or a ddPCR multiplex assay targeting different fragment sizes to confirm the characteristic ~167 bp peak and rule out gDNA contamination [22].
- Library Preparation: Use 10-250 ng of cfDNA. Bypass the fragmentation step. Proceed directly to end-repair, A-tailing, and adapter ligation. For target enrichment, hybrid-capture is often preferred for its ability to handle low-input, fragmented DNA and provide uniform coverage [71].
- Sequencing: Sequence the library to a very high depth (>1000x) to confidently detect low-frequency somatic variants present in a small fraction of cfDNA fragments [71].
- Data Analysis: Similar to gDNA pipeline, but with a focus on distinguishing somatic mutations from the germline background. Requires careful filtering based on allele frequency and the use of matched gDNA (from PBLs) as a control to identify tumor-specific alterations [24].
cfDNA NGS Workflow for PGx
The Scientist's Toolkit: Essential Research Reagent Solutions
Successful implementation of gDNA and cfDNA NGS requires specific reagents and kits. The following table details essential solutions for your research pipeline.
Table 4: Essential Research Reagent Solutions for gDNA and cfDNA NGS
| Research Reagent Solution | Function/Description | Example Kits/Technologies |
|---|---|---|
| gDNA Extraction Kits | Isolate high-quality, high-molecular-weight DNA from whole blood or tissue samples. | Gentra Puregene Blood Kit [24] |
| cfDNA Extraction Kits | Specifically designed to purify short, low-concentration cfDNA from plasma, urine, or other biofluids while inhibiting nucleases. | QIAamp Circulating Nucleic Acid Kit [24] |
| Targeted NGS Panels | Amplicon or hybrid-capture-based panels for enriching a predefined set of pharmacogenes (e.g., CYP450s, VKORC1, TPMT) prior to sequencing. | Paragon Genomics CleanPlex Panels [67], GeneseeqOne Panel [24] |
| ddPCR Assays | Used for absolute quantification of cfDNA yield, assessment of fragment size distribution, and ultra-sensitive validation of specific variants [22]. | Bio-Rad ddPCR System |
| Library Prep Kits | Kits containing enzymes and buffers for converting purified DNA into sequencing-ready libraries (end-repair, A-tailing, adapter ligation, amplification). | KAPA Hyper Prep Kit [24] |
| NGS Platforms | Instruments that perform massively parallel sequencing. Key choices include Illumina (SBS), PacBio (SMRT), and Oxford Nanopore (nanopore). | Illumina HiSeq/NovaSeq [24] [71] |
The decision to use gDNA or cfDNA in pharmacogenomic studies is not a matter of superiority but of strategic alignment with research objectives. gDNA remains the undisputed source for comprehensive germline pharmacogenotyping, providing a stable and complete picture of inherited variants that dictate baseline drug metabolism capacity (e.g., CYP2D6 poor metabolizer status) [69] [67]. In contrast, cfDNA offers a powerful, minimally invasive tool for dynamic monitoring of somatic genomic changes, particularly in oncology, where it can reveal tumor heterogeneity and emergent resistance mechanisms during treatment [68] [24] [70]. As the data shows, combining multiple cfDNA sources (e.g., plasma, sputum, urine) can further enhance sensitivity. The future of precision medicine lies in leveraging the complementary strengths of both DNA sources—using gDNA for preemptive, inherited risk assessment and cfDNA for real-time, adaptive therapeutic management.
Navigating Technical Hurdles: Strategies for Enhancing Sensitivity and Specificity
The analysis of cell-free DNA (cfDNA) has emerged as a revolutionary approach in liquid biopsy, enabling non-invasive detection of circulating tumor DNA (ctDNA) and microbial DNA for oncologic and infectious disease applications [18] [72]. However, a fundamental challenge limits its widespread clinical utility: the extremely low abundance of target DNA molecules (ctDNA or microbial DNA) within the total cfDNA population, which is predominantly derived from host cells [73] [20]. In cancer patients, ctDNA can represent less than 0.1% of total cfDNA, particularly in early-stage disease or minimal residual disease monitoring [72] [74]. Similarly, microbial cfDNA in bloodstream infections exists against an overwhelming background of human DNA [72] [75]. This signal-to-noise problem demands specialized enrichment strategies at both the wet-lab and computational levels to achieve clinically meaningful detection sensitivity.
The choice between analyzing whole-cell DNA (wcDNA) versus cell-free DNA (cfDNA) represents a fundamental methodological crossroads in next-generation sequencing (NGS) for chemogenomic studies [75] [76]. wcDNA sequences intact cellular genomes, while cfDNA targets short, fragmented DNA released into bodily fluids through apoptosis, necrosis, and other cellular processes [18] [77]. Each approach presents distinct advantages and limitations for detecting low-abundance targets, which this guide will explore through comparative experimental data and technical protocols.
gDNA vs. cfDNA NGS: A Technical Comparison
Fundamental Methodological Differences
The pre-analytical phases for gDNA (including wcDNA) and cfDNA diverge significantly, impacting downstream sensitivity for rare targets [18]. gDNA protocols begin with cellular lysis to release intact genomic DNA, often requiring fragmentation to achieve appropriate sequencing library sizes [18]. In contrast, cfDNA is naturally fragmented (typically ~167 bp, corresponding to nucleosomal DNA) and is extracted from acellular biofluids like blood plasma, avoiding the need for mechanical or enzymatic fragmentation [18] [77].
The analytical and post-analytical stages for both DNA types utilize similar NGS technologies, including quantitative PCR (qPCR), droplet digital PCR (ddPCR), and next-generation sequencing (NGS) [18]. However, the interpretation of results differs substantially, as cfDNA analysis must account for its distinct fragmentation patterns and mixture of cellular origins [78].
Table 1: Comparison of Modern Techniques for Detecting Cancer Mutations
| Parameter | Sanger Sequencing | NGS | qPCR | FISH/CISH |
|---|---|---|---|---|
| Biopsy Type | gDNA/cfDNA | gDNA/cfDNA | gDNA/cfDNA | gDNA in fixated cells only |
| Sequence Information | Partial sequence | Complete sequence | Partial sequence | Point mutation |
| Time of Analysis | 7 days | 3 days | 4 hours | 4 hours |
| Detection Precision | Nucleotide resolution | Nucleotide resolution | Mutation resolution | Mutation resolution |
| Multiplexing Capability | Limited | High | Limited | Limited (FISH only) |
| Cost (High-Throughput) | High | Low | Low | Medium |
Comparative Performance in Clinical Studies
Recent clinical studies directly comparing wcDNA and cfDNA metagenomic NGS (mNGS) demonstrate distinct performance profiles for pathogen detection. A 2025 analysis of 125 clinical body fluid samples found that wcDNA mNGS showed significantly higher sensitivity for pathogen detection (74.07%) compared to cfDNA mNGS, though with compromised specificity [75]. The mean proportion of host DNA in wcDNA mNGS was 84%, significantly lower than the 95% observed in cfDNA mNGS, potentially contributing to its enhanced sensitivity for certain pathogens [75].
However, this advantage is pathogen-dependent. A 2022 study on pulmonary infections found cfDNA mNGS demonstrated superior detection for certain pathogen categories, identifying 31.8% of fungi, 38.6% of viruses, and 26.7% of intracellular microbes that were missed by wcDNA mNGS [79]. This suggests cfDNA better captures pathogens that reside intracellularly or release DNA into biofluids.
For cancer detection, a 2024 study evaluating infected body fluids concluded that combined cfDNA and cellular DNA mNGS provided higher diagnostic efficacy (ROC AUC: 0.8583) than either method alone [76].
Diagram 1: Comparative Workflows for cfDNA and wcDNA Analysis
Advanced Techniques for Target Enrichment
Molecular Barcoding and Error Suppression
The low fractional abundance of ctDNA necessitates ultra-sensitive detection methods. Molecular barcoding, also known as unique molecular identifiers (UMIs), has emerged as a powerful technique to overcome sequencing errors and enable detection of variants at frequencies as low as 0.02% [73] [74]. This approach involves tagging individual DNA molecules with unique barcodes before amplification and sequencing, allowing bioinformatic consensus generation to distinguish true mutations from PCR or sequencing errors [73].
The CyclomicsSeq technique exemplifies this approach, using circularization and concatemerization of short DNA molecules with nanopore consensus sequencing to achieve dramatically improved accuracy [74]. Testing demonstrated this method could reduce the single-nucleotide false positive rate from approximately 1.84% with single copies to 0.16% with consensus calling from multiple copies [74].
Fragmentomics and Epigenetic Profiling
An emerging frontier in cfDNA analysis leverages the non-random fragmentation patterns of cfDNA, known as "fragmentomics," to infer epigenetic and transcriptional information [78] [77]. Cancer-derived cfDNA fragments retain nucleosome positioning patterns characteristic of their tissue of origin, enabling detection without relying solely on genetic mutations [78].
A 2025 study evaluated 13 different fragmentomics metrics on targeted sequencing panels and found that normalized fragment read depth across all exons provided the best performance for predicting cancer types and subtypes (average AUROC: 0.943) [78]. Other valuable metrics included Shannon entropy of fragment sizes and end motif diversity scores [78].
Machine learning approaches applied to fragmentomics data have demonstrated particular promise. XGBoost models trained on cell type-specific open chromatin regions improved cancer detection accuracy by leveraging differential cfDNA enrichment patterns at cancer-specific regulatory elements [77].
Microbial DNA Enrichment Strategies
For microbial cfDNA detection, specialized laboratory techniques can enhance sensitivity. Single-stranded DNA (ssDNA) library preparation has been shown to recover microbial cfDNA fragments with 71-fold greater efficiency compared to double-stranded DNA library preparation techniques [72]. Additionally, since microbial cfDNA is likely non-nucleosomal, size-based enrichment methods could potentially increase yield if microbial cfDNA size profiles were established [72].
Computational decontamination methods are equally critical, using "blacklisting" of contaminating microbes identified in negative controls or source tracking algorithms to model contamination contributions [72]. These approaches have demonstrated improved classification of melanoma versus control using microbial cfDNA signatures [72].
Table 2: Performance Comparison of DNA Analysis Methods in Clinical Studies
| Study & Year | Sample Type | Method | Sensitivity | Specificity | Key Finding |
|---|---|---|---|---|---|
| He et al., 2022 [79] | BALF (130 patients) | cfDNA mNGS | 91.5% Detection Rate | - | Superior for fungi, viruses, intracellular microbes |
| wcDNA mNGS | 83.1% Detection Rate | - | Lower detection of low-abundance pathogens | ||
| Comparative Analysis, 2025 [75] | Body fluids (125 samples) | wcDNA mNGS | 74.07% | 56.34% | Higher sensitivity but compromised specificity |
| cfDNA mNGS | - | - | Higher host DNA (95% vs 84%) | ||
| Journal of Advanced Research, 2024 [76] | Body fluids (248 specimens) | Combined cfDNA + cellular DNA | ROC AUC: 0.8583 | - | Superior to either method alone |
| cfDNA mNGS | ROC AUC: 0.8041 | - | Better for viruses | ||
| Cellular DNA mNGS | ROC AUC: 0.7545 | - | Better for high host background |
Experimental Protocols for Enhanced Detection
CyclomicsSeq for Ultra-Sensitive ctDNA Detection
The CyclomicsSeq protocol enables accurate detection of TP53 mutations at frequencies as low as 0.02% through molecular barcoding and consensus sequencing [74]:
Circularization: Target DNA regions (e.g., TP53 amplicons) are circularized using specialized backbone adapters containing barcodes and restriction sites.
Rolling Circle Amplification (RCA): Circularized molecules undergo RCA to generate long concatemers containing multiple copies of the original insert.
Nanopore Sequencing: Concatemers are sequenced using Oxford Nanopore technology, producing reads with alternating backbone and insert sequences.
Consensus Calling: Computational analysis splits reads based on backbone sequences and generates consensus sequences from multiple copies, reducing the single-nucleotide false positive rate by approximately 60-fold [74].
This approach has been successfully applied to monitor tumor burden during treatment for head-and-neck cancer patients, demonstrating clinical utility for liquid biopsy monitoring [74].
Fragmentomics Analysis from Targeted Panels
Fragmentomics analysis can be applied to standard targeted cfDNA panels without requiring whole-genome sequencing [78]:
Fragment Size Distribution: Calculate the proportion of fragments in different size bins (<150 bp, 150-165 bp, etc.), with increased fractions of small fragments (<150 bp) associated with cancer [78].
Normalized Depth Metrics: Compute fragment counts normalized to both sequencing depth and region size across all exons, which has demonstrated the strongest predictive power for cancer detection [78].
End Motif Analysis: Determine the diversity of 4-mer sequences at fragment ends using the end motif diversity score (MDS), which reflects non-random cleavage patterns.
TFBS and Open Chromatin Entropy: Analyze fragments overlapping transcription factor binding sites (TFBS) and open chromatin regions defined by ATAC-seq data, calculating fragment size diversity at these regulatory elements.
Machine Learning Integration: Train ensemble models (e.g., GLMnet elastic net) using multiple fragmentomics features to predict cancer type and origin.
Combined cfDNA and wcDNA mNGS Protocol
For comprehensive pathogen detection, a combined protocol maximizes sensitivity across diverse microbial types [76]:
Sample Processing: Centrifuge body fluid samples at 20,000 × g for 15 minutes to separate supernatant from cellular pellet [75].
cfDNA Extraction: Extract cfDNA from 400 μL supernatant using specialized kits (e.g., VAHTS Free-Circulating DNA Maxi Kit) [75].
wcDNA Extraction: Lyse the cellular pellet with bead-beating, followed by DNA extraction using standard kits (e.g., Qiagen DNA Mini Kit) [75].
Dual Library Preparation: Prepare separate sequencing libraries from cfDNA and wcDNA fractions using ultra-low input library preparation kits.
Sequencing and Analysis: Sequence both libraries simultaneously and analyze separately before combining results, applying stringent criteria for pathogen identification (z-score >3 compared to negative controls, reads mapping to multiple genomic regions) [75].
Essential Research Reagent Solutions
Table 3: Key Reagents and Kits for cfDNA and gDNA Studies
| Reagent Category | Specific Product | Application | Performance Notes |
|---|---|---|---|
| cfDNA Extraction | VAHTS Free-Circulating DNA Maxi Kit | Plasma cfDNA isolation | Optimized for low-concentration, fragmented DNA |
| wcDNA Extraction | Qiagen DNA Mini Kit | Cellular DNA from pellets | Bead-beating enhances lysis efficiency |
| Library Preparation | VAHTS Universal Pro DNA Library Prep Kit | NGS library construction | Compatible with both gDNA and cfDNA |
| Ultra-Low Input Library | QIAseq Ultralow Input Library Kit | Limited sample applications | Essential for low-yield cfDNA samples |
| Target Enrichment | Custom targeted panels (Tempus xF, Guardant360 CDx) | ctDNA mutation detection | 55-309 cancer genes with high coverage depth |
The comparative analysis of gDNA-based versus cfDNA-based NGS reveals a complex landscape where methodological choice significantly impacts detection capability for low-abundance targets. wcDNA mNGS demonstrates advantages for certain bacterial pathogens, while cfDNA mNGS excels in detecting viruses, fungi, and intracellular microbes [75] [79]. For ctDNA analysis, fragmentomics and molecular barcoding techniques have dramatically improved sensitivity without requiring additional sequencing [78] [74].
The emerging paradigm favors integrated approaches, with evidence suggesting combined cfDNA and cellular DNA analysis provides superior diagnostic efficacy compared to either method alone [76]. Furthermore, machine learning applied to multi-modal data—including genetic, fragmentomic, and epigenetic features—represents the most promising frontier for overcoming the fundamental challenge of low abundance in cfDNA analysis [78] [77].
As these technologies mature, standardization of pre-analytical protocols and computational pipelines will be essential for translating cfDNA analysis from research settings into routine clinical practice, particularly for early cancer detection and monitoring of minimal residual disease [20]. The techniques detailed in this guide provide a foundation for researchers and clinicians to navigate this rapidly evolving landscape and implement optimized protocols for their specific applications.
The overwhelming abundance of host DNA in clinical samples can obscure microbial signals, but advanced host depletion technologies are revolutionizing the sensitivity of genomic DNA-based pathogen detection.
gDNA-based vs. cfDNA-based mNGS for Pathogen Detection
The choice between genomic DNA (gDNA) and cell-free DNA (cfDNA) as the starting material for metagenomic next-generation sequencing (mNGS) significantly impacts the efficacy of host depletion methods and the subsequent diagnostic yield, particularly in sepsis.
| Feature | gDNA-based mNGS (with Host Depletion) | cfDNA-based mGS |
|---|---|---|
| Sample Origin | Cellular pellet (intact microbial cells) [80] | Plasma (fragmented DNA) [80] |
| Amenable to Pre-extraction Host Depletion | Yes (e.g., filtration, lysis) [80] | No [80] |
| Pathogen Detection Sensitivity | High; significantly enhanced by host depletion [80] | Inconsistent; not significantly enhanced by filtration [80] |
| Average Microbial Read Enrichment (vs. unfiltered) | > tenfold (e.g., 9,351 vs. 925 RPM) [80] | Minimal (e.g., 1,488 vs. 1,251 RPM) [80] |
| Key Advantage | Allows for physical enrichment of intact microbes before DNA extraction. | Avoids lysis of host cells, simplifying initial steps. |
The core challenge in blood samples is the overwhelming abundance of human DNA, which consumes valuable sequencing capacity and obscures pathogenic signals [80]. A study on sepsis diagnosis demonstrated that while cfDNA-based mNGS showed inconsistent sensitivity, a workflow using gDNA combined with a novel host depletion filter detected all expected pathogens in 100% (8/8) of clinical samples [80].
Performance Comparison of Host Depletion Methods
Various host depletion strategies have been developed, falling into two main categories: pre-extraction methods that physically remove host cells before DNA extraction, and post-extraction methods that remove host DNA biochemically after extraction.
| Method | Technology Type | Key Performance Metrics | Key Limitations |
|---|---|---|---|
| Novel ZISC-based Filtration [80] | Pre-extraction (Physical) | >99% WBC removal; >10x microbial read enrichment; 100% detection in clinical sepsis samples [80] | Requires intact microbial cells; not suitable for cfDNA [80] |
| Saponin Lysis + Nuclease (S_ase) [81] | Pre-extraction (Chemical/Enzymatic) | High host DNA removal (to ~0.01% of original); 55.8-fold increase in microbial reads in BALF [81] | Can significantly diminish certain commensals and pathogens (e.g., Prevotella spp., Mycoplasma pneumoniae) [81] |
| Commercial Kits (e.g., HostZERO) [81] | Pre-extraction (Chemical/Enzymatic) | High host DNA removal (to ~0.01% of original); 100.3-fold increase in microbial reads in BALF [81] | Introduces contamination; alters microbial abundance; variable bacterial retention [81] |
| CpG Methylation-Based Enrichment [80] | Post-extraction (Biochemical) | N/A | Less efficient, more labor-intensive; poor performance in respiratory samples [80] [81] |
A comprehensive benchmarking study evaluating seven host depletion methods for respiratory samples revealed a critical trade-off: while all methods significantly increased microbial reads and taxonomic richness, they also introduced contamination, altered microbial abundance, and selectively diminished certain commensals and pathogens [81]. This underscores the importance of selecting a method with balanced performance for the specific sample type and research question.
Detailed Experimental Protocols
Protocol 1: ZISC-based Filtration for gDNA-based mNGS from Blood
This protocol is adapted from a study optimizing mNGS for sepsis, which achieved >99% host cell removal and a tenfold enrichment of microbial reads [80].
- Sample Preparation: Collect whole blood into appropriate anticoagulant tubes. For the validation experiment, samples can be spiked with a known quantity of microbial culture (e.g., 10⁴ CFU/mL of E. coli or a reference microbial community) [80].
- Host Cell Depletion: Transfer approximately 4 mL of whole blood into a syringe securely connected to the ZISC-based fractionation filter (e.g., Devin filter, Micronbrane). Gently depress the plunger to push the blood sample through the filter into a clean collection tube [80].
- Centrifugation: Subject the filtered blood to low-speed centrifugation (e.g., 400g for 15 minutes at room temperature) to isolate the plasma from the cellular pellet [80].
- Microbial Pellet Enrichment: Transfer the plasma to a new tube and perform high-speed centrifugation (e.g., 16,000g) to obtain a pellet enriched with microbial cells [80].
- DNA Extraction: Extract genomic DNA from the pellet using a specialized microbial DNA enrichment kit (e.g., ZISC-based Microbial DNA Enrichment Kit) [80].
- Library Preparation & Sequencing: Proceed with standard mNGS library preparation (e.g., using an Ultra-Low Library Prep Kit) and sequence on a platform such as Illumina NovaSeq6000, aiming for at least 10 million reads per sample [80].
Protocol 2: DNA Coating-Based Assay for Protein-DNA Interaction Studies
While not a direct host depletion technique, DNA coating is a relevant advanced technology for studying protein-DNA interactions that could be adapted for pathogen detection. This protocol demonstrates a simple, efficient method for identifying specific Protein-DNA interactions [82].
- DNA Preparation: Isolate genomic DNA from host cells (e.g., Human Dermal Fibroblasts). Digest the DNA with restriction enzymes (e.g., Rsa I and Hinf I) to isolate specific fragments, such as telomeric repeats [82].
- DNA Coating: Dilute 5 μg of the restricted DNA in 1 mL of TE buffer and mix with 1 mL of DNA Coating Solution. Incubate the mixture for 10 minutes at room temperature [82].
- Plate Coating: Add the DNA-coating solution mixture to a microtiter plate (e.g., a black well plate). Incubate the plate at room temperature for 1–2 hours with gentle shaking [82].
- Washing: Wash the microtiter plate three times with 1X TBST buffer to remove any uncoated DNA fragments [82].
- Protein Binding: Add prepared protein lysate (e.g., 10 μg from host or microbial cells) to each well and incubate at 4°C for 2 hours to allow specific Protein-DNA interactions to occur [82].
- Immunodetection: Wash the plate to remove unbound proteins. Incubate with a primary antibody (e.g., anti-lamin A or anti-trf2 at 1:100 dilution) overnight at 4°C, followed by incubation with a fluorophore-conjugated secondary antibody (e.g., Alexa Fluor 488 or 647 at 1:1000 dilution) for 2 hours in the dark [82].
- Detection: Measure the fluorescence using a multi-plate reader at the appropriate excitation and emission wavelengths for the fluorophore [82].
The Scientist's Toolkit: Essential Research Reagents
The following table lists key reagents and their functions used in the featured host depletion and DNA interaction protocols.
| Item | Function / Application |
|---|---|
| ZISC-based Filtration Device (e.g., Devin filter) | Selectively binds and retains host leukocytes from whole blood, allowing microbes to pass through for enrichment [80]. |
| DNA Coating Solution | Facilitates the immobilization of specific DNA fragments onto microtiter plate surfaces for interaction studies [82]. |
| Restriction Enzymes (e.g., Rsa I, Hinf I) | Used to digest genomic DNA into specific fragments, such as telomeric repeats, for targeted protein-binding assays [82]. |
| Microbial DNA Enrichment Kit | Optimized for extracting high-quality genomic DNA from microbial pellets obtained after host cell depletion [80]. |
| Fluorophore-conjugated Antibodies | Enable sensitive detection of specific proteins bound to coated DNA in antibody-mediated immunodetection protocols [82]. |
Key Implementation Considerations
When integrating these technologies into a chemogenomic research pipeline, several factors are critical for success. The sample type is a primary determinant; methods like ZISC filtration are ideal for whole blood, while optimized saponin lysis may be better suited for complex respiratory samples like BALF [80] [81].
Researchers must be aware of the inherent taxonomic biases introduced by host depletion. All methods can alter the apparent microbial composition, with some significantly depleting specific pathogens or commensals, potentially leading to false-negative results or skewed ecological data [81].
Finally, the choice between gDNA and cfDNA remains fundamental. The superior performance of host-depleted gDNA for detecting intracellular and particle-associated pathogens makes it the preferred choice for many acute infections, while cfDNA may capture a broader spectrum of nucleic acids from various sources [80].
In the realm of chemogenomic studies and drug development, next-generation sequencing (NGS) has become an indispensable tool for molecular profiling and biomarker discovery. The reliability of NGS data, however, is fundamentally dependent on the quality and quantity of the input DNA, which is influenced by critical pre-analytical factors. Two primary DNA sources—genomic DNA (gDNA) from formalin-fixed paraffin-embedded (FFPE) tissues and cell-free DNA (cfDNA) from liquid biopsies—each present unique challenges and considerations. For gDNA, the integrity of nucleic acids is often compromised by tissue fixation methods and prolonged storage, while cfDNA analysis is challenged by low abundance and the need for highly sensitive detection methods. This guide objectively compares the performance of various DNA extraction technologies and evaluates the impact of storage conditions, providing researchers with evidence-based recommendations to optimize pre-analytical workflows for robust NGS results in chemogenomic research.
Performance Comparison of DNA Extraction Methods
gDNA Extraction from FFPE Tissues
FFPE tissues are widely available and invaluable for clinical and epidemiological genetic research, but the extraction of high-quality gDNA requires careful protocol optimization.
Table 1: Comparison of DNA Extraction Kits and Methods for FFPE Tissues
| Extraction Kit/Method | Sample Input | Key Protocol Modifications | Median DNA Yield | Key Findings |
|---|---|---|---|---|
| Qiagen GeneRead DNA FFPE Kit (Standard Protocol) [83] | 10µm section | Standard deparaffinization solution, 1h proteinase K digestion | Low yield | Poor DNA integrity due to prolonged preservation under suboptimal conditions |
| Qiagen GeneRead DNA FFPE Kit (Adapted Protocol) [83] | 4-6 x 10µm sections | Heat deparaffinization; prolonged (16h) proteinase K digestion | 2.82 - 4.34 µg | Superior yields; feasible for clinical and epidemiological studies |
| Slide Scraping Method (Adapted Qiagen Protocol) [83] | Scraped tissue from HE-stained slides | Scraping tissue from slides; prolonged (16h) proteinase K digestion | Reliable yields | Recommended as a reliable source of gDNA; allows pathologist-selected tumor regions |
Experimental Protocol for FFPE gDNA Extraction (Adapted Method) [83]:
- Sample Preparation: Cut 4-6 sections of 10µm each from FFPE blocks. For smaller samples (<4 cm²), prefer 6 sections.
- Deparaffinization: Omit organic solvent-based deparaffinization. Instead, use prolonged heat exposure.
- Lysis: Add a mixture of 55 µL RNase-free water, 25 µL cell lysis buffer (FTB), and 20 µL proteinase K to samples.
- Digestion: Vortex and centrifuge (15,093 g for 1 min), then incubate at 56°C for 16 hours (overnight).
- Incubation: Subsequently, incubate samples at 90°C for 1 hour.
- Purification: Follow standard purification steps using a QIAamp MinElute column and wash buffers.
- Elution: Elute DNA in 30 µL of elution buffer.
cfDNA Extraction from Plasma
For liquid biopsy applications, successful cfDNA extraction is critical for detecting tumor-derived DNA, which often represents only a small fraction of total circulating DNA.
Table 2: Performance of cfDNA Analysis in Clinical Studies
| Study Context | Extraction Method | Detection Rate | Key Utility | Sequencing Platform & Kit |
|---|---|---|---|---|
| Advanced Cancers (Early phase trials) [84] | SnoMag Circulating DNA kit | 59% (23/39 pts) had ≥1 mutation at baseline | Monitoring clonal response to targeted therapy; associated with time to progression | Ion Torrent PGM; Cancer Hotspot Panel v2 |
| NSCLC at Diagnosis [85] | Not Specified | 62% had ≥1 driver alteration | Molecular profiling when tissue is unavailable | NextSeq 550 (Illumina); Avenio ctDNA Expanded Kit |
| Healthy Individuals [34] | MagMax Cell-Free Total Nucleic Acid Isolation Kit | Technically feasible | Established workflow for low VAF detection (as low as 0.08%) | Ion Torrent; Oncomine assays |
Experimental Protocol for cfDNA NGS Analysis [84]:
- Sample Collection: Collect 20 mL of blood in CPT tubes. Process within two hours through centrifugation to isolate plasma.
- cfDNA Extraction: Extract cfDNA from 2 mL of plasma using the SnoMag Circulating DNA kit or similar.
- Library Preparation: Use 3 ng of cfDNA for library generation with targeted panels (e.g., Ion AmpliSeq Cancer Hotspot Panel v2).
- Template Preparation & Sequencing: Prepare templates using the OneTouch 2 instrument and sequence on the Ion Torrent PGM platform using a 318 Chip v2, aiming for a mean coverage of at least 500X.
Comparison of Lysis Methods for Microbial DNA
The lysis method is a critical differentiator among DNA extraction kits, significantly impacting the representation of Gram-positive bacteria in microbial community studies.
Table 3: Impact of Lysis Method on Taxonomic Identification in Mock Communities [86]
| DNA Extraction Kit | Lysis Method | Purification Method | Performance on Zymo Mock (8 species) | Performance on ESKAPE Mock (6 species) |
|---|---|---|---|---|
| QIAamp PowerFecal Pro DNA Kit [86] | Chemical & Mechanical (bead beating) | Spin-column | Identified all 8 species | Identified all 6 species; best for AMR gene detection |
| QIAamp DNA Mini Kit [86] | Enzymatic (Lysozyme/Proteinase K) | Spin-column | Not specified | Lower aligned bases for Gram-positive species |
| Maxwell RSC Cultured Cells Kit [86] | Enzymatic (Lysozyme) | Magnetic beads | Not specified | Lower aligned bases for Gram-positive species |
Impact of Storage Conditions on DNA Integrity
Pre-analytical variables extend beyond the extraction bench, with storage time and conditions significantly impacting the success of downstream molecular analyses.
Key Evidence on Storage Time:
- A large study on FFPE blocks for ovarian cancer smMIP-based NGS analysis found that a time interval of ≤ 48 days between tumor specimen collection and analysis was significantly associated with successful sequencing (OR 2.05, 95% CI 1.07–3.93) compared to longer storage times [87].
- The same study reported a success rate of 88.3% for smMIP analyses, highlighting the importance of minimizing storage time to enhance efficiency and reduce costs [87].
The Scientist's Toolkit: Essential Research Reagents
Table 4: Key Reagent Solutions for DNA Extraction and Quality Control
| Reagent / Kit Name | Primary Function | Key Applications | Notable Features |
|---|---|---|---|
| QIAamp DNA Mini Kit [88] | Genomic DNA Purification | gDNA from tissues, swabs, blood, body fluids | Silica-membrane technology; spin-column format; hands-on time ~20 min |
| QIAamp PowerFecal Pro DNA Kit [86] | Microbial DNA Purification | Stool, complex microbial communities | Chemical & mechanical lysis (bead beating); effective for Gram-positive and -negative bacteria |
| MagMax Cell-Free Total Nucleic Acid Isolation Kit [34] | cfDNA Extraction | Plasma cfDNA for liquid biopsy | Magnetic bead-based; suitable for low-abundance cfDNA |
| SnoMag Circulating DNA Kit [84] | cfDNA Extraction | Plasma cfDNA for oncology studies | Optimized for low plasma volumes (2 mL) |
| sbeadex Technology [89] | Nucleic Acid Purification | Broad range: blood, saliva, tissues | Magnetic particle-based; automated high-throughput; no organic solvents in wash buffers |
| Agencourt AMPure XP [34] | PCR Purification | NGS library clean-up | Magnetic beads; size selection and purification of amplicons |
Visual Workflows for DNA Analysis
gDNA and cfDNA NGS Analysis Workflows
The following diagrams illustrate the core workflows for processing gDNA from FFPE tissues and cfDNA from liquid biopsies, highlighting the critical pre-analytical steps.
Critical Quality Control Checkpoints
Quality control is an essential component of any NGS workflow, with specific metrics for assessing sample integrity.
Optimizing pre-analytical variables is paramount for generating reliable NGS data in chemogenomic studies. The selection of DNA extraction methods should be guided by the sample type: for FFPE tissues, adapted protocols with increased sectioning and prolonged proteinase K digestion significantly enhance gDNA yields; for liquid biopsies, specialized cfDNA kits with mechanical lysis provide more comprehensive representation of microbial communities or tumor-derived DNA. Furthermore, storage time is a critical but often overlooked factor, with analysis within 48 days of specimen collection significantly improving success rates. By implementing these evidence-based practices and maintaining rigorous quality control throughout the workflow, researchers can ensure the integrity of their DNA samples, thereby maximizing the value of downstream NGS analyses in drug development and personalized medicine.
In chemogenomic studies and cancer research, the analysis of cell-free DNA (cfDNA) presents a significant challenge: the reliable detection of very low-frequency variants. Circulating tumor DNA (ctDNA) can represent as little as 0.01% of the total cell-free DNA found in blood, creating a "needle in a haystack" scenario that demands exceptionally sensitive detection methods [90]. This limit of detection (LoD) is crucial for non-invasive cancer detection, monitoring minimal residual disease (MRD), and assessing therapy response. Next-generation sequencing (NGS) technologies have dramatically improved our capacity to detect these low-abundance variants, but they introduce their own technical artifacts, primarily through PCR amplification biases and sequencing errors. Unique Molecular Identifiers (UMIs) have emerged as a powerful molecular barcoding technology that, when combined with deep sequencing, enables researchers to distinguish true biological variants from technical noise, thereby significantly improving the sensitivity and specificity of liquid biopsy approaches [91] [92] [90].
Understanding Unique Molecular Identifiers (UMIs)
What Are UMIs and How Do They Work?
Unique Molecular Identifiers (UMIs), also known as molecular barcodes or random barcodes, are short random nucleotide sequences (typically 4-12 base pairs) that are ligated to each individual DNA or cDNA molecule in a sample library before any PCR amplification steps occur [92] [93]. This pre-amplification tagging strategy creates a unique "molecular passport" for every original molecule, allowing all subsequent PCR copies to be traced back to their single source molecule.
The fundamental power of UMIs lies in their ability to enable accurate bioinformatic identification of PCR duplicates. During library preparation, PCR amplification is necessary to generate sufficient material for sequencing, but it introduces two significant problems: amplification bias (where some molecules are amplified more efficiently than others) and the introduction of polymerase errors that can be misclassified as true variants [92]. With UMI tagging, bioinformatics pipelines can group reads originating from the same original molecule (identified by their shared UMI) into "read families." These families can then be consensus-collapsed to generate a single, high-quality read that represents the original molecule, effectively filtering out both PCR duplicates and random amplification errors [91] [93].
UMI Implementation in NGS Workflows
UMIs can be incorporated at different stages of library preparation, with the general principle being that earlier incorporation provides more accurate quantification. In RNA-seq experiments, UMIs are often introduced during the reverse transcription step as part of the oligo(dT) primers, while in DNA applications, they're typically added during initial adapter ligation [93]. The random nature of UMI sequences is crucial – a 10-nucleotide random UMI can generate over 1 million unique sequences (4^10 = 1,048,576), providing a diverse barcode space that minimizes the chance of two molecules receiving the same UMI by random chance [93].
UMIs in Action: Experimental Evidence and Performance Data
Impact on Single-Cell RNA Sequencing
The critical importance of UMIs is particularly evident in single-cell RNA sequencing (scRNA-seq). A comprehensive 2017 study comparing various scRNA-seq protocols revealed striking differences between UMI-based and full-length transcript methods [94]. Researchers analyzing mouse embryonic stem cells (mESCs) found that protocols incorporating UMIs eliminated gene length bias, a significant technical artifact where longer genes tend to have higher counts and lower dropout rates in full-length transcript protocols [94].
Specifically, the study demonstrated that genes detected exclusively in UMI datasets tended to be shorter, while those detected only in full-length datasets tended to be longer. This fundamental difference in detection bias has profound implications for accurate transcript quantification. UMI protocols revealed that shorter genes are as highly expressed as longer genes, and dropout rates were mostly uniform across genes of varying length, providing a more biologically accurate representation of the transcriptome [94].
Enhancing Sensitivity for Rare Variant Detection
The superior sensitivity of UMI-enhanced NGS is clearly demonstrated in HIV research, where detecting minor viral variants is crucial for treatment planning. A 2024 study comparing next-generation sequencing with Sanger sequencing for HIV-1 pretreatment drug resistance testing found that NGS exhibited 87.0% sensitivity at a 5% detection threshold, significantly outperforming conventional Sanger sequencing [95]. The consistency between methods varied by drug class, exceeding 90% for protease inhibitors (PIs) and integrase strand transfer inhibitors (INSTIs), but was lower for nucleotide reverse transcriptase inhibitors (NRTIs) (61.25% to 87.50%) [95].
Another performance comparison of NGS platforms for determining HIV-1 coreceptor use found that the Illumina MiSeq system could detect minor CXCR4-using variants at 0.5-1% frequency, outperforming the 454 GS-Junior system (1-5% detection threshold) [96]. This enhanced sensitivity is critical for clinical decision-making regarding CCR5 antagonist treatments, as minor CXCR4-using variants can cause treatment failure [96].
Table 1: Performance Comparison of Sequencing Methods with and without UMIs
| Application | Method | Detection Limit | Key Advantage | Reference |
|---|---|---|---|---|
| HIV-1 Drug Resistance | NGS with UMIs | 5% threshold | 87.0% sensitivity, detects minor variants | [95] |
| HIV-1 Tropism | Illumina MiSeq | 0.5-1% | Detects minor CXCR4-using variants | [96] |
| HIV-1 Tropism | 454 GS-Junior | 1-5% | Lower sensitivity compared to MiSeq | [96] |
| scRNA-seq | Full-length protocol | N/A | Exhibits gene length bias | [94] |
| scRNA-seq | UMI protocol | N/A | Eliminates gene length bias | [94] |
Error Correction and Quantification Accuracy
The error-correcting capability of UMIs substantially improves sequencing accuracy. In standard NGS without UMIs, the error rate (combining PCR, sequencing, and base-calling errors) can be substantial. With UMI tagging, bioinformatic analysis can distinguish true mutations from technical artifacts by requiring that the same variant appear in multiple reads with different UMIs to be considered real [93].
This is particularly valuable for cfDNA-based cancer detection, where true low-frequency variants must be distinguished from artifacts introduced during library preparation and sequencing. The same mutation appearing in reads with different UMIs provides strong evidence for a true variant, whereas errors are typically random and unlikely to consistently affect multiple independent molecules [93].
gDNA-Based vs. cfDNA-Based NGS: Critical Considerations for Chemogenomic Studies
Sample Preparation and Quality Control
The pre-analytical phase is particularly critical for cfDNA analysis due to the low concentration and highly fragmented nature of cell-free DNA. CfDNA fragments typically range between 20 and 220 base pairs with a peak at 167 bp (the length of DNA wrapped around a single nucleosome) [90]. Proper blood collection tube selection is essential – while EDTA tubes require processing within 4 hours, specialized cell-free DNA BCTs (from manufacturers like Streck, Roche, or Qiagen) can stabilize samples for up to 14 days at room temperature by preventing leukocyte lysis and genomic DNA contamination [90].
A two-step centrifugation protocol is recommended: an initial slow spin (1200–2000× g for 10 minutes) to remove blood cells, followed by a high-speed centrifugation (12,000–16,000× g for 10 minutes) to remove cellular debris [90]. For cfDNA extraction, studies have shown that Qiagen kits (QIAamp circulating nucleic acid kit) generally provide the best performance compared to other commercial purification kits [90].
Limit of Detection Comparison
The fundamental difference in sample characteristics between gDNA and cfDNA directly impacts the achievable limit of detection:
Table 2: gDNA vs. cfDNA Characteristics Impacting Limit of Detection
| Parameter | gDNA-Based NGS | cfDNA-Based NGS |
|---|---|---|
| Input Material | High molecular weight DNA | Highly fragmented (20-220 bp) |
| Variant Allele Frequency | Typically 50% (heterozygous) or 100% (homozygous) | Can be as low as 0.01% |
| Major Challenge | Coverage uniformity | Input material limitation |
| UMI Benefit | Moderate (error correction) | Critical (false positive reduction) |
| Typical Applications | Germline variant detection, whole genome sequencing | Liquid biopsy, cancer monitoring, MRD detection |
For cfDNA applications, the combination of UMIs with deep sequencing is particularly powerful. The extremely low variant allele frequencies (VAFs) in ctDNA require both the error correction provided by UMIs and the statistical power of deep sequencing to confidently distinguish true variants from background noise [90].
Essential Research Reagent Solutions
Successful implementation of UMI-based cfDNA sequencing requires careful selection of reagents and tools throughout the workflow:
Table 3: Essential Research Reagents for UMI-Enhanced cfDNA Sequencing
| Reagent/Tool | Function | Key Considerations |
|---|---|---|
| Cell-Free DNA BCTs (Streck, Roche, Qiagen) | Blood sample collection and stabilization | Prevent gDNA contamination; enable room temperature storage |
| cfDNA Extraction Kits (QIAamp circulating nucleic acid kit) | Isolation of cfDNA from plasma | Maximize yield; maintain fragment integrity |
| UMI Adapter Systems (Twist Bioscience) | Ligation of unique molecular identifiers | UMI length (8-12 bp); compatibility with automation |
| Target Enrichment | Selection of genomic regions of interest | Hybridization-based capture; amplicon approaches |
| High-Fidelity Polymerase | PCR amplification during library prep | Reduce introduction of errors during amplification |
| Bioinformatic Tools | UMI consensus calling; variant detection | Error correction algorithms; family size filtering |
Commercial UMI adapter systems, such as those from Twist Bioscience, offer empirically tested solutions with 10-12 bp UMIs that are compatible with automated workflows in 96- and 384-well formats [97]. For methylation studies, specialized methylated UMI adapters are available that demonstrate 15% reduction in false duplication calls in low-diversity samples [97].
Experimental Protocols for UMI-Enhanced cfDNA Sequencing
Sample Processing and Library Preparation
Blood Collection and Plasma Separation: Collect blood in cell-free DNA BCTs. Process within recommended timeframe (varies by tube type). Perform initial centrifugation at 1200–2000× g for 10 minutes at 4°C or room temperature. Carefully transfer plasma without disturbing buffy coat, then perform high-speed centrifugation at 12,000–16,000× g for 10 minutes [90].
cfDNA Extraction: Use validated cfDNA extraction kits (e.g., QIAamp circulating nucleic acid kit) according to manufacturer's instructions. Quantify cfDNA using sensitive methods appropriate for fragmented DNA (e.g., capillary electrophoresis) [90].
Library Preparation with UMI Ligation: Fragment DNA if necessary (though cfDNA is already fragmented). Repair ends and add A-tails. Ligate UMI-containing adapters to DNA fragments. Use adapter systems that combine UMIs with unique dual indexes (UDIs) to prevent index hopping [97].
Target Enrichment (if applicable): For targeted sequencing, perform hybrid capture or amplicon-based enrichment. Ensure UMIs are preserved through enrichment steps.
Library Amplification: Use minimal PCR cycles (typically 8-12) to amplify the library while maintaining representation. Use high-fidelity polymerase to minimize errors [92].
Bioinformatics Analysis Workflow
The computational analysis of UMI-tagged sequencing data requires specialized processing:
UMI Extraction and Demultiplexing: Identify UMI sequences and sample barcodes in read headers. Demultiplex samples based on their dual indexes.
Read Alignment: Align reads to reference genome using standard aligners (BWA-MEM, Bowtie2).
Read Family Grouping: Group reads by their UMI sequence and alignment coordinates to form "read families."
Consensus Building: Generate consensus sequence for each read family, requiring support from multiple reads to call bases.
Variant Calling: Identify variants from consensus reads using standard variant callers, applying appropriate filters for UMI-supported data.
The integration of Unique Molecular Identifiers with deep sequencing technologies represents a transformative advancement for improving the limit of detection in genomic studies, particularly for cfDNA-based liquid biopsy applications. UMIs address fundamental limitations of conventional NGS by enabling precise identification of PCR duplicates and providing a mechanism for distinguishing true biological variants from technical artifacts [91] [92] [93].
The experimental evidence consistently demonstrates that UMI-enhanced sequencing achieves superior sensitivity for detecting low-frequency variants – critical for monitoring minimal residual disease in oncology, detecting emerging drug-resistant variants in infectious diseases, and accurately quantifying transcript expression without gene length bias [94] [95] [96]. As sequencing technologies continue to evolve toward the $100 genome and multiomic analyses become standard, UMI methodologies will play an increasingly essential role in ensuring that the data driving scientific discoveries and clinical decisions reflects biological reality rather than technical artifact [98].
For researchers designing chemogenomic studies, the implementation of robust UMI workflows – from proper sample collection through bioinformatic analysis – is no longer an optional optimization but a fundamental requirement for achieving the sensitivity and specificity needed to detect the subtle genomic signals that underlie disease mechanisms and therapeutic responses.
In chemogenomic studies and clinical cancer research, next-generation sequencing (NGS) of genomic DNA (gDNA) and cell-free DNA (cfDNA) has become indispensable for profiling tumor genomes and monitoring treatment response. However, a significant challenge complicating this analysis is the accurate distinction between true tumor-derived mutations and background noise originating from clonal hematopoiesis (CH). CH represents the age-related expansion of blood cell clones with specific somatic mutations that are unrelated to the solid tumor, yet these alterations can be detected in both tissue and blood sequencing assays, leading to potential misclassification [99] [100]. This distinction is not merely academic; it carries direct implications for patient management in clinical trials and drug development, as misattributed mutation origin can lead to incorrect therapy selection and skewed response assessments.
The prevalence of this issue is substantial. When using unpaired NGS tests—where a matched normal sample is not sequenced to filter out background mutations—mutations in genes frequently altered in CH were identified in 65% of clinical reports (1,139 out of 1,757 patients). Even when excluding TP53, a gene often mutated in solid tumors, these potential CH events were still reported in 35% of cases [99]. This high frequency underscores the critical need for robust experimental and bioinformatic strategies to differentiate the signal from the noise, ensuring that therapeutic decisions in chemogenomic studies are based on accurate molecular data.
Comparative Analysis: gDNA vs. cfDNA NGS for Mutation Detection
The choice between gDNA (often from tumor tissue) and cfDNA (from plasma) as a source material for NGS presents researchers with a trade-off between comprehensiveness and specificity, particularly concerning CH-derived noise. The table below summarizes the key performance characteristics and susceptibility to CH background noise for each approach.
Table 1: Performance comparison of gDNA-based and cfDNA-based NGS approaches
| Feature | gDNA-Based NGS (Tissue) | cfDNA-Based NGS (Plasma) |
|---|---|---|
| Primary Source | Tumor biopsy (single-site) | Circulating tumor DNA in plasma |
| Typical Panel Size | Large panels (e.g., 410 genes) [101] | Varies (targeted to large panels) [101] [4] |
| Sensitivity to CH | Higher (via admixed leukocytes in tumor biopsy) [99] | Lower (but CH mutations still present) [99] |
| Key Strength | Comprehensive genomic profile of biopsied site | Captures spatial and temporal heterogeneity [101] |
| Key Limitation | Inability to distinguish CH mutations in admixed blood cells [99] | Lower mutant allele frequency, requiring high depth of sequencing [101] |
| Concordance with Tumor | Gold standard for the biopsied region | Acceptable (e.g., 82% of recurrent mutations shared) [101] |
| Additional Info Captured | Limited to the biopsied site | Can reveal heterogeneity, identifying mutations not in tissue [101] |
Large-panel cfDNA NGS has been demonstrated as feasible in patients with advanced cancer, showing high concordance with both tumor tissue NGS and digital droplet PCR (ddPCR) for specific alterations like AKT1 E17K (r² = 0.976) [101]. Furthermore, cfDNA sequencing can capture additional tumor heterogeneity, identifying mutations not observed in the single-site tissue biopsy in 38% of patients [101]. This suggests that cfDNA profiling can offer a more complete picture of the tumor genome, complementing the information obtained from a standard tissue biopsy.
Experimental Data: Quantifying the Impact of Clonal Hematopoiesis
The confounding effect of CH is not a minor issue. A retrospective cohort study analyzing Foundation Medicine reports from two major cancer centers quantified the scope of the problem. By comparing mutations reported on unpaired clinical NGS tests with results from matched blood sequencing, the study was able to confirm the true origin of the reported variants.
Table 2: Prevalence and confirmation of clonal hematopoiesis mutations in unpaired NGS testing
| Gene Category | Reports with ≥1 Mutation (%) | Confirmed as True CH in Matched Blood (%) | Notes |
|---|---|---|---|
| All CH Genes (incl. TP53) | 65% (1,139/1,757) | 8% (18/226 of mutations tested) | TP53 is often mutated in solid tumors [99] |
| CH Genes (excl. TP53) | 35% (619/1,757) | Not separately quantified | Includes DNMT3A, TET2, ASXL1, etc. [99] |
| DNMT3A mutations | Not specified | 64% (7/11) | Majority are of CH origin [99] |
| TP53 mutations | Not specified | 4% (2/50) | Minority are of CH origin [99] |
The data reveal two critical points. First, mutations in CH-associated genes are very commonly reported. Second, the likelihood that a reported mutation is genuinely from CH, rather than the tumor, varies dramatically by gene. For instance, the majority of DNMT3A mutations were confirmed to be CH, whereas only a small minority of TP53 mutations were [99]. This gene-specific probability is essential knowledge for interpreting NGS results in a chemogenomic context. The study also found that the presence of these mutations was significantly associated with increasing patient age, a known characteristic of CH [99].
Methodologies for Discriminating Tumor and CH Mutations
Paired Sequencing Approaches
The most robust method to identify and filter CH-derived mutations is to sequence a matched normal sample—typically blood-derived gDNA or a skin biopsy—alongside the tumor or cfDNA sample.
- "Reverse" Somatic Mutation Calling: This innovative approach repurposes paired tumor-blood samples from cancer genomics cohorts. The tumor sample is used as a reference for the patient's germline genome to empower the detection of somatic mutations specific to the blood (CH). This method has been shown to achieve higher sensitivity and specificity for identifying true blood somatic mutations compared to a standard germline variant call on a single blood sample. For known CH driver genes, this method identified 37% more variants that were missed by germline calling, while also determining that 91% of variants called by the germline method were likely not somatic [100].
- Bioinformatic Analysis of Paired Samples: In one study, mutations reported on unpaired clinical tests were cross-referenced with sequencing reads from a paired tumor and blood assay (UNCseq). Clonal hematopoiesis mutations were authoritatively defined as those where the variant allele frequency (VAF) in the blood exceeded that in the tumor [99].
Tumor-Agnostic cfDNA Methods
Using cfDNA can circumvent the issue of admixed leukocytes present in tissue biopsies. Several tumor-agnostic methods are being developed to directly analyze cfDNA, though with varying sensitivities.
- Shallow Whole-Genome Sequencing (sWGS): This method detects copy number variations (CNVs) to estimate tumor fraction. In a study of early breast cancer patients, it detected ctDNA in 7.7% of patients at baseline [4].
- Genome-Wide Methylation Profiling (MeD-Seq): This approach exploits the fact that cancer cells have distinct methylation patterns. In the same breast cancer cohort, it was the most sensitive tumor-agnostic method, detecting ctDNA in 57.5% of patients [4].
- LINE-1 Sequencing Assay (mFAST-SeqS): This method uses the aneuploidy score to detect ctDNA, reporting a detection rate of 12.5% in early breast cancer [4].
The combination of multiple tumor-agnostic methods can increase detection rates, with one study finding ctDNA in 65% of patients when all methods were combined [4].
Visualizing Experimental and Analytical Workflows
The following diagram illustrates a recommended workflow for NGS analysis that incorporates strategies to mitigate the confounding effects of clonal hematopoiesis.
Diagram 1: Integrated workflow for CH mutation filtering.
The Scientist's Toolkit: Essential Reagents and Methods
Table 3: Key research reagents and solutions for CH and ctDNA studies
| Reagent / Solution | Primary Function | Application Context |
|---|---|---|
| Cell-Free DNA BCT Tubes (Streck) | Stabilizes blood cells to prevent lysis and release of genomic DNA, preserving the true cfDNA profile [34]. | Blood collection for cfDNA analysis. |
| MagMax Cell-Free Total Nucleic Acid Isolation Kit | Extracts cfDNA from plasma volumes, critical for obtaining analyzable material from low-concentration healthy donor samples [34]. | cfDNA extraction from plasma. |
| MSK-IMPACT Assay | A large-panel (341- or 410-gene) exon-capture NGS platform used for sequencing both tumor gDNA and cfDNA [101]. | Comprehensive genomic profiling. |
| Oncomine Breast cfDNA Assay | A targeted NGS panel focusing on SNV hotspots in breast cancer genes, used for sensitive ctDNA detection [4] [34]. | Targeted mutation detection in cfDNA. |
| Integrative Genomics Viewer (IGV) | A visualization tool for exploring large genomic datasets, used to manually inspect sequence reads supporting mutations in tumor and blood [99]. | Validation and visualization of variants. |
| Pavian | A web-based tool for calculating the percentage of read counts and z-scores for species per sample, used in pathogen detection but with principles applicable to contamination checks [75]. | Metagenomic analysis and contamination assessment. |
The accurate distinction between clonal hematopoiesis and tumor-derived mutations is a non-negotiable requirement for the integrity of chemogenomic research and the development of targeted therapies. The experimental data and methodologies presented here underscore that while cfDNA analysis offers a promising route to minimize CH contamination from leukocyte admixed in tissue biopsies, it is not a panacea. The implementation of paired sequencing strategies, where a matched normal sample (usually blood) is sequenced alongside the tumor or cfDNA, remains the most reliable method for identifying and filtering CH-derived mutations. As tumor-agnostic cfDNA methods like MeD-Seq continue to improve, they may offer more accessible paths to specific tumor DNA detection. For now, a rigorous approach combining careful experimental design, paired sequencing, and gene-specific interpretation of variant calls is essential to silence the background noise of clonal hematopoiesis and clearly hear the true signal of the tumor genome.
Next-generation sequencing (NGS) has revolutionized chemogenomic studies, providing unprecedented insights into how chemical compounds interact with biological systems. Two primary genomic sources are central to this research: genomic DNA (gDNA) from traditional tissue biopsies and cell-free DNA (cfDNA) from liquid biopsies. gDNA analysis offers a comprehensive view of the static genetic landscape, while cfDNA from liquid biopsies provides a minimally invasive, dynamic snapshot of tumor heterogeneity, capturing information from both primary and metastatic lesions in real-time [102]. The clinical implementation of circulating tumor DNA (ctDNA) NGS has demonstrated measurable impact across multiple malignancies, including non-small cell lung cancer (NSCLC), metastatic colorectal carcinoma, and breast cancer, where it helps identify actionable alterations and monitor treatment response [102].
The selection between gDNA and cfDNA sources presents a critical strategic decision in chemogenomic research. gDNA-based approaches remain the gold standard for comprehensive genomic profiling but are limited by tumor heterogeneity and invasiveness of serial sampling [102]. Conversely, cfDNA analysis enables longitudinal monitoring of therapy response and emerging resistance mechanisms, making it particularly valuable for tracking dynamic changes during treatment regimens [102]. However, cfDNA analysis faces unique technical challenges, including low abundance of tumor-derived DNA against a large background of normal DNA, with variant allele frequencies (VAFs) frequently falling below 1% at early disease stages or after curative-intent treatment [102].
This comparison guide examines the bioinformatics solutions and advanced algorithms that address the distinct computational requirements of gDNA and cfDNA analysis in chemogenomic studies, providing objective performance data to inform research pipeline development.
Sequencing Technology Landscape for gDNA and cfDNA Analysis
The choice of sequencing technology fundamentally shapes downstream bioinformatics strategies, with platform selection dependent on the genomic source material and research objectives.
Table 1: Sequencing Platforms and Their Applications in Chemogenomics
| Platform | Technology Type | Read Length | Primary Applications | Advantages/Limitations |
|---|---|---|---|---|
| Illumina | Short-read sequencing by synthesis | 36-300 bp | Whole genome, exome, and targeted sequencing of both gDNA and cfDNA | High accuracy (Q30+); may have signal overcrowding at >1% error rate [66] |
| PacBio HiFi | Long-read sequencing by synthesis | 10,000-25,000 bp | Structural variant detection, haplotype phasing in gDNA | >99.9% accuracy; higher cost [66] |
| Oxford Nanopore | Long-read electrical impedance detection | 10,000-30,000 bp | Real-time sequencing, structural variants, methylation analysis | Portable options; error rate can reach 15% [66] |
| Ion Torrent | Semiconductor sequencing by synthesis | 200-400 bp | Targeted sequencing of gDNA and cfDNA | Rapid turnaround; homopolymer sequence errors [66] |
| Element AVITI | Short-read sequencing | 300 bp | Flexible benchtop option for various applications | Q40-level accuracy, cost-effective [103] |
For cfDNA analysis, targeted panels are predominantly used in clinical applications due to the need for high sequencing depth to detect low-frequency variants. Major commercial cfDNA panels include Guardant360 CDx (55 genes), FoundationOne Liquid CDx (309 genes), and Tempus xF (105 genes) [2]. These panels employ unique molecular identifiers (UMIs) to label original DNA molecules before amplification, enabling bioinformatics pipelines to distinguish true variants from PCR and sequencing errors through duplicate read removal [102].
Emerging Sequencing Technologies
The sequencing landscape continues to evolve with recent advancements including Roche's Sequencing by Expansion (SBX) technology, which amplifies DNA into "Xpandomers" for rapid CMOS-based detection, and Illumina's 5-base chemistry that enables simultaneous detection of standard bases and methylation states in a single run [103]. These innovations hold particular promise for cfDNA fragmentomics analysis, which extracts epigenetic and transcriptional information from DNA fragmentation patterns [2].
Comparative Performance of Variant Calling Pipelines
Variant calling represents a critical bottleneck in NGS data analysis, with performance varying significantly between gDNA and cfDNA applications. Benchmarking studies using Genome in a Bottle (GIAB) reference standards provide objective metrics for evaluating different bioinformatics tools.
Table 2: Performance Benchmarking of Variant Calling Software on Whole Exome Sequencing (WES) Data
| Software | SNV Precision (%) | SNV Recall (%) | Indel Precision (%) | Indel Recall (%) | Runtime (Minutes) | Ease of Use |
|---|---|---|---|---|---|---|
| Illumina DRAGEN | >99 | >99 | >96 | >96 | 29-36 | Programming knowledge not required [104] |
| CLC Genomics | >98 | >98 | >94 | >94 | 6-25 | User-friendly graphical interface [104] [105] |
| Varsome Clinical | >97 | >97 | >92 | >92 | 45-60 | Web-based platform [104] |
| Partek Flow (GATK) | >96 | >96 | >90 | >90 | 216-1782 | Visual workflow interface [104] |
| GATK Best Practices | >99 | >98 | >95 | >94 | 120+ | Command-line expertise required [105] |
For plant genomics research, which often faces unique challenges including high proportions of repetitive sequences and polyploidy, benchmarking studies of 50 different variant calling pipelines found that BWA-MEM and Novoalign were the top-performing mappers, while GATK returned the best results in the variant calling step [105].
Specialized Considerations for cfDNA Variant Calling
Variant calling from cfDNA presents distinct computational challenges due to the ultra-low variant allele frequencies (VAFs) characteristic of liquid biopsies. Detection of variants at frequencies below 1% requires specialized bioinformatics approaches:
- Dynamic Limit of Detection: Implementing a coverage-dependent LoD calibrated to sequencing depth enhances result reliability, with recommendations of up to 20,000 unique reads per base for ultra-low frequency detection [102].
- Unique Molecular Identifiers: UMI barcoding during library preparation enables accurate distinction between true variants and sequencing errors, though UMI-based deduplication typically retains only approximately 10% of reads under optimal conditions [102].
- Strategic Bioinformatics Pipelines: Employing "allowed" and "blocked" lists of variants based on population databases enhances accuracy while minimizing false positives in cfDNA analysis [102].
The relationship between sequencing depth and detection probability follows a binomial distribution, with digital droplet PCR (ddPCR) offering high sensitivity for specific mutations but lower throughput compared to NGS [102].
Advanced Analytical Approaches: Fragmentomics for cfDNA
Beyond variant calling, fragmentomics analysis represents a cutting-edge bioinformatics approach that extracts additional layers of information from cfDNA sequencing data by examining DNA fragmentation patterns. This method infers epigenetic and transcriptional characteristics of tumors without requiring additional sequencing.
Fragmentomics Metrics and Performance
Research comparing multiple fragmentomics approaches on targeted sequencing panels has identified several effective metrics:
- Normalized Fragment Read Depth: This metric demonstrated the best overall performance for predicting cancer types and subtypes, achieving an average AUROC of 0.943 in the University of Wisconsin cohort and 0.964 in the GRAIL cohort [2].
- Fragment Size Distribution: The proportion of small fragments (<150 bp) and Shannon entropy of fragment sizes provide predictive power for cancer phenotyping [2].
- End Motif Diversity: Variation in 4-mer end motifs among fragments (MDS) can be particularly informative for certain cancer types, showing top performance for small cell lung cancer (AUROC: 0.888) [2].
- Nucleosome Positioning: Patterns in fragments overlapping transcription factor binding sites and open chromatin regions help infer epigenetic regulation [2].
These fragmentomics approaches maintain predictive power even when applied to commercially available targeted panels, with only minimal performance degradation when using the smaller gene sets of Guardant360 CDx (55 genes) and FoundationOne Liquid CDx (309 genes) [2].
Research Reagent Solutions for Chemogenomic NGS
Successful implementation of gDNA and cfDNA analysis pipelines requires carefully selected research reagents and tools. The following table details essential solutions for chemogenomic studies.
Table 3: Essential Research Reagents and Solutions for gDNA and cfDNA NGS
| Reagent Category | Specific Products | Function in Workflow | gDNA/cfDNA Specificity |
|---|---|---|---|
| DNA Extraction Kits | QIAamp Circulating Nucleic Acid Kit, Gentra Puregene Blood Kit | Nucleic acid purification from various sample types | cfDNA kits optimized for low-concentration samples [24] |
| Library Preparation | KAPA Hyper Prep Kit, VAHTS Universal Pro DNA Library Prep Kit | Fragment end-repair, adapter ligation, library amplification | UMI incorporation critical for cfDNA [102] [106] |
| Target Enrichment | Agilent SureSelect, IDT xGen Panels | Hybridization-based capture of genomic regions of interest | Panels specifically designed for ctDNA analysis available [104] [2] |
| Targeted Panels | Guardant360 CDx, FoundationOne Liquid CDx, Tempus xF | Clinical-grade cancer mutation profiling | Commercially available cfDNA panels with demonstrated clinical utility [2] |
| Quality Control | Agilent Bioanalyzer, Qubit dsDNA HS Assay | Quantification and quality assessment of DNA and libraries | Essential for both gDNA and cfDNA workflows [24] |
Experimental Protocol: Fragmentomics Analysis from cfDNA
For researchers implementing fragmentomics analysis, the following detailed methodology can be applied to targeted panel cfDNA data:
Sequence Data Processing: Begin with aligned BAM files from cfDNA sequencing. UMI-based deduplication must be performed to remove PCR duplicates while preserving unique molecular identifiers [102].
Fragment Metric Calculation: Compute multiple fragmentomics features simultaneously:
- Normalized depth at all exons individually, full genes, and first exons (E1)
- Shannon entropy at all exons and E1
- End motif diversity score (MDS) at all exons and E1
- Proportion of small fragments (<150 bp) at all exons and E1
- Fragment size distributions in binned ranges
- Entropy of fragments overlapping transcription factor binding sites
- Entropy of fragments overlapping ATAC-seq defined open chromatin regions [2]
Feature Matrix Construction: Compile all metrics into a sample-feature matrix, with normalization to account for sequencing depth and panel size variations.
Predictive Modeling: Apply GLMnet elastic net models with 10-fold cross-validation, repeated with multiple random seeds to ensure robust performance estimation [2].
Validation: Use orthogonal datasets (e.g., University of Wisconsin and GRAIL cohorts) to assess generalizability of findings across different panel designs and sequencing depths [2].
The choice between gDNA and cfDNA analysis in chemogenomic research involves balancing multiple factors, including invasiveness, genomic coverage, and sensitivity for detecting low-frequency variants. gDNA-based approaches remain essential for comprehensive genomic profiling, while cfDNA analysis offers unique advantages for longitudinal monitoring and assessment of tumor heterogeneity.
Bioinformatics solutions must be tailored to the specific characteristics of each genomic source. gDNA analysis benefits from established pipelines like GATK Best Practices and Illumina DRAGEN, which provide high accuracy for variant detection in high-quality samples. Conversely, cfDNA analysis requires specialized approaches including UMI-based error suppression, ultra-deep sequencing, and emerging fragmentomics methods that extract maximal information from limited template DNA.
As sequencing technologies continue to evolve, with improvements in both short-read and long-read platforms, bioinformatics algorithms must similarly advance to address new data types and analytical challenges. The integration of fragmentomics with traditional variant calling represents a promising direction for maximizing the clinical and research utility of liquid biopsies in chemogenomic studies.
Head-to-Head Performance: Analyzing Diagnostic Yield, Cost, and Clinical Feasibility
Direct Comparison of Analytical Sensitivity and Specificity for Mutation Detection
In the era of precision medicine, next-generation sequencing (NGS) has become the cornerstone of chemogenomic studies, which explore the complex interactions between chemical compounds and biological systems to drive drug discovery. A critical methodological consideration in these studies is the choice of genomic substrate: whole-cell genomic DNA (wcDNA) versus cell-free DNA (cfDNA). wcDNA, typically extracted from tissue or cell line biopsies, provides a comprehensive snapshot of the entire cellular genome. In contrast, cfDNA, particularly its tumor-derived fraction (ctDNA), is released into biofluids through apoptosis and necrosis, offering a non-invasive window into tumor heterogeneity and dynamic genomic changes. This guide provides an objective, data-driven comparison of the analytical sensitivity and specificity of NGS assays utilizing these two DNA sources, empowering researchers to select the optimal approach for their specific chemogenomic applications.
Head-to-Head Performance Comparison
Direct comparative studies reveal a performance trade-off that is central to the choice between wcDNA and cfDNA. The following tables summarize key quantitative findings from recent clinical and pre-clinical studies.
Table 1: Comparative Analytical Performance of wcDNA and cfDNA NGS
| Performance Metric | wcDNA mNGS (Body Fluids) | cfDNA mNGS (Body Fluids) | cfDNA Targeted NGS (Liquid Biopsy) | Reference(s) |
|---|---|---|---|---|
| Sensitivity | 74.07% (vs. culture) | Not Reported | 96.92% - 98.23% (for SNVs/Indels) | [75] [107] [108] |
| Specificity | 56.34% (vs. culture) | Not Reported | 99.67% - 99.99% | [75] [107] [108] |
| Concordance with Reference | 70.7% (vs. culture, bacteria) | 46.67% (vs. culture) | 72.2% - 94% (vs. tissue) | [75] [109] [107] |
| Limit of Detection (VAF) | Not Applicable (context-dependent) | Not Applicable (context-dependent) | 0.1% - 0.5% (for SNVs/Indels) | [109] [110] [111] |
| Host DNA Proportion | Mean 84% | Mean 95% | Not Applicable | [75] |
Table 2: Pathogen & Mutation Type Detection Preferences
| Pathogen/Mutation Type | wcDNA mNGS Performance | cfDNA mNGS Performance | Key Findings | Reference(s) |
|---|---|---|---|---|
| Bacteria (General) | Higher Sensitivity | Lower Sensitivity | wcDNA mNGS showed greater consistency with culture results for bacteria. | [75] |
| Fungi, Viruses, Intracellular Microbes | Lower Sensitivity for low-load pathogens | Higher Sensitivity for low-load pathogens | 31.8% of fungi, 38.6% of viruses, and 26.7% of intracellular microbes were detected only by cfDNA mNGS. | [79] |
| Single Nucleotide Variants (SNVs) & Indels | Robust detection, limited by tumor purity | High sensitivity and specificity with targeted panels and error suppression. | Targeted cfDNA panels achieve high accuracy for variants at low allele frequencies (0.1%-0.5%). | [109] [107] [111] |
| Structural Variants (Fusions, CNVs) | Suitable for detection | Suitable for detection | cfDNA panels can reliably detect fusions and copy number variations from plasma. | [109] [107] |
Detailed Experimental Protocols from Key Studies
To ensure reproducibility and provide context for the data above, this section outlines the core methodologies used in the cited comparison studies.
mNGS for Pathogen Detection in Body Fluids
A 2025 study directly compared wcDNA and cfDNA mNGS using 125 clinical body fluid samples (e.g., pleural, ascites, CSF) [75].
- Sample Processing: Samples were centrifuged at 20,000 × g for 15 minutes.
- DNA Extraction:
- cfDNA: Extracted from 400 μL of supernatant using the VAHTS Free-Circulating DNA Maxi Kit (Vazyme Biotech).
- wcDNA: The retained precipitate was subjected to bead-beating lysis, and DNA was extracted using the Qiagen DNA Mini Kit.
- Library Prep & Sequencing: Libraries were prepared with the VAHTS Universal Pro DNA Library Prep Kit for Illumina and sequenced on an Illumina NovaSeq platform (~8 GB data per sample).
- Bioinformatic Analysis: Data were analyzed using Pavian. Reportable pathogens were identified based on z-score comparisons with negative controls, minimum read counts, and genomic region thresholds.
Targeted cfDNA NGS for Solid Tumors
Multiple studies have validated the performance of targeted cfDNA panels in oncology [109] [108] [107]. A representative protocol is summarized below:
- Pre-analytical Phase:
- Blood Collection: Blood is drawn into cell-free DNA BCT tubes (e.g., Streck) to prevent white blood cell lysis and genomic DNA contamination.
- Plasma Isolation: Two-step centrifugation is critical. An initial slow spin (1,200-2,000 × g) removes cells, followed by a high-speed spin (12,000-16,000 × g) of the plasma to remove debris.
- cfDNA Extraction: Extraction is performed using specialized kits, such as the QIAamp Circulating Nucleic Acid Kit (Qiagen), which is optimized for low-concentration, fragmented DNA.
- Library Construction & Target Enrichment: For the 101-gene panel study [109], 20-80 ng of cfDNA was used for library construction. Hybridization-based capture was performed using a panel targeting 101 cancer-related genes.
- Sequencing: Ultra-deep sequencing was conducted on Illumina platforms (e.g., NextSeq 500, NovaSeq 6000) to achieve high median coverages (~15,880× for cfDNA), which is essential for detecting low-frequency variants.
- Bioinformatic Analysis: A customized pipeline (e.g., using Burrows-Wheeler Aligner for alignment and VarDict for variant calling) is employed. Background noise is filtered using databases of variants found in healthy donors, and unique molecular identifiers (UMIs) or molecular amplification pools (MAPs) are used for error suppression [111].
Visualizing the Experimental Workflows
The fundamental difference between wcDNA and cfDNA analysis lies in the initial sample handling and DNA extraction phases. The following diagram illustrates the two distinct pathways.
The Scientist's Toolkit: Essential Research Reagents & Materials
Table 3: Key Reagents and Kits for gDNA and cfDNA NGS
| Item | Function/Application | Example Products / Methods |
|---|---|---|
| cfDNA Blood Collection Tubes | Stabilizes blood cells to prevent gDNA contamination during shipment/storage. | Streck cfDNA BCT, Roche Cell-Free DNA Collection Tube [90] |
| cfDNA Extraction Kits | Optimized for purifying short, low-concentration DNA fragments from plasma. | QIAamp Circulating Nucleic Acid Kit (Qiagen) [109] [90] |
| wcDNA Extraction Kits | For robust extraction of high-molecular-weight DNA from cell pellets or tissues. | QIAamp DNA Mini Kit (Qiagen), DNeasy Blood & Tissue Kit [75] [112] |
| NGS Library Prep Kits | Prepares DNA fragments for sequencing by adding adapters. | VAHTS Universal Pro DNA Library Prep Kit, KAPA HyperPrep Kit [75] [112] |
| Target Enrichment Panels | Hybridization-based panels to capture and sequence specific genes of interest. | Custom 101-gene panel, Hedera Profiling 2 (HP2) 32-gene panel [109] [107] |
| Error Suppression Technologies | Molecular barcoding to distinguish true mutations from PCR/sequencing errors. | Unique Molecular Identifiers (UMIs), Molecular Amplification Pools (MAPs) [111] |
The choice between wcDNA and cfDNA as a substrate for NGS in chemogenomic research is not a matter of one being universally superior, but rather hinges on the specific research question and context.
- wcDNA from tissue or cell pellets remains a powerful tool for comprehensive genomic profiling, especially in scenarios where high tumor purity can be ensured. It demonstrates high sensitivity for pathogen detection in infectious disease models and is the traditional gold standard for solid tumor sequencing. However, its limitations include an inability to capture tumor heterogeneity fully and the invasive nature of sample collection.
- cfDNA from liquid biopsies offers a minimally invasive means to repeatedly sample the genomic landscape, making it exceptionally valuable for longitudinal chemogenomic studies, such as monitoring therapy response and the emergence of resistance mechanisms. While it can be challenged by low analyte concentration, modern targeted panels with sophisticated error-correction methods have achieved remarkable sensitivity and specificity, capable of detecting variants with allele frequencies as low as 0.1% [110] [111].
In conclusion, wcDNA provides a robust, high-quality snapshot, while cfDNA offers a dynamic, system-wide movie of genomic changes. For a complete chemogenomic profile, particularly in oncology and infectious disease research, the two approaches are often complementary. Integrating both wcDNA (for deep, localized genomic context) and cfDNA (for real-time, systemic monitoring) can provide the most holistic view for advanced drug development.
The emergence of next-generation sequencing (NGS) technologies has revolutionized cancer diagnostics, enabling researchers to detect genetic alterations with unprecedented sensitivity. In chemogenomic studies and drug development, understanding the performance characteristics of different genomic approaches is crucial for experimental design and data interpretation. Two fundamental approaches have emerged: gDNA-based NGS (using genomic DNA from tissue biopsies) and cfDNA-based NGS (using cell-free DNA from liquid biopsies). Each method offers distinct advantages and limitations that impact diagnostic yield differently across clinical scenarios—particularly when comparing early cancer screening applications versus advanced disease monitoring.
This comparison guide objectively evaluates the performance of these approaches across different contexts, providing researchers with experimental data, methodological protocols, and analytical frameworks to inform study design and technology selection.
Performance Comparison: Diagnostic Yield Across Scenarios
Table 1: Diagnostic Yield of gDNA vs. cfDNA-Based NGS in Different Clinical Contexts
| Clinical Scenario | Technology Approach | Diagnostic Yield Range | Key Performance Metrics | Study Characteristics |
|---|---|---|---|---|
| Early Cancer Screening (Asymptomatic Populations) | Traditional tissue biopsy (gDNA) | 0.7% cancer detection rate [113] | Stage 0/I detection: 58.4%; False negatives: 2.3% [113] | Prospective study of 31,057 asymptomatic patients [113] |
| MCED tests (cfDNA) | PPV: 28-38% [114] | Specificity: >99%; False-positive rate: ~1% [114] | DETECT-A (n=9,911) and Pathfinder (n=6,621) trials [114] | |
| Protein-based liquid biopsy (Carcimun test) | Sensitivity: 90.6%; Specificity: 98.2% [115] | PPV: 98.0%; NPV: 91.8% [115] | 172 participants (64 cancer, 80 healthy, 28 inflammatory) [115] | |
| Advanced Disease Monitoring | Large-panel ctDNA NGS (≥400 genes) | Sensitivity: ≥90% at VAF ≥0.5% [110] | Reproducibility: ≥90%; Specificity: varies by input [110] | Five-ctDNA assay comparison with reference materials [110] |
| ctDNA vs. tumor DNA concordance | Mutation consistency: poor between ctDNA-tDNA [116] | cfDNA concentration correlated with tumor size (r=0.430) [116] | 49 NSCLC patients, 31 benign lesions, 24 healthy controls [116] |
Table 2: Technical Performance of ctDNA NGS Assays at Different VAF Levels and DNA Inputs
| Assay Performance Factor | High Performance Range | Variable Performance Range | Key Influencing Factors |
|---|---|---|---|
| Variant Allele Frequency (VAF) | Sensitivity ≥90% at VAF ≥0.5% [110] | Performance decreases at VAF 0.1% [110] | Background noise, sequencing depth [110] |
| DNA Input Quantity | Optimal at 30-50ng per protocol [110] | Dramatic variation at 10ng input [110] | Library preparation efficiency, coverage uniformity [110] |
| Tumor Shedding Characteristics | High shedders: lung, ovarian, liver, gastric tumors [114] | Low shedders: thyroid, breast, prostate cancers [114] | Tumor type, location, vascularity, stage [114] |
| Assay Technological Factors | Deep coverage (≥10,000x), low background noise [110] | High false positivity rates in some assays [110] | Enrichment method, error suppression, bioinformatics [110] |
Experimental Protocols and Methodologies
Comprehensive Cancer Screening Program (gDNA-Based)
The study conducted at a private referral clinic in Peru between 2017-2019 provides a robust protocol for traditional gDNA-based screening [113]:
Population Selection:
- 31,057 asymptomatic patients aged ≥18 years with private health insurance
- Exclusion criteria: previous diagnosis of primary cancer
- Minimum age for breast cancer screening: 40 years (following international recommendations)
Screening Package Components:
- Women: physical examination, complete blood count, fecal occult blood test (guaiac-based), chest X-ray, gynecological examination, Papanicolaou test, endoscopy (≥40 years), colonoscopy (≥50 years), breast ultrasound, and mammography
- Men: physical examination, complete blood count, fecal occult blood test, chest X-ray, urologic examination, endoscopy (≥40 years), colonoscopy (≥50 years), and PSA test
Diagnostic Follow-up:
- Positive screening defined as any suspicious abnormality triggering clinical referral
- Cancer diagnosis confirmed within 4 years after program participation
- Statistical analysis using descriptive statistics and Chi-squared test
ctDNA Assay Performance Comparison Study
A direct comparison of five leading ctDNA NGS assays provides methodology for evaluating liquid biopsy approaches [110]:
Reference Sample Preparation:
- Set 1: Genomic DNA mixture from cancer cell lines with 40 reference mutations relevant to solid tumors
- Set 2: Custom panel with 23 reference mutations related to myeloid malignancy
- VAF levels: 0%, 0.125%, 0.5%, and 1.0%
- DNA fragmented to 160-180bp to mimic cell-free DNA fragment size
Assay Evaluation Protocol:
- Five commercial ctDNA assays selected based on published utilization, technical features, and availability
- Each vendor supplied with identical reference samples blinded to mutation information
- Testing performed at different DNA inputs (10ng, 30ng, 50ng) in duplicate
- Vendors performed testing using their standard laboratory procedures and bioinformatics pipelines
Performance Metrics Analyzed:
- Sensitivity, specificity, reproducibility at different VAF levels
- Depth of coverage, background noise, false positivity rates
- Impact of technical factors including enrichment method and error suppression
Multi-Cancer Early Detection Test Validation
The evaluation of the Carcimun test demonstrates an alternative protein-based liquid biopsy approach [115]:
Study Population:
- 172 participants: 80 healthy volunteers, 64 cancer patients (various types, stages I-III), 28 with inflammatory conditions or benign tumors
- Cancer types included pancreatic, bile duct, liver metastasis, esophageal, gastric, GIST, peritoneal, colorectal, and lung cancers
Experimental Protocol:
- Blood plasma collection using standard venipuncture techniques
- Sample preparation: 70μl 0.9% NaCl + 26μl blood plasma + 40μl distilled water
- Incubation at 37°C for 5 minutes for thermal equilibration
- Blank measurement at 340nm followed by addition of 80μl 0.4% acetic acid solution
- Final absorbance measurement at 340nm using Indiko Clinical Chemistry Analyzer
- Blinded measurement to prevent bias
Data Analysis:
- Pre-established cut-off value of 120 to differentiate healthy and cancer subjects
- Calculation of sensitivity, specificity, PPV, NPV using standard formulas
- Statistical analysis including one-way ANOVA with post-hoc tests
Technological Workflows: gDNA vs. cfDNA NGS
The Scientist's Toolkit: Essential Research Reagents and Solutions
Table 3: Key Research Reagent Solutions for gDNA and cfDNA NGS Studies
| Reagent/Category | Specific Examples | Function & Application | Technical Considerations |
|---|---|---|---|
| Blood Collection Tubes | ACD anticoagulant tubes [116], EDTA tubes [116], Streck tubes | Preserve blood samples for cfDNA analysis; prevent white blood cell lysis | Choice affects cfDNA yield and background noise from hematopoietic cells |
| DNA Extraction Kits | QIAamp DNA FFPE Tissue Kit [116] | Extract high-quality DNA from formalin-fixed paraffin-embedded tissue | Critical for gDNA-based NGS from tissue biopsies; impacts DNA fragmentation |
| Target Enrichment Panels | Roche AVENIO ctDNA Expanded Kit (77 genes) [116], Large panels (≥400 genes) [110] | Comprehensive profiling of cancer-related mutations | Panel size balances coverage with sequencing depth; impacts detection sensitivity |
| NGS Library Prep | Subtraction enrichment and immunostaining-FISH [116] | Isolate and identify circulating tumor cells and derived endothelial cells | Enrichment strategy critical for detecting rare variants in background noise |
| Reference Materials | Seracare Life Sciences reference samples [110] | Validate assay performance with known mutations at specific VAFs | Essential for cross-assay comparison and quality control |
| Bioinformatics Tools | Customized xGen pan-solid tumor kit (474 genes) [116] | Targeted sequencing for validation of mutations | Bioinformatics pipelines crucial for distinguishing true variants from artifacts |
Discussion and Research Implications
The comparative data reveals a fundamental trade-off between diagnostic certainty and clinical practicality when selecting between gDNA and cfDNA-based approaches. gDNA from tissue biopsies remains the gold standard for molecular characterization with high variant allele frequencies, but requires invasive procedures that limit serial monitoring applications [113]. Conversely, cfDNA-based liquid biopsies offer minimal invasiveness and enable dynamic monitoring, but face challenges with low VAF detection, particularly in early-stage disease where tumor DNA shedding may be minimal [114] [110].
For early cancer screening, the performance of both approaches is constrained by biological rather than technical factors. Traditional screening programs demonstrate low absolute detection rates (0.7%) in asymptomatic populations, reflecting the low prevalence of cancer in these cohorts [113]. Emerging MCED tests show promising specificity (>99%) but variable sensitivity across cancer types, largely dependent on tumor shedding characteristics [114]. The Carcimun test demonstrates an alternative protein-based approach with high sensitivity (90.6%) and specificity (98.2%), though its performance in true population screening requires further validation [115].
In advanced disease monitoring, ctDNA approaches show superior performance with sensitivity ≥90% at VAF ≥0.5%, enabled by higher tumor burden and consequently greater ctDNA shedding [110]. However, mutation profiles between ctDNA and tumor DNA show poor concordance in some studies, suggesting clonal evolution and tumor heterogeneity may impact clinical utility [116]. Technical factors including DNA input quantity, sequencing depth, and background noise dramatically influence performance, particularly at low VAF levels [110].
For chemogenomic studies and drug development, these findings highlight the importance of aligning technology selection with research objectives. gDNA-based approaches remain essential for comprehensive molecular profiling and biomarker discovery, while cfDNA-based methods enable longitudinal assessment of tumor evolution and treatment response. The optimal approach may involve complementary use of both technologies throughout the drug development pipeline.
The selection of an appropriate starting material for Next-Generation Sequencing (NGS) is a critical strategic decision in chemogenomic and drug discovery research. The debate between using genomic DNA (gDNA) versus cell-free DNA (cfDNA) workflows involves fundamental trade-offs between analytical sensitivity, turnaround time, cost efficiency, and applicability to different research scenarios. gDNA, comprising intact genetic material from microbial or human cells, offers comprehensive genetic information but often requires sophisticated host depletion methods for optimal results in infectious disease applications. In contrast, cfDNA—short, fragmented DNA circulating in biofluids like plasma—enables minimally invasive sampling but presents challenges due to its low abundance and fragmented nature [65]. This guide provides an objective comparison of these competing methodologies, focusing on quantitative performance metrics essential for research and development decision-making in pharmaceutical and diagnostic applications.
Technical Performance and Detection Efficiency
Microbial Pathogen Detection in Sepsis Research
In chemogenomic studies focused on antimicrobial drug discovery, the efficient detection of pathogenic organisms is paramount. A recent study evaluating metagenomic NGS (mNGS) for sepsis diagnosis provides compelling comparative data. The research implemented a novel Zwitterionic Interface Ultra-Self-assemble Coating (ZISC)-based filtration device for host cell depletion in gDNA workflows, achieving >99% removal of human white blood cells. This process significantly enhanced microbial signal detection, with gDNA-based mNGS detecting all expected pathogens in 100% (8/8) of clinical samples from sepsis patients. The average microbial read count reached 9,351 reads per million (RPM), representing a tenfold enrichment over unfiltered gDNA samples (925 RPM) [80].
In the same comparative analysis, cfDNA-based mNGS demonstrated inconsistent sensitivity and was not significantly enhanced by the same filtration technology, achieving only 1,251-1,488 RPM [80]. This substantial disparity in microbial read counts highlights a critical advantage for gDNA-based approaches in scenarios where comprehensive pathogen identification is required, such as in screening novel antimicrobial compounds or understanding complex host-pathogen interactions in chemogenomic studies.
Circulating Tumor DNA Detection in Oncology Research
For oncology drug development applications, particularly those focusing on minimal residual disease monitoring or therapy response assessment, the analytical sensitivity of ctDNA detection is crucial. A comparative study in rectal cancer patients evaluated two detection platforms—droplet digital PCR (ddPCR) and NGS—using cfDNA from liquid biopsies. The research found that ddPCR exhibited superior detection rates for circulating tumor DNA in pretreatment plasma samples (58.5% with ddPCR versus 36.6% with NGS panel sequencing; p = 0.00075) [36].
This performance differential highlights the method-dependent variability in cfDNA analysis. While NGS offers the advantage of detecting multiple variant types simultaneously without requiring prior knowledge of specific mutations, its sensitivity may be lower than targeted approaches like ddPCR, especially for low-frequency variants. This trade-off between breadth of detection and analytical sensitivity directly impacts assay selection for specific chemogenomic applications, particularly in early-stage drug development where detecting rare resistance mutations may be critical.
Table 1: Analytical Performance Comparison of gDNA vs. cfDNA NGS Workflows
| Parameter | gDNA-based mNGS with Host Depletion | cfDNA-based mNGS | Research Context |
|---|---|---|---|
| Detection Rate | 100% (8/8 samples) [80] | Inconsistent sensitivity [80] | Pathogen detection in sepsis |
| Average Microbial Reads (RPM) | 9,351 RPM [80] | 1,251-1,488 RPM [80] | Pathogen detection in sepsis |
| Enrichment Factor | 10x enrichment over unfiltered gDNA [80] | Not significantly enhanced by filtration [80] | Pathogen detection in sepsis |
| Limit of Detection | Not specified | 0.1% variant allele frequency (dd-cfDNA) [117] | Donor-derived cfDNA in transplantation |
| Platform Comparison | N/A | ddPCR: 58.5% detection vs. NGS: 36.6% detection (p=0.00075) [36] | ctDNA detection in rectal cancer |
Turnaround Time Analysis
Turnaround time (TAT) constitutes a critical operational metric in both research and clinical environments, directly impacting project timelines and decision-making processes. A comprehensive study of commercial plasma NGS (Guardant360) analyzing 533 results from 461 patients between 2016 and 2019 provides robust TAT data relevant to cfDNA workflows. The median TAT from blood draw to result was 9 days, slightly longer than the laboratory receipt-to-result TAT (median of 7 days) [118]. This discrepancy highlights the impact of pre-analytical variables including sample transport and handling.
Over the study period, TAT performance demonstrated variability, initially decreasing from a median of 12 days in the first 6 months to 8 days in 2018, before rising slightly to 9 days in the final 6 months [118]. During the most recent 12 months of the study, 95% (231/247) of cases were completed within 14 days of blood draw, while only 18% (44 cases) were completed within 7 days [118]. These findings establish a realistic TAT expectation for cfDNA-based NGS workflows, informing project planning and timeline development for drug discovery researchers.
For gDNA-based workflows incorporating host depletion steps like the ZISC-filtration system, additional processing time must be accounted for in TAT calculations. While specific TAT data for gDNA workflows wasn't provided in the search results, the requirement for additional processing steps—including filtration, centrifugation, and potentially more complex DNA extraction protocols—suggests that gDNA-based approaches may entail longer hands-on time compared to standard cfDNA workflows, though this may be offset by reduced sequencing requirements due to higher target abundance.
Table 2: Turnaround Time Comparison for NGS Workflows
| TAT Metric | Performance Data | Context |
|---|---|---|
| Median TAT (Blood Draw to Result) | 9 days [118] | Plasma cfDNA NGS for oncology |
| Laboratory TAT (Receipt to Result) | 7 days (median) [118] | Plasma cfDNA NGS for oncology |
| Rapid TAT Achievement | 18% of cases within 7 days [118] | Plasma cfDNA NGS for oncology |
| Reliable TAT Expectation | 95% of cases within 14 days [118] | Plasma cfDNA NGS for oncology |
| Time of Day for Results | 43% of results returned after 5:00 PM [118] | Plasma cfDNA NGS for oncology |
Cost-Benefit Considerations
The economic evaluation of NGS workflows extends beyond simple per-sample cost calculations to encompass broader value propositions including informational content, operational efficiency, and downstream applications. While comprehensive direct cost comparisons between gDNA and cfDNA workflows were not explicitly detailed in the search results, several relevant economic factors emerged.
Digital PCR platforms, often used for cfDNA analysis, demonstrate favorable operational economics compared to NGS, with one study noting that ddPCR operational costs are 5–8.5-fold lower than NGS [36]. This cost advantage must be balanced against the more limited multiplexing capability and narrower genomic coverage of ddPCR compared to NGS.
For cfDNA-based NGS specifically, the technical challenges associated with low concentrations of microbial cfDNA relative to interfering human cfDNA contribute to increased testing costs [65]. The risk of spurious contaminating nucleic acids in the mNGS workflow is heightened with cfDNA due to its minute concentrations, potentially leading to false-positive or false-negative results that incur additional verification costs [65].
The informatics component represents another significant cost factor across all NGS workflows. The industry is increasingly focusing on informatics solutions to manage the massive datasets generated by NGS, with needs including data storage and organization, advanced secondary analysis algorithms, and AI models for generating research conclusions from high-dimensional datasets [98]. These bioinformatics expenses can substantially impact the total cost of ownership for NGS workflows in research settings.
Workflow Methodologies and Experimental Protocols
gDNA Workflow with Host Depletion for Pathogen Detection
The enhanced performance of gDNA-based mNGS with host depletion, as demonstrated in sepsis research [80], relies on a meticulously optimized protocol:
Sample Preparation: Whole blood samples (3-13 mL volume range) were collected in appropriate anticoagulant tubes. The ZISC-based filtration device was connected to a syringe, and approximately 4 mL of whole blood was transferred and gently pushed through the filter into a collection tube [80].
Host Cell Depletion: The ZISC-coated filter achieved >99% white blood cell removal while allowing unimpeded passage of bacteria and viruses, as validated using spiked blood samples with Escherichia coli, Staphylococcus aureus, and Klebsiella pneumoniae [80].
Microbial Enrichment: Filtered blood samples underwent low-speed centrifugation (400g for 15 minutes) to isolate plasma, followed by high-speed centrifugation (16,000g) to pellet microbial cells [80].
DNA Extraction: Genomic DNA was extracted from the pellet using specialized microbial DNA enrichment kits, followed by library preparation with ultra-low input protocols [80].
Sequencing and Analysis: Libraries were sequenced on Illumina platforms (NovaSeq6000 or MiSeq) with a minimum of 10 million reads per sample. Bioinformatic analysis utilized customized pipelines to quantify microbial reads and identify pathogens [80].
gDNA mNGS Workflow with Host Depletion
cfDNA Workflow for Liquid Biopsy Applications
Standardized cfDNA extraction protocols have been developed to ensure reproducibility in liquid biopsy applications, particularly relevant to oncology drug development:
Sample Collection and Stability: Blood samples were collected in specialized cell-free DNA BCT tubes (e.g., Streck). Sample stability was assessed at room temperature and 4°C for up to 48 hours [119].
Plasma Separation: Two-step centrifugation was performed—initial lower-speed centrifugation (e.g., 400g for 15 minutes) to separate plasma, followed by higher-speed centrifugation (e.g., 16,000g) to remove residual cells and debris [80] [119].
cfDNA Extraction: Magnetic bead-based cartridge systems were employed for high-throughput cfDNA extraction, demonstrating high recovery rates and consistent fragment size distribution (predominantly mononucleosomal and dinucleosomal) with minimal genomic DNA contamination [119].
Quality Control: Extracted cfDNA was analyzed for concentration, percentage, and fragment size using automated electrophoresis systems (e.g., Agilent TapeStation) [119].
Library Preparation and Sequencing: Specialized library prep kits for low-input and fragmented DNA were utilized, followed by sequencing on appropriate NGS platforms with sensitivity down to 0.1% variant allele frequency for donor-derived cfDNA applications [117].
cfDNA NGS Workflow for Liquid Biopsy
The Scientist's Toolkit: Essential Research Reagents and Materials
Table 3: Essential Research Reagents and Materials for NGS Workflows
| Reagent/Material | Function | Example Applications |
|---|---|---|
| ZISC-based Filtration Devices | Host cell depletion while preserving microbial integrity | gDNA-based mNGS for pathogen detection [80] |
| Cell-Free DNA BCT Tubes | Stabilize blood samples for cfDNA analysis | Preserve cfDNA integrity during transport and storage [36] [119] |
| Magnetic Bead-based cfDNA Kits | High-throughput, automated cfDNA extraction | Liquid biopsy applications in oncology [119] |
| Ultra-Low Input Library Prep Kits | Library construction from limited DNA sources | Both gDNA and cfDNA workflows with low biomass [80] |
| Reference Standard Materials | Quality control and assay validation | Synthetic cfDNA, ctDNA controls with known variants [119] |
| Microbial DNA Enrichment Kits | Enhance microbial signal from complex samples | gDNA-based pathogen detection in whole blood [80] |
The choice between gDNA and cfDNA NGS workflows represents a strategic decision with significant implications for research outcomes, timelines, and resource allocation in chemogenomic studies and drug development. gDNA-based approaches, particularly when coupled with advanced host depletion technologies, offer superior sensitivity and comprehensive genetic information for pathogen detection and microbiome studies. Conversely, cfDNA workflows provide a minimally invasive approach suitable for serial monitoring applications in oncology and other fields, with established turnaround times of approximately 9-14 days for commercial platforms.
The decision framework should consider multiple factors: (1) research objectives (comprehensive pathogen identification vs. specific variant detection), (2) sample type and biomass availability, (3) required sensitivity and turnaround time, and (4) available budget and informatics infrastructure. As NGS technologies continue evolving—with trends pointing toward multiomic integration, AI-enhanced analytics, and streamlined workflows—both gDNA and cfDNA approaches will likely see expanded applications in chemogenomic research and personalized medicine development [98] [120].
The rapid and accurate identification of pathogens is a critical determinant of survival in sepsis, a life-threatening condition triggered by a dysregulated host response to infection [80] [121]. For decades, diagnostic microbiology has heavily relied on blood culture (BC), a method plagued by prolonged turnaround times and suboptimal sensitivity, which can delay the initiation of targeted antimicrobial therapy [122] [121]. The advent of next-generation sequencing (NGS) has introduced powerful, culture-independent diagnostic capabilities, primarily utilizing two types of genetic material: genomic DNA (gDNA) from microbial cells and host white blood cells, and cell-free DNA (cfDNA) circulating in plasma, which includes fragments derived from pathogens [80] [123].
This case study provides a objective comparison of gDNA-based and cfDNA-based NGS workflows within the context of sepsis diagnostics. We will evaluate their respective performances based on recent clinical and analytical studies, summarize key quantitative data for direct comparison, and detail the experimental protocols that generate the evidence, thereby informing their application in chemogenomic and drug development research.
Performance Comparison: gDNA vs. cfDNA in Sepsis Diagnostics
The diagnostic performance of gDNA and cfDNA-based NGS methods varies significantly in sensitivity, specificity, and practical application. The table below synthesizes key comparative findings from recent clinical studies.
Table 1: Clinical Performance Comparison of gDNA-based and cfDNA-based Diagnostic Methods in Sepsis
| Metric | gDNA-based mNGS (with Host Depletion) | cfDNA-based mNGS | Blood Culture (Reference) |
|---|---|---|---|
| Pathogen Detection Rate | 100% (8/8 culture-positive samples) [80] | Inconsistent sensitivity; not significantly enhanced by filtration [80] | 37.5% (18/48 patients) [122] |
| Analytical Sensitivity (Microbial Read Count) | ~10,000 RPM (Reads per Million); >10-fold enrichment over unfiltered gDNA [80] | ~1,200-1,500 RPM [80] | N/A |
| Ability to Detect Difficult-to-Culture Pathogens | Yes (Implied by unbiased approach) | Yes (e.g., Pneumocystis jirovecii, Leptospira interrogans) [122] | Limited |
| Impact of Host Depletion Filtration | >10-fold increase in microbial reads; >99% white blood cell removal [80] | Minimal improvement in sensitivity [80] | N/A |
| Overall Diagnostic Utility | High for detecting intracellular and cell-associated pathogens | Useful for detecting pathogens that release DNA into the bloodstream | Standard but slow, with limited sensitivity |
Beyond direct pathogen detection, cfDNA levels themselves have prognostic value. A 2024 meta-analysis of 32 studies found that cfDNA levels are significantly higher in septic patients compared to healthy controls (SMD = 3.303, p<0.01) and in non-survivors compared to survivors (SMD = 1.554, p<0.01) [123]. The pooled sensitivity and specificity of cfDNA for sepsis prognosis were both 0.78 [123].
Detailed Experimental Protocols and Workflows
Understanding the experimental methodologies is crucial for interpreting the performance data and for application in research settings.
gDNA-based mNGS with Novel Host Depletion
A pivotal study evaluated a Zwitterionic Interface Ultra-Self-assemble Coating (ZISC)-based filtration device for depleting host cells [80].
- Sample Processing: Whole blood samples (approximately 4 mL) were passed through the ZISC filter, which achieves >99% removal of white blood cells while allowing bacteria and viruses to pass through unimpeded [80].
- Microbial Pellet and DNA Extraction: Filtered blood underwent low-speed centrifugation (400g for 15 min) to isolate plasma. The plasma was then subjected to high-speed centrifugation (16,000g) to obtain a microbial cell pellet. DNA was subsequently extracted from this pellet using a specialized microbial DNA enrichment kit [80].
- Sequencing and Analysis: Libraries were prepared and sequenced on an Illumina NovaSeq6000 platform with a minimum of 10 million reads per sample. Bioinformatic analysis was performed using customized pipelines to identify microbial sequences [80].
cfDNA-based mNGS Workflow
- Sample Processing: Plasma is isolated from whole blood via centrifugation. cfDNA is then directly extracted from the plasma fraction, avoiding the need for a microbial enrichment step [80] [18].
- Sequencing and Analysis: Extracted cfDNA undergoes library preparation and is sequenced. A key advantage of cfDNA is its suitability for liquid biopsy applications, capturing DNA released from pathogens and host cells through apoptosis and necrosis systemically [123].
Complementary Molecular Methods: Droplet Digital PCR (ddPCR)
While NGS offers a broad, unbiased approach, targeted methods like ddPCR provide high sensitivity for specific pathogens. A 2025 study on E. coli bloodstream infections exemplifies this protocol [124].
- DNA Extraction: DNA is extracted from whole blood using an automated system with specialized reagents.
- PCR Setup: The DNA is partitioned into thousands of nanoliter-sized droplets. Each droplet contains the PCR reaction mix with primers and a probe specific to an E. coli gene.
- Amplification and Reading: The droplets undergo thermal cycling. After amplification, the droplet reader counts each droplet as positive or negative for the fluorescent signal. This absolute quantification allows for precise measurement of the target DNA concentration, achieving a sensitivity of 82.7% and specificity of 100% for E. coli detection [124].
The following diagram illustrates the core workflows for gDNA- and cfDNA-based pathogen detection:
The Scientist's Toolkit: Essential Research Reagents and Materials
Successful implementation of these diagnostic workflows relies on a suite of specialized reagents and tools.
Table 2: Key Research Reagent Solutions for Sepsis Diagnostics
| Reagent/Material | Function | Example Use Case |
|---|---|---|
| ZISC-based Filtration Device | Depletes >99% of host white blood cells from whole blood, enriching microbial content for gDNA-based mNGS [80]. | gDNA-based mNGS workflow for sepsis [80]. |
| cfDNA Extraction Kits | Isulates short-fragment, circulating cell-free DNA from plasma samples. | cfDNA-based NGS for pathogen detection and prognosis in sepsis [123] [18]. |
| 16S Barcoding Kit (e.g., ONT) | Enables PCR amplification and barcoding of the full-length 16S rRNA gene for targeted long-read sequencing [125]. | Species-level microbial identification from polymicrobial samples [125]. |
| Droplet Digital PCR (ddPCR) Systems | Provides absolute quantification of specific pathogen DNA with high sensitivity and specificity, without a standard curve [124]. | Targeted detection and load monitoring of specific pathogens like E. coli in BSIs [124]. |
| Metagenomic NGS Library Prep Kits | Prepares fragmented DNA for sequencing on platforms like Illumina, enabling unbiased pathogen detection. | Both gDNA and cfDNA-based mNGS workflows [80]. |
| Reference Microbial Communities (e.g., ZymoBIOMICS) | Serves as spike-in controls for evaluating the analytical sensitivity and recovery of NGS workflows [80]. | Protocol validation and quality control. |
This case study demonstrates that the choice between gDNA and cfDNA-based NGS for sepsis diagnostics is context-dependent. gDNA-based mNGS, particularly when coupled with advanced host depletion techniques like ZISC filtration, offers superior sensitivity for detecting cell-associated pathogens. In contrast, cfDNA-based mNGS provides a valuable snapshot of systemic infection, capturing pathogens that release DNA into the bloodstream and offering additional prognostic information through total cfDNA quantitation.
For researchers in chemogenomics and drug development, integrating these complementary approaches can provide a more comprehensive understanding of the host-pathogen interface. gDNA methods are optimal for identifying viable, intracellular microbes for targeted drug discovery, while cfDNA analysis can monitor treatment efficacy and disease progression in real-time, crucial for evaluating therapeutic interventions. As sequencing technologies and bioinformatic tools continue to advance, the synergistic use of gDNA and cfDNA will undoubtedly refine sepsis diagnostics and accelerate the development of novel antimicrobial strategies.
In the era of precision oncology, the accurate detection of genomic alterations is fundamental to guiding targeted therapy and understanding tumor evolution. Next-generation sequencing (NGS) has become the cornerstone technology for this purpose, with genomic DNA (gDNA) from tissue biopsies long considered the gold standard [18]. However, the emergence of circulating cell-free DNA (cfDNA) analysis from liquid biopsies presents a less invasive method for assessing tumor genomics, capturing DNA released into the bloodstream from apoptotic and necrotic cells [126] [18].
This case study objectively examines the congruence and discordance in cancer genotyping between tissue gDNA and plasma cfDNA within the context of chemogenomic research. We synthesize evidence from multiple clinical studies to compare the performance of these two approaches, evaluating their operational characteristics, analytical concordance, and respective advantages and limitations. The goal is to provide researchers and drug development professionals with a data-driven framework for selecting and implementing these genomic assessment methods in preclinical and clinical studies.
Fundamental Technological Platforms
The comparison between tissue and liquid biopsies begins with an understanding of their fundamental technological differences. Table 1 summarizes the core characteristics of each approach, which form the basis for their differing performance characteristics in clinical and research settings.
Table 1: Core Characteristics of Tissue gDNA and Plasma cfDNA Analysis
| Characteristic | Tissue gDNA-Based NGS | Plasma cfDNA-Based NGS |
|---|---|---|
| Biological Source | Genomic DNA from tumor cells and tumor microenvironment [126] | Circulating cell-free DNA from apoptotic/necrotic tumor cells [18] |
| Invasiveness | Invasive procedure (e.g., core needle biopsy) | Minimally invasive (blood draw) [18] |
| Turnaround Time | Longer (includes sample processing, DNA extraction) | Shorter (reduced sample processing complexity) [127] |
| Tumor Heterogeneity Capture | Limited to sampled site [126] | Potentially captures contributions from multiple tumor sites [126] |
| Optimal Patient Context | Often preferred at initial diagnosis | Advanced disease, disease monitoring, when tissue is unavailable [126] [127] |
| Key Limitation | Spatial sampling bias, invasive risk [126] | Lower tumor DNA fraction in early-stage disease [126] |
Quantitative Concordance Analysis
Understanding the degree of concordance between tissue and liquid biopsy findings is crucial for interpreting results and making informed research and clinical decisions. The data reveal a complex picture highly dependent on the context of the analysis.
A retrospective study of 28 patients with advanced solid tumors compared alterations in 65 genes common to both NGS assays. When including all genes tested (both altered and wild-type), the concordance rate was notably high, at 91.9–93.9% [126]. However, this figure presents a skewed view of clinical utility, as it is heavily influenced by the high number of genes without alterations. When the analysis was restricted only to genes with reported genomic alterations in either assay, the concordance rate dropped dramatically to 11.8–17.1% [126]. This highlights that over 50% of mutations detected by either technique were not detected using the other, suggesting a potential complementary role rather than strict substitution [126].
A larger study of 146 lung cancer patients provided additional perspective, reporting that more than 80% of patients had at least one concordant variant identified in both tissue and plasma. At the variant level, 506 alterations were shared, while 432 were tissue-specific and 92 were plasma-specific [127].
Gene-Specific and Alteration-Specific Performance
The concordance between tissue and liquid biopsy varies significantly across specific genes and alteration types, which is critical for applications focused on particular therapeutic targets.
Table 2: Sensitivity of cfDNA NGS for Detecting Key Driver Alterations in Lung Cancer
| Gene/Alteration | Sensitivity (%) | Clinical Context |
|---|---|---|
| EGFR exon 19 deletion | 90.0 | Lung Adenocarcinoma [127] |
| EGFR p.S768I | 100.0 | Lung Adenocarcinoma [127] |
| ALK fusion | 85.7 | Lung Adenocarcinoma [127] |
| RET fusion | 100.0 | Lung Adenocarcinoma [127] |
| KRAS p.G12C | 85.7 | Lung Adenocarcinoma [127] |
| Overall variants (pooled) | 53.9 | Pan-cancer (5 genes: TP53, EGFR, KRAS, APC, CDKN2A) [126] |
This gene-specific performance is further supported by a study of 82 NSCLC patients, which reported an overall concordance of 98% between comprehensive cfDNA profiling and tissue-based routine testing, with a sensitivity exceeding 70% and specificity of 100% [128].
Experimental Protocols and Workflows
Tissue gDNA Workflow
The standard protocol for tissue-based genomic analysis begins with formalin-fixed paraffin-embedded (FFPE) tissue sectioning and macrodissection to enrich tumor content. DNA extraction follows, using kits such as the QIAamp DNA FFPE Tissue Kit, with DNA concentration measured using fluorometric methods [127]. For NGS library construction, 20-80 ng of tissue DNA is fragmented by ultrasonication, followed by end repair, phosphorylation, dA-tailing, and adapter ligation. Fragments of 200-400 bp are selected using magnetic beads, followed by hybridization with targeted gene panels and PCR amplification before sequencing [127].
Plasma cfDNA Workflow
For cfDNA analysis, blood samples are collected in tubes containing stabilizers to prevent genomic DNA contamination. Plasma is separated through a two-step centrifugation process (e.g., 2000 g for 10 minutes, then 16,000 g for 10 minutes at 4°C) [127]. CfDNA is extracted from the plasma using specialized kits like the QIAamp Circulating Nucleic Acid Kit. Library construction for cfDNA typically requires less input material (as low as 5-30 ng) and often omits the fragmentation step due to the naturally small size of cfDNA fragments (typically 100-280 bp) [18] [129]. Target enrichment and sequencing follow similar principles to tissue workflows.
Diagram 1: Comparative experimental workflows for tissue gDNA and plasma cfDNA analysis in cancer genotyping.
Factors Influencing Concordance and Discordance
Biological and Technical Factors
Multiple factors contribute to the observed discordance between tissue and liquid biopsy genotyping results. Tumor heterogeneity represents a fundamental challenge, as a single tissue biopsy may not capture the complete genomic landscape of a tumor, particularly in metastatic disease [126]. The interval between sample collections can also significantly impact concordance. In one study, the median interval between paired tumor and blood sample collection was 89 days (ranging from 8 to 3,448 days), during which time clonal evolution or interval treatment could alter the genomic profile [126].
Technical factors include differences in assay sensitivity, with tissue NGS typically having a higher input DNA quantity and quality. The tumor fraction in cfDNA is another critical variable; in patients with low tumor burden or early-stage disease, the proportion of tumor-derived cfDNA may fall below the detection limit of the assay [126] [129]. Additionally, differences in gene coverage and bioinformatic pipelines between tissue and liquid biopsy assays can contribute to discordant results [18].
Temporal and Spatial Considerations
The relationship between tissue and liquid biopsy genotyping is influenced by the timing of sample collection and the dynamic nature of tumor genomes. Liquid biopsy may capture emerging resistance mutations not yet present in a previously collected tissue sample, providing a more current representation of the tumor genomic landscape [126]. This temporal advantage makes cfDNA particularly valuable for monitoring treatment response and the emergence of resistance mechanisms during therapy.
The Scientist's Toolkit: Essential Research Reagents and Platforms
Successful implementation of comparative genotyping studies requires access to specialized reagents, instruments, and computational tools. Table 3 details key solutions that form the essential toolkit for researchers in this field.
Table 3: Essential Research Reagents and Platforms for Comparative Genotyping Studies
| Category | Specific Solution | Function/Application |
|---|---|---|
| Nucleic Acid Extraction | QIAamp DNA FFPE Tissue Kit [127] | High-quality DNA extraction from FFPE tissue specimens |
| QIAamp Circulating Nucleic Acid Kit [127] | Optimized isolation of cell-free DNA from plasma | |
| Library Preparation & Target Enrichment | Illumina NGS Library Prep Kits [127] | Construction of sequencing libraries from gDNA and cfDNA |
| Burning Rock 168-Gene Panel [127] | Targeted enrichment of cancer-related genes for sequencing | |
| NEOliquid 39-Gene Panel [128] | Comprehensive plasma sequencing (SNVs, Indels, CNVs, fusions) | |
| Instrumentation | Covaris M220 Ultrasonicator [127] | Controlled, reproducible DNA shearing for tissue gDNA |
| Illumina NextSeq 500 [127] | High-throughput sequencing platform | |
| Computational & Analytical Tools | CASCAM Framework [130] | Statistical and ML framework for quantifying congruence between models and tumors |
| Celligner Algorithm [130] | Computational harmonization of transcriptomic data from tumors and cancer models | |
| DELFI Approach [129] | Genome-wide analysis of cfDNA fragmentation patterns for cancer detection |
Emerging Technologies and Future Directions
The field of cancer genotyping is rapidly evolving with several emerging technologies poised to address current limitations. Artificial intelligence and machine learning are being integrated into genomic analysis pipelines to improve the prediction of test results and interpretation of complex genomic data [70] [131]. Fragmentomics approaches analyze cfDNA fragmentation patterns to infer nucleosome positioning and gene expression regulatory dynamics, providing additional layers of epigenetic information beyond mutation detection [129]. Patient-derived tumor organoids are emerging as high-fidelity models that maintain genomic and transcriptomic features of original tumors, serving as valuable platforms for therapeutic profiling and functional validation of genomic findings [132]. CRISPR-based gene editing technologies are also being explored for their potential to correct specific mutations and develop innovative cancer treatments guided by genomic profiling data [70].
Diagram 2: Emerging technologies shaping the future of cancer genotyping and their interconnected applications.
This case study demonstrates that both tissue gDNA and plasma cfDNA genotyping offer distinct advantages and limitations in cancer genomic profiling. While tissue biopsy remains essential for initial diagnosis and provides comprehensive genomic information, liquid biopsy offers a less invasive alternative with utility in disease monitoring, capturing tumor heterogeneity, and identifying resistance mutations. The concordance between these approaches is substantial for certain driver alterations but incomplete overall, suggesting they should be viewed as complementary rather than interchangeable modalities.
For chemogenomic studies and drug development, the integration of both approaches provides the most comprehensive understanding of tumor genomics. Future advances in sequencing technologies, fragmentomics analysis, and computational methods will further enhance the precision and clinical utility of both tissue and liquid biopsy approaches, ultimately advancing the field of precision oncology and improving patient outcomes through more targeted therapeutic interventions.
In chemogenomic studies, which explore the interaction between chemical compounds and biological systems, the choice of biospecimen is fundamental. Genomic DNA (gDNA), typically isolated from white blood cells or tissues, provides a stable representation of an organism's inherited genetic blueprint. In contrast, cell-free DNA (cfDNA) consists of short, fragmented DNA molecules circulating in bodily fluids like blood plasma, released through cellular processes such as apoptosis and necrosis [12]. This fundamental difference in origin translates into distinct analytical capabilities for multi-omics integration.
Next-generation sequencing (NGS) applied to these DNA sources offers different windows into biological systems. gDNA-based approaches are unparalleled for studying inherited genetics and somatic mutations in tissues. However, cfDNA has emerged as a dynamic, liquid biomarker that provides a real-time, systemic snapshot of the body's cellular state, offering unique access to three omics dimensions from a single, minimally invasive sample: genomics (mutations, copy number variations), epigenomics (methylation patterns), and fragmentomics (nucleosome positioning and DNA fragmentation patterns) [12] [133]. This guide objectively compares the multi-omics potential of gDNA-based versus cfDNA-based NGS, providing experimental data and protocols to inform their use in chemogenomic research.
Performance Comparison: gDNA vs. cfDNA in Multi-omics Profiling
The table below summarizes the core performance characteristics of gDNA and cfDNA for multi-omics analysis, based on current literature and experimental data.
Table 1: Comprehensive Performance Comparison of gDNA and cfDNA for Multi-omics Applications
| Analytical Feature | gDNA-based NGS | cfDNA-based NGS | Supporting Experimental Evidence |
|---|---|---|---|
| Genomic Variant Detection | High performance for uniform variant calling. More variants identified due to uniform coverage [13]. | Moderate performance. Allele frequencies and population structure are largely consistent with gDNA, but lower effective depth can limit sensitivity [13]. | Direct comparison in 186 healthy individuals showed gDNA identified more variants, but AF spectra and genomic associations were consistent [13]. |
| Epigenomic Profiling (e.g., Methylation) | Requires separate, bisulfite-converted libraries, leading to DNA degradation [133]. | Superior. Enables direct methylation detection in a single assay without bisulfite conversion (e.g., via EM-seq or nanopore sequencing) [12] [133]. | Enzymatic cytosine conversion (EM-seq) on cfDNA preserves fragmentation information better than bisulfite conversion, allowing concurrent methylation and nucleosome occupancy analysis [133]. |
| Fragmentomics / Nucleosome Occupancy | Limited. Not a native feature of gDNA analysis. | Superior. Native fragmentation pattern is a rich information source, inferring nucleosome occupancy and tissue-of-origin gene regulation [12] [133]. | cfNOMe assay simultaneously measures nucleosome occupancy and methylation from cfDNA fragmentation patterns [133]. |
| Multi-omics in a Single Assay | Not feasible. Different omics layers typically require separate, dedicated experiments. | Highly feasible. Technologies like Oxford Nanopore enable simultaneous detection of genetic, epigenetic, and fragmentomic features in one run [12]. | ONT sequencing acquires cfDNA's multiomics data (genetics, fragmentomics, epigenetics) in a single sequencing run, unlike NGS [12]. |
| Representation of System-wide Biology | Reflects the genetic makeup of the sourced tissue (e.g., blood). | High. Represents a composite, real-time snapshot of contributions from multiple tissues throughout the body [12] [133]. | cfDNA composition provides a "snapshot" of ongoing tissue damage and turnover, as shown in studies of kidney injury and cancer [133]. |
| Input Material & Sample Collection | Requires cellular material (tissue, blood cells). | Minimally invasive; requires plasma or other bodily fluid. Special preservation tubes (e.g., Streck, Roche) are needed to prevent gDNA contamination [31]. | Roche and Streck BCTs effectively minimize white blood cell lysis and gDNA contamination in plasma samples for up to 3-14 days [31]. |
Key Experimental Workflows
The following diagram illustrates the core procedural differences between gDNA and cfDNA processing for multi-omics analysis, highlighting the points at which different omics data can be captured.
Detailed Methodologies for cfDNA Multi-omics
Protocol 1: Comprehensive cfDNA Multi-omics using Nanopore Sequencing
This protocol is adapted from optimized library preparation methods for cfDNA on the Oxford Nanopore Technologies (ONT) platform [12] [27].
- cfDNA Extraction: Extract cfDNA from plasma using a commercial circulating nucleic acid kit (e.g., QIAamp Circulating Nucleic Acid Kit). Increase input volumes if working with urine samples [133].
- Library Preparation (Optimized for short fragments): Use dedicated ONT cfDNA kits (SQK-LSK114 or multiplexed SQK-NBD114.24). A critical optimization is adjusting the bead-to-sample ratio during clean-up steps from 0.8× to 1.8× to increase the recovery efficiency of short cfDNA molecules [12] [27].
- Sequencing: Load the library onto a Nanopore flow cell (e.g., R10.4.1) for sequencing. The platform directly detects nucleotide sequences and base modifications as DNA passes through the pores, eliminating the need for separate assays [12].
- Bioinformatic Analysis: Use integrated pipelines to deconvolve the sequencing signal.
- Genomics: Call single nucleotide variants (SNVs) and copy number variations (CNVs) from the primary sequence.
- Epigenomics: Identify methylation patterns (5mC) directly from the raw current signal.
- Fragmentomics: Calculate the fragment length distribution and nucleosome occupancy patterns from the aligned reads [12].
Protocol 2: Combined Methylation and Nucleosome Occupancy Profiling (cfNOMe)
This protocol uses enzymatic conversion for superior multi-omics data preservation [133].
- Enzymatic Conversion: Perform library preparation using the NEBNext EM-Seq kit. This method enzymatically converts unmodified cytosines, enabling methylation detection while causing significantly less DNA fragmentation and GC bias compared to traditional bisulfite conversion [133].
- Sequencing and Analysis: Sequence on an Illumina or other platform. Use a custom bioinformatic pipeline (e.g., cfNOMe) to simultaneously measure both nucleosome occupancy (inferred from the fragmentation pattern and read density) and methylation profiles from the same dataset [133].
The Scientist's Toolkit: Essential Reagents and Solutions
Table 2: Key Research Reagent Solutions for cfDNA-based Multi-omics Studies
| Item | Function | Example Products & Notes |
|---|---|---|
| Cell-Free DNA Blood Collection Tubes | Preserves blood sample by preventing white blood cell lysis, which contaminates plasma with genomic DNA. | Streck Cell-Free DNA BCT, Roche BCT. Roche tubes showed superior performance in preventing gDNA contamination over 14 days in one study [31]. |
| cfDNA Extraction Kits | Isolates short, low-concentration cfDNA from plasma or other body fluids with high efficiency and purity. | QIAamp Circulating Nucleic Acid Kit (Qiagen). Protocols can be modified for larger input volumes (e.g., 10 mL urine) [133]. |
| Enzymatic Methylation Conversion Kits | Enables methylation profiling without the severe DNA degradation caused by bisulfite treatment, preserving fragmentomics. | NEBNext EM-Seq Kit. Allows for high-quality whole-genome methylation studies with low input DNA [133]. |
| Long-Read Sequencing Kits | Facilitates single-assay detection of genetics, epigenetics, and fragment length. | Oxford Nanopore SQK-LSK114 (single-sample) or SQK-NBD114.24 (multiplexed). Optimized for low cfDNA input (6-15 ng) [12]. |
| Magnetic Beads (SPRI) | Used for DNA purification and size selection during library prep. Ratio is critical for cfDNA yield. | Beads from suppliers like AMPure XP. For cfDNA, a 1.8x bead-to-sample ratio is widely adopted to maximize short fragment recovery, versus the standard 0.8x [12] [27]. |
The choice between gDNA and cfDNA for chemogenomic studies is not a matter of superiority but of strategic alignment with research objectives. gDNA remains the standard for comprehensive germline and somatic genetic analysis where input material is not a constraint. However, for a holistic, multi-omics approach that captures real-time systemic biology through a minimally invasive liquid biopsy, cfDNA is demonstrably superior. Its inherent nature as a fragmented molecule, combined with advances in long-read sequencing and enzymatic conversion technologies, allows researchers to concurrently interrogate genomics, epigenomics, and fragmentomics from a single, streamlined assay. This integrated view can significantly accelerate biomarker discovery and therapeutic monitoring in chemogenomic research.
Conclusion
The choice between gDNA-based and cfDNA-based NGS in chemogenomics is not a matter of superiority but of strategic application. gDNA provides a comprehensive, stable view of the host's genetic blueprint, indispensable for hereditary risk assessment and germline analysis. In contrast, cfDNA offers a dynamic, minimally invasive window into real-time disease processes, particularly valuable for monitoring tumor evolution, treatment response, and minimal residual disease. The integration of AI, the maturation of long-read sequencing for comprehensive multi-omics profiling from a single run, and continued advancements in host depletion and bioinformatics are poised to further blur the lines between these approaches. Future research should focus on standardizing pre-analytical protocols, validating integrated multi-analyte panels, and demonstrating clinical utility in large-scale trials to fully realize the promise of both gDNA and cfDNA in driving forward personalized medicine and rational drug design.
References
- 1. Comparison of methods for circulating cell-free DNA ... [https://pmc.ncbi.nlm.nih.gov/articles/PMC5233878/]
- 2. Analysis of cfDNA fragmentomics metrics and commercial ... [https://www.nature.com/articles/s41467-025-64153-z]
- 3. Next-generation sequencing and its clinical application [https://pmc.ncbi.nlm.nih.gov/articles/PMC6528456/]
- 4. A comparative study of four cell-free DNA assays for ... [https://pmc.ncbi.nlm.nih.gov/articles/PMC12217890/]
- 5. Regular article A Comparison of Cell-Free DNA Isolation Kits [https://www.sciencedirect.com/science/article/pii/S1525157816302215]
- 6. 5 Different DNA Quantification Methods to Consider [https://www.denovix.com/5-different-dna-quantification-methods-to-consider/]
- 7. Quantifying the Detection Sensitivity and Precision of ... [https://pmc.ncbi.nlm.nih.gov/articles/PMC11634988/]
- 8. Applications of NGS [https://www.illumina.com/science/technology/next-generation-sequencing/beginners/applications.html]
- 9. next-generation sequencing for infectious-disease ... [https://www.jci.org/articles/view/178003]
- 10. Circulating tumor nucleic acids: biology, release ... [https://pmc.ncbi.nlm.nih.gov/articles/PMC9862574/]
- 11. Comparison of Circulating Cell-Free DNA Extraction ... [https://pmc.ncbi.nlm.nih.gov/articles/PMC7281769/]
- 12. Advances of nanopore direct sequencing technology and ... [https://pmc.ncbi.nlm.nih.gov/articles/PMC12568403/]
- 13. Cell-free DNA as a potential alternative to genomic DNA in genetic... [https://pubmed.ncbi.nlm.nih.gov/40918064/]
- 14. Cancer liquid biopsies by Oxford Nanopore Technologies ... [https://molecular-cancer.biomedcentral.com/articles/10.1186/s12943-024-02178-6]
- 15. Effects of Collection and Processing Procedures on Plasma ... [https://pmc.ncbi.nlm.nih.gov/articles/PMC6197164/]
- 16. Nanopore sequencing enables tissue-of-origin and ... [https://www.nature.com/articles/s41420-025-02828-8]
- 17. Qualitative and quantitative comparison of cell-free DNA and ... [https://translational-medicine.biomedcentral.com/articles/10.1186/s12967-020-02671-8]
- 18. Potential of modern circulating cell-free DNA diagnostic ... [https://pmc.ncbi.nlm.nih.gov/articles/PMC7394254/]
- 19. Dynamics and Half-Life of Cell-Free DNA After Exercise [https://pmc.ncbi.nlm.nih.gov/articles/PMC11720216/]
- 20. Cell-free DNA analysis in current cancer clinical trials [https://www.nature.com/articles/s41416-021-01696-0]
- 21. Enhanced detection of circulating tumor DNA by fragment size ... [https://pmc.ncbi.nlm.nih.gov/articles/PMC6483061/]
- 22. Evaluating the quantity, quality and size distribution of cell ... [https://www.nature.com/articles/s41598-020-69432-x]
- 23. Fragment size and level of cell-free DNA provide prognostic ... [https://translational-medicine.biomedcentral.com/articles/10.1186/s12967-018-1677-2]
- 24. Differences in the genomic profiles of cell‐free DNA ... [https://pmc.ncbi.nlm.nih.gov/articles/PMC6434190/]
- 25. Circulating tumor DNA to monitor treatment response in ... [https://www.nature.com/articles/s41698-025-00876-y]
- 26. The development and applications of circulating tumour ... [https://pmc.ncbi.nlm.nih.gov/articles/PMC12082331/]
- 27. Frontiers | Advances of nanopore direct sequencing technology and... [https://www.frontiersin.org/journals/molecular-biosciences/articles/10.3389/fmolb.2025.1662587/full]
- 28. Direct comparison of circulating tumor DNA sequencing ... [https://pmc.ncbi.nlm.nih.gov/articles/PMC9049497/]
- 29. Comparative analysis of genomic profiles between tissue ... [https://www.sciencedirect.com/science/article/abs/pii/S0169500223008206]
- 30. Clinical utility of liquid biopsy next-generation sequencing ... [https://www.nature.com/articles/s41598-025-13667-z]
- 31. Performance comparison of blood collection tubes as liquid biopsy... [https://pubmed.ncbi.nlm.nih.gov/30191594/]
- 32. Analytical Performance Evaluation of a 523-Gene ... [https://pubmed.ncbi.nlm.nih.gov/37865292/]
- 33. Application of cell-free DNA for genomic tumor profiling [https://pmc.ncbi.nlm.nih.gov/articles/PMC6402712/]
- 34. Cell-free DNA analysis in healthy individuals by next- ... [https://www.nature.com/articles/s41419-019-1770-3]
- 35. Clinical applications of cell-free DNA-based liquid biopsy ... [https://www.sciencedirect.com/science/article/pii/S1936523325002505]
- 36. Performance Comparison of Droplet Digital PCR and Next ... [https://pmc.ncbi.nlm.nih.gov/articles/PMC12062871/]
- 37. How to Work with Challenging or Limited Genomic ... [https://blog.omni-inc.com/blog/how-to-work-with-challenging-or-limited-genomic-samples-updated-for-2025]
- 38. Comparison of plasma and blood cell samples in ... [https://pmc.ncbi.nlm.nih.gov/articles/PMC11152940/]
- 39. How-to: NGS Quality Control [https://frontlinegenomics.com/how-to-ngs-quality-control/]
- 40. Why quality control (QC) is performed for NGS testing [https://3billion.io/blog/why-quality-control-qc-is-performed-for-ngs-testing]
- 41. Comparative Diagnostic Accuracy of Metagenomic Next ... [https://www.sciencedirect.com/science/article/pii/S0163445325002610]
- 42. Diagnostic accuracy of next-generation sequencing (NGS) ... [https://link.springer.com/article/10.1007/s12094-025-04040-7]
- 43. Cell-free DNA as a potential alternative to genomic ... [https://pmc.ncbi.nlm.nih.gov/articles/PMC12408905/]
- 44. A standardized framework for robust fragmentomic feature ... [https://genomebiology.biomedcentral.com/articles/10.1186/s13059-025-03607-5]
- 45. Which NGS DNA Library Prep Kit should you choose? [https://frontlinegenomics.com/which-ngs-dna-library-prep-kit-should-you-choose/]
- 46. Summarizing and correcting the GC content bias in high- ... [https://pmc.ncbi.nlm.nih.gov/articles/PMC3378858/]
- 47. GCfix: a fast and accurate fragment length-specific method ... [https://pubmed.ncbi.nlm.nih.gov/40353837/]
- 48. A framework for clinical cancer subtyping from nucleosome ... [https://www.nature.com/articles/s41467-022-35076-w]
- 49. Reducing GC & PCR Bias in Whole-Genome Sequencing [https://www.revvity.com/blog/understanding-impact-gc-and-pcr-biases-whole-genome-sequencing]
- 50. Fragment Length of Circulating Tumor DNA - PMC [https://pmc.ncbi.nlm.nih.gov/articles/PMC4948782/]
- 51. Unsupervised detection of fragment length signatures ... [https://elifesciences.org/articles/71569]
- 52. a comparison of library preparation methods for Illumina ... [https://pmc.ncbi.nlm.nih.gov/articles/PMC8805253/]
- 53. Comparative Meta-Analysis of Long-Read and Short-Read ... [https://pmc.ncbi.nlm.nih.gov/articles/PMC12566492/]
- 54. Long-read sequencing vs short-read sequencing [https://frontlinegenomics.com/long-read-sequencing-vs-short-read-sequencing/]
- 55. Methodological Comparison of Short-Read and Long ... [https://www.mdpi.com/1422-0067/26/18/9254]
- 56. Next Generation Sequencing-Based Profiling of Cell Free ... [https://pmc.ncbi.nlm.nih.gov/articles/PMC7766403/]
- 57. Comparative Analysis of PacBio and Oxford Nanopore ... [https://pmc.ncbi.nlm.nih.gov/articles/PMC8399832/]
- 58. High performance of targeted next generation sequencing on ... [https://jeccr.biomedcentral.com/articles/10.1186/s13046-017-0591-4]
- 59. Single-molecule genome-wide mutation profiles of cell-free ... [https://www.nature.com/articles/s41588-023-01446-3]
- 60. Prevalence of Rare Genetic Variations and Their ... [https://www.nature.com/articles/s41598-017-09247-5]
- 61. Predicting somatic mutation origins in cell-free DNA by ... [https://www.sciencedirect.com/science/article/pii/S2405844024154102]
- 62. Liquid Biopsy to Detect Minimal Residual Disease [https://pmc.ncbi.nlm.nih.gov/articles/PMC8582541/]
- 63. Limitations and opportunities of technologies for the analysis ... [https://pmc.ncbi.nlm.nih.gov/articles/PMC9336539/]
- 64. Pros and Cons of using FFPE vs Cell-free DNA in NGS ... [https://www.biochain.com/blog/pros-and-cons-of-using-ffpe-vs-cell-free-dna-in-ngs-applications/]
- 65. cfDNA or Genomic DNA-Based mNGS Assays [https://micronbrane.com/cell-free-or-genomic-dna-based-mngs-assays/]
- 66. Next-Generation Sequencing Technology: Current Trends ... [https://pmc.ncbi.nlm.nih.gov/articles/PMC10376292/]
- 67. Pharmacogenomics: How Genes Impact Drugs [https://www.paragongenomics.com/pharmacogenomics-in-the-real-world-a-look-at-top-genes-impacting-drug-response/]
- 68. Cell-free DNA and next-generation sequencing in the ... [https://pmc.ncbi.nlm.nih.gov/articles/PMC5342606/]
- 69. The Role of Next-Generation Sequencing in ... [https://pmc.ncbi.nlm.nih.gov/articles/PMC6360866/]
- 70. Advances in personalized medicine: translating genomic ... [https://pmc.ncbi.nlm.nih.gov/articles/PMC12106117/]
- 71. Next Generation Sequence Testing: Essential 2025 Guide [https://lifebit.ai/blog/next-generation-sequence-testing/]
- 72. Leveraging circulating microbial DNA for early cancer ... [https://pmc.ncbi.nlm.nih.gov/articles/PMC10873208/]
- 73. Strategies for improving detection of circulating tumor DNA ... [https://www.sciencedirect.com/science/article/pii/S0305737223000889]
- 74. Accurate detection of circulating tumor DNA using ... [https://www.nature.com/articles/s41525-021-00272-y]
- 75. Comparative analysis of metagenomic next-generation ... [https://pmc.ncbi.nlm.nih.gov/articles/PMC11934473/]
- 76. Clinical evaluation of cell-free and cellular metagenomic ... [https://www.sciencedirect.com/science/article/pii/S2090123223000681]
- 77. Open chromatin-guided interpretable machine learning ... [https://www.nature.com/articles/s42003-025-08920-0]
- 78. Analysis of cfDNA fragmentomics metrics and commercial ... [https://pmc.ncbi.nlm.nih.gov/articles/PMC12521513/]
- 79. Comparison of metagenomic next-generation sequencing ... [https://www.frontiersin.org/journals/cellular-and-infection-microbiology/articles/10.3389/fcimb.2022.1042945/full]
- 80. Optimization of Metagenomic Next-Generation Sequencing ... [https://pmc.ncbi.nlm.nih.gov/articles/PMC12436562/]
- 81. Benefits and challenges of host depletion methods in ... [https://www.nature.com/articles/s41522-025-00762-2]
- 82. Novel and Efficient Protocol for DNA Coating-Based ... [https://pmc.ncbi.nlm.nih.gov/articles/PMC7816784/]
- 83. Optimizing genomic DNA extraction from long-term ... [https://pmc.ncbi.nlm.nih.gov/articles/PMC11653494/]
- 84. Serial Next Generation Sequencing of Circulating Cell Free ... [https://pmc.ncbi.nlm.nih.gov/articles/PMC4580992/]
- 85. Clinical utility of Next Generation Sequencing of plasma ... [https://www.sciencedirect.com/science/article/pii/S1936523323002553]
- 86. Evaluation of DNA extraction kits for long-read shotgun ... [https://www.nature.com/articles/s41598-024-80660-3]
- 87. Influence of pre-analytical factors on the success rates ... [https://link.springer.com/article/10.1007/s00428-025-04294-0]
- 88. QIAamp DNA Kits | Genomic DNA Isolation [https://www.qiagen.com/us/products/discovery-and-translational-research/dna-rna-purification/dna-purification/genomic-dna/qiaamp-dna-kits]
- 89. Nucleic acid purification kits [https://www.biosearchtech.com/products/nucleic-acid-sample-preparation/nucleic-acid-extraction-and-purification-reagents/nucleic-acid-purification-kits]
- 90. cfDNA Sequencing: Technological Approaches and ... [https://pmc.ncbi.nlm.nih.gov/articles/PMC8234829/]
- 91. Unique Molecular Identifiers (UMIs) - Sequencing [https://www.illumina.com/techniques/sequencing/ngs-library-prep/multiplexing/unique-molecular-identifiers.html]
- 92. How to Improve Your RNA-Seq Data with UMIs and ERCC ... [https://blog.genewiz.com/how-to-improve-your-rna-seq-data-with-umis-and-ercc-rna]
- 93. What are Unique Molecular Identifiers (UMIs) and Why do ... [https://www.lexogen.com/blog/rna-lexicon-what-are-unique-molecular-identifiers-umis-and-why-do-we-need-them/]
- 94. Gene length and detection bias in single cell RNA ... [https://pmc.ncbi.nlm.nih.gov/articles/PMC5428526/]
- 95. A Sensitivity and Consistency Comparison Between Next- ... [https://pubmed.ncbi.nlm.nih.gov/39599828/]
- 96. Performance comparison of next-generation sequencing ... [https://www.nature.com/articles/srep42215]
- 97. The Little Sequences That Could: How UDIs and UMIs ... [https://www.twistbioscience.com/blog/science/NGS-UDI-UMI-Adapters]
- 98. 2025 Trends: NGS [https://www.genengnews.com/topics/genome-editing/2025-trends-ngs/]
- 99. Identification of Clonal Hematopoiesis Mutations in Solid ... [https://pmc.ncbi.nlm.nih.gov/articles/PMC6812550/]
- 100. Discovering the drivers of clonal hematopoiesis [https://www.nature.com/articles/s41467-022-31878-0]
- 101. Utility of Serial cfDNA NGS for Prospective Genomic Analysis ... [https://pmc.ncbi.nlm.nih.gov/articles/PMC8232437/]
- 102. Real-World Technical Hurdles of ctDNA NGS Analysis [https://pmc.ncbi.nlm.nih.gov/articles/PMC12564474/]
- 103. DNA Sequencing: How to Choose the Right Technology [https://frontlinegenomics.com/dna-sequencing-how-to-choose-the-right-technology/]
- 104. Benchmarking of variant calling software for whole-exome ... [https://www.nature.com/articles/s41598-025-97047-7]
- 105. Comparison of Read Mapping and Variant Calling Tools for ... [https://pmc.ncbi.nlm.nih.gov/articles/PMC7238416/]
- 106. Comparative analysis of metagenomic next-generation ... [https://bmcmicrobiol.biomedcentral.com/articles/10.1186/s12866-025-03887-8]
- 107. Analytical Validation of a Pan-Cancer NGS Assay for In- ... [https://www.sciencedirect.com/science/article/pii/S152515782500220X]
- 108. A targeted next-generation sequencing panel for ... [https://www.nature.com/articles/s41598-025-08039-6]
- 109. Analytical and clinical validation of a NGS panel in ... [https://pmc.ncbi.nlm.nih.gov/articles/PMC11464656/]
- 110. Direct comparison of circulating tumor DNA sequencing ... [https://journals.plos.org/plosone/article?id=10.1371/journal.pone.0266889]
- 111. Sensitivity, specificity, and accuracy of a liquid biopsy ... [https://www.nature.com/articles/s41598-021-89592-8]
- 112. Evaluating sensitivity of NGS-based mutation detection ... [https://pmc.ncbi.nlm.nih.gov/articles/PMC12486888/]
- 113. Early cancer detection: Analysis of a comprehensive ... [https://pmc.ncbi.nlm.nih.gov/articles/PMC12547112/]
- 114. Putting early cancer detection to the test [https://www.nature.com/articles/d41586-025-00530-4]
- 115. Evaluation of an innovative multi-cancer early detection test [https://www.frontiersin.org/journals/oncology/articles/10.3389/fonc.2025.1520869/full]
- 116. A comparative study on ctDNA and tumor DNA mutations in ... [https://pmc.ncbi.nlm.nih.gov/articles/PMC10691057/]
- 117. Development and performance of a next generation ... [https://www.sciencedirect.com/science/article/pii/S0009898123004497]
- 118. Turnaround Time of Plasma Next-Generation Sequencing ... [https://pmc.ncbi.nlm.nih.gov/articles/PMC7529535/]
- 119. Standardized Workflow and Analytical Validation of Cell ... [https://www.mdpi.com/2073-4409/14/14/1062]
- 120. 2025 and Beyond: The Future of Genomic Data Analysis ... [https://blog.crownbio.com/2025-and-beyond-the-future-of-genomic-data-analysis-and-innovations-in-genomics-services]
- 121. Next-generation sequencing diagnostics of bacteremia in ... [https://pmc.ncbi.nlm.nih.gov/articles/PMC5944698/]
- 122. Comparative of clinical performance between next ... [https://pubmed.ncbi.nlm.nih.gov/35995673/]
- 123. Role of cell-free DNA levels in the diagnosis and prognosis ... [https://pmc.ncbi.nlm.nih.gov/articles/PMC11361684/]
- 124. Clinical diagnostic performance of droplet digital PCR for ... [https://pmc.ncbi.nlm.nih.gov/articles/PMC11702014/]
- 125. Workflow overview: 16S sequencing [https://nanoporetech.com/resource-centre/workflow-16s-sequencing]
- 126. Concordance between genomic alterations assessed by next ... [https://pmc.ncbi.nlm.nih.gov/articles/PMC5323161/]
- 127. Concordance of Genomic Profiles in Matched Tissue and ... [https://pmc.ncbi.nlm.nih.gov/articles/PMC9597027/]
- 128. Concordance between Comprehensive Cancer Genome ... [https://www.sciencedirect.com/science/article/pii/S1556086417306111]
- 129. At the dawn: cell-free DNA fragmentomics and gene ... [https://www.nature.com/articles/s41416-021-01635-z]
- 130. Systems approach for congruence and selection of cancer ... [https://pmc.ncbi.nlm.nih.gov/articles/PMC10805322/]
- 131. Real time machine learning prediction of next generation ... [https://www.nature.com/articles/s41746-025-01816-7]
- 132. A pan-cancer organoid platform for precision medicine [https://www.sciencedirect.com/science/article/pii/S2211124721008469]
- 133. cfNOMe — A single assay for comprehensive epigenetic analyses of... [https://genomemedicine.biomedcentral.com/articles/10.1186/s13073-020-00750-5]