Cross-Species Validation of Candidate Genes for Chicken Economic Traits: From Genomic Discovery to Biomedical Application
This article synthesizes the latest genomic strategies for identifying and validating candidate genes governing economically vital traits in chickens, with direct implications for poultry science and biomedical research.
Cross-Species Validation of Candidate Genes for Chicken Economic Traits: From Genomic Discovery to Biomedical Application
Abstract
This article synthesizes the latest genomic strategies for identifying and validating candidate genes governing economically vital traits in chickens, with direct implications for poultry science and biomedical research. We explore the foundational principles of comparative genomics and genome-wide association studies (GWAS) that underpin gene discovery for traits like growth, reproduction, and disease resistance. The content details advanced methodological frameworks, including multi-omics integration and CRISPR/Cas9 editing, for functional characterization. Furthermore, it addresses critical challenges in validation, such as resolving linkage disequilibrium and accounting for non-coding regulatory variation, and establishes a rigorous paradigm for cross-species validation of genetic mechanisms. This resource provides researchers and drug development professionals with a comprehensive roadmap for translating avian genomic insights into advancements in agriculture and human medicine.
The Genomic Landscape of Chicken Economic Traits: Key Genes and Discovery Frameworks
The genetic improvement of poultry represents a cornerstone of global food security, with chicken serving as both a primary source of animal protein and a critical model organism in evolutionary biology. Understanding the genetic architecture underlying key economic traits—growth, meat quality, reproduction, and disease resistance—enables more precise breeding strategies and enhanced production efficiency. Recent advances in genomic technologies have facilitated the identification of candidate genes and molecular pathways controlling these complex polygenic traits. This review synthesizes current research on validating candidate genes for chicken economic traits across species, providing a comparative analysis of experimental approaches, key findings, and methodological frameworks that bridge poultry science with broader evolutionary biology.
Decoding the Genetic Architecture of Key Economic Traits
Growth Traits: From Quantitative Genetics to Candidate Genes
Growth performance remains a paramount selection target in broiler breeding programs worldwide, with body weight and feed efficiency serving as primary breeding objectives. Quantitative genetic analyses consistently demonstrate high heritability estimates for growth traits, with body weight at different ages showing h² values ranging from 0.28 to 0.45 [1]. Advanced genomic approaches have enabled researchers to move beyond traditional selection methods to identify specific genetic variants underlying these traits.
Table 1: Key Candidate Genes Associated with Growth Traits in Chickens
| Gene Symbol | Chromosomal Location | Associated Trait | Proposed Function | Study |
|---|---|---|---|---|
| NCAPG | Not specified | Muscle development | Cell division and growth | [2] |
| LDB2 | Multiple chromosomes | General growth | Transcription factor | [2] [1] |
| IGF2BP1 | Not specified | Body weight | RNA binding and regulation | [1] |
| TGFBR2 | Not specified | General growth | Transforming growth factor beta signaling | [1] |
| MYF5 | Not specified | Muscle development | Myogenic factor | [2] |
| MYF6 | Not specified | Muscle development | Myogenic factor | [2] |
| GLI3 | Not specified | General growth | Hedgehog signaling pathway | [1] |
| GATA4 | Not specified | General growth | Transcription factor | [1] |
| AKT1 | Not specified | Muscle development | Insulin signaling pathway | [2] |
| LCORL | Not specified | General growth | Transcription factor | [3] |
Genome-wide association studies (GWAS) have emerged as a powerful tool for identifying quantitative trait nucleotides (QTNs) associated with growth variations. One comprehensive analysis identified 113 QTNs significantly associated with eight growth traits distributed across multiple chromosomes, with particularly notable concentrations on chromosomes 1, 2, 3, and 4 [1]. The LDB2 gene, repeatedly identified in multiple studies, encodes a transcription factor that regulates various developmental processes [2] [1]. Similarly, TGFBR2 functions within the transforming growth factor-beta signaling pathway, which plays crucial roles in cell proliferation, differentiation, and apoptosis [1].
The development of multi-locus GWAS methods, including mrMLM, FASTmrMLM, and FASTmrEMMA, has enhanced statistical power for detecting small-effect QTNs that collectively explain significant portions of phenotypic variance [1]. These approaches have successfully identified genes such as IGF2BP1 (insulin-like growth factor 2 mRNA binding protein 1) and GATA4 (GATA binding protein 4), which are involved in fundamental growth regulation pathways [1].
Meat Quality Attributes: Molecular Determinants and Genetic Markers
Meat quality encompasses multiple sensory, nutritional, and technological attributes, including tenderness, color, flavor, and composition. Consumer preferences for specific meat characteristics have driven research into the genetic basis of these traits, particularly in indigenous chicken breeds known for superior meat quality.
Table 2: Candidate Genes Associated with Meat Quality Traits in Chickens
| Gene Symbol | Associated Trait | Proposed Function | Study |
|---|---|---|---|
| P2RX5 | Meat quality (a* value, cooking loss) | Purinergic receptor | [4] |
| A-FABP | Meat quality | Fatty acid binding protein | [3] |
| H-FABP | Meat quality | Fatty acid binding protein | [3] |
| PRKAB2 | Meat quality | AMP-activated protein kinase subunit | [3] |
| ELOVL6 | Fat deposition | Fatty acid elongation | [2] |
| KLF6 | Fat deposition | Transcription factor | [2] |
Recent integrative approaches combining metabolomics, lipidomics, and transcriptomics have identified the purinergic receptor P2RX5 as a key regulator of meat quality traits [4]. Single nucleotide polymorphisms (SNPs) within the P2RX5 gene show significant associations with critical meat quality parameters including a* value (redness) and cooking loss [4]. Additionally, genes involved in lipid metabolism such as A-FABP (adipocyte fatty acid-binding protein) and H-FABP (heart fatty acid-binding protein) influence intramuscular fat deposition and fatty acid composition, directly affecting meat flavor and juiciness [3].
Fat deposition traits, which directly impact meat quality, are modulated by genes including ELOVL6 (fatty acid elongase) and KLF6 (Kruppel-like factor 6), both identified through runs of homozygosity (ROH) analysis in specialized breeds [2]. The PRKAB2 gene, encoding a subunit of AMP-activated protein kinase, serves as a central regulator of cellular energy metabolism and has been implicated in meat quality variations [3].
Reproductive Efficiency: Genetic Controls of Egg Production
Reproductive performance in layer chickens encompasses multiple traits, including age at first egg (AFE), egg number (EN), and clutch characteristics. Understanding the genetic architecture of these traits is essential for improving egg production efficiency, particularly in indigenous breeds where genetic diversity remains high but productivity is often lower than in commercial lines.
Table 3: Candidate Genes Associated with Reproductive Traits in Chickens
| Gene Symbol | Associated Trait | Proposed Function | Study |
|---|---|---|---|
| SCUBE1 | Age at first egg | Follicular development | [5] |
| KRAS | Age at first egg | Metabolic pathways | [5] |
| IGF1 | Clutch size, egg number | mTOR and insulin signaling | [5] |
| PTK2 | Clutch size, egg number | mTOR and insulin signaling | [5] |
| SOX5 | Egg production | Transcriptional regulation | [5] |
| PPFIBP1 | Egg production | Cell adhesion | [5] |
GWAS analyses in Wuhua yellow chickens, an indigenous breed, have identified 871 significant SNPs associated with egg production traits, annotating 379 candidate genes [5]. The SCUBE1 (signal peptide, CUB domain, and EGF-like domain containing 1) and KRAS (Kirsten rat sarcoma viral oncogene homolog) genes have emerged as important regulators of AFE, primarily through their roles in follicular development and metabolic pathways [5]. Similarly, IGF1 (insulin-like growth factor 1) and PTK2 (protein tyrosine kinase 2) associate with clutch size and total egg number via the mTOR and insulin signaling pathways, which coordinate nutrient sensing with reproductive investment [5].
Notably, 13 quantitative trait loci (QTLs) associated with reproductive traits overlap with known reproductive loci, including SOX5 (SRY-box transcription factor 5) and PPFIBP1 (PPFIA binding protein 1), highlighting conserved genetic mechanisms across chicken populations [5]. Functional enrichment analyses further reveal that these candidate genes participate in critical biological processes including cell adhesion, hormone signaling, and oocyte maturation pathways [5].
Disease Resistance: Immunogenetic Foundations of Host Defense
Disease resistance represents a crucial economic trait in poultry production, with genetic factors significantly influencing susceptibility to various pathogens. Immunogenetic research has identified numerous candidate genes associated with enhanced disease resistance, offering potential for marker-assisted selection to improve flock health and reduce antibiotic dependence.
Comparative genomic analyses have identified several genes associated with disease resistance traits, including C1QBP (complement C1q binding protein), VAV2 (vav guanine nucleotide exchange factor 2), and IL12B (interleukin 12B) [3]. These genes function within innate and adaptive immune pathways, modulating pathogen recognition, immune cell activation, and inflammatory responses. Functional annotation of disease resistance candidates reveals enrichment for pathways including the B-cell receptor and T-cell receptor signaling pathways, highlighting the importance of both humoral and cellular immunity in avian host defense [6].
Methodological Framework: Experimental Approaches for Trait Validation
Genomic Technologies and Breeding Applications
Modern poultry genetics employs diverse methodological approaches to identify and validate candidate genes for economic traits. Each method offers distinct advantages and limitations, with multi-faceted approaches providing the most comprehensive insights.
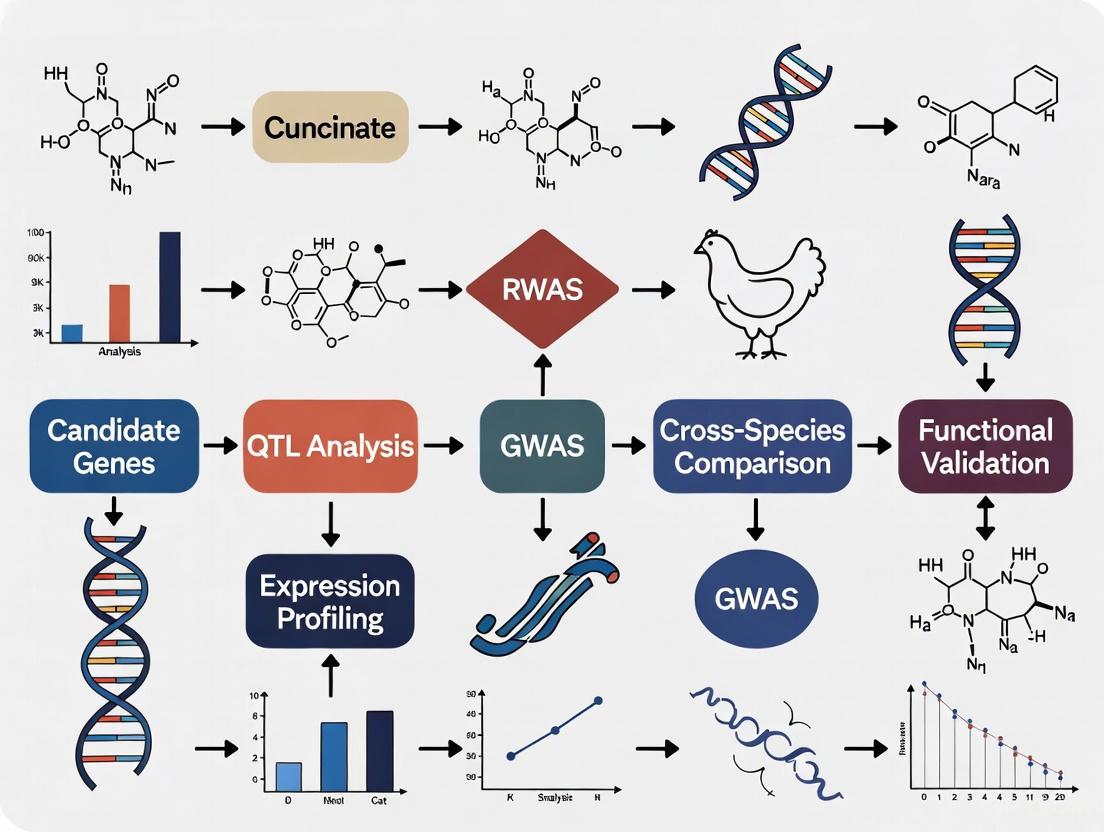
Figure 1: Experimental workflow for identifying and validating candidate genes for economic traits in chickens, integrating multiple genomic approaches.
Genome-Wide Association Studies: Protocols and Applications
GWAS represents a foundational approach for identifying genetic variants associated with complex traits. The standard protocol involves:
Population Selection: Studies typically employ distinct populations, such as the Chengkou mountain chicken A-lineage (n=464) [2] [6] or F2 crosses between different breeds (n=319) [7], to ensure sufficient genetic diversity for association detection.
Genotyping and Quality Control: High-density SNP arrays or whole-genome sequencing generate genotype data. For example, studies utilizing the 600K Affymetrix Axiom HD genotyping array or Illumina 60K SNP Beadchip implement rigorous quality control filters, including individual missing rate <0.01, site missing rate <0.01, and minor allele frequency (MAF) >0.01 [8].
Association Analysis: Mixed linear models (MLM) account for population structure and genetic relationships, with principal components included as covariates. Multi-locus methods like mrMLM, FASTmrMLM, and FASTmrEMMA employ a logarithm of odds (LOD) threshold ≥3 for significance detection without overly stringent multiple testing corrections [1].
Candidate Gene Annotation: Significantly associated SNPs are mapped to the reference genome, with genes within proximity (typically ±500 kb) considered candidates. Functional annotation follows using Gene Ontology (GO) and Kyoto Encyclopedia of Genes and Genomes (KEGG) databases [6].
Runs of Homozygosity (ROH) Analysis
ROH analysis identifies long, continuous homozygous segments in the genome, reflecting inbreeding and selective signatures. The standard methodology includes:
ROH Detection: Software like PLINK identifies ROH segments using sliding window approaches with parameters accounting for SNP density, heterozygous calls, and segment length [2].
ROH Island Identification: Genomic regions with high ROH frequency across individuals (top 0.5%) indicate selection signatures. For example, analysis of 464 CMC-A chickens identified 414 ROH islands containing 317 candidate genes [6].
Functional Annotation: Genes within ROH islands undergo functional enrichment analysis to identify biological processes under selection. Studies consistently find ROH islands enriched for genes involved in stress resistance, muscle development, and metabolic processes [2].
Cross-Species Comparative Genomics
Comparative genomic approaches leverage evolutionary conservation to identify functionally important genes. The standard analytical pipeline includes:
Ortholog Identification: Software such as OrthoFinder clusters protein sequences from multiple species (e.g., chicken, duck, goose, cow, sheep, pig, human, zebrafish) into orthologous groups using sequence similarity searches with E-value thresholds of 0.001 [3].
Phylogenetic Analysis and Divergence Time Estimation: Single-copy orthologs undergo multiple sequence alignment using MAFFT, with phylogenetic trees constructed using maximum likelihood methods in IQ-TREE [3].
Selection Analysis: The CodeML module of PAML implements branch-site models to detect positive selection, with likelihood ratio tests identifying genes showing evidence of adaptive evolution [3].
Synteny Analysis: Genomic collinearity between species identifies conserved regulatory blocks, with algorithms like interspecies point projection (IPP) identifying orthologous regulatory elements despite sequence divergence [9].
The Scientist's Toolkit: Essential Research Reagents and Solutions
Table 4: Essential Research Reagents and Solutions for Poultry Genomics Research
| Reagent/Resource | Specific Example | Application | Reference |
|---|---|---|---|
| Genotyping Arrays | 600K Affymetrix Axiom HD, Illumina 60K SNP Beadchip | Genome-wide variant detection | [8] |
| Reference Genomes | GRCg6a, GRCg7b (Gallus gallus) | Read alignment and annotation | [8] [6] |
| Sequence Alignment Tools | MAFFT (v7.205) | Multiple sequence alignment | [3] |
| Orthology Detection | OrthoFinder (v2.4.0) | Gene family clustering | [3] |
| GWAS Software | PLINK (v1.9), GCTA (v1.94), mrMLM (v4.0.2) | Association analysis | [2] [8] [1] |
| Selection Analysis | PAML (v4.9i) CodeML module | Positive selection detection | [3] |
| Functional Annotation | GO, KEGG databases | Pathway enrichment analysis | [3] [6] |
Conserved Biological Pathways Across Economic Traits
Integration of candidate gene analyses reveals several conserved biological pathways that recurrently associate with multiple economic traits in chickens:
Figure 2: Key biological pathways and their associations with multiple economic traits in chickens. Solid lines indicate primary associations; dashed lines represent secondary connections.
The insulin/IGF signaling pathway emerges as a central regulator connecting growth, reproduction, and metabolism. Genes including IGF1 and IGF2BP1 influence growth traits through the regulation of cellular proliferation and protein synthesis [1] [5], while simultaneously affecting reproductive efficiency through nutrient-sensing mechanisms that coordinate energy allocation [5]. Similarly, transforming growth factor-beta (TGF-β) signaling components such as TGFBR2 participate in skeletal muscle development [1], while also modulating immune responses that contribute to disease resistance [3].
The mTOR pathway serves as another integrative node, connecting nutrient availability with reproductive investment through genes including IGF1 and PTK2 [5]. Lipid metabolism pathways, involving genes such as A-FABP, H-FABP, and ELOVL6, directly impact meat quality through intramuscular fat deposition [2] [3], while also influencing energy availability for growth processes [2].
The validation of candidate genes for core economic traits in chickens has progressed substantially through integrated genomic approaches. GWAS, ROH analyses, and comparative genomics have identified numerous candidate genes with verified effects on growth, meat quality, reproduction, and disease resistance. The emergence of conserved biological pathways across these traits highlights the interconnected nature of avian physiology and the potential for multi-trait selection approaches.
Future research directions should prioritize functional validation of candidate genes through gene editing and functional genomics, integration of multi-omics data to refine transcriptional and epigenetic regulation, and development of improved genomic prediction models that incorporate functional annotations. Furthermore, expanding comparative genomic analyses across broader evolutionary distances will enhance our understanding of conserved genetic mechanisms underlying economically important traits.
The continued identification and validation of candidate genes will enable more precise genomic selection in poultry breeding, enhancing production efficiency while maintaining genetic diversity. This progress supports the development of sustainable poultry production systems capable of meeting global food demands in changing environmental conditions.
The genetic improvement of chickens, a critical source of global animal protein, increasingly relies on identifying and validating genes that control economically important traits. This guide provides a comparative analysis of validated candidate genes for key traits—growth, meat quality, feed efficiency, reproductive performance, and melanin deposition—synthesized from recent genomics studies. We objectively compare the supporting experimental data and methodologies, framing this within the broader thesis that cross-species comparative genomics and multi-omics integration are revolutionizing the validation of causal genes in avian species.
Comparative Tables of Validated Candidate Genes
Table 1: Candidate Genes for Primary Economic Traits in Chickens
| Trait Category | Candidate Gene | Key Supporting Evidence | Associated Phenotype / Function |
|---|---|---|---|
| Growth Traits | TBX22 |
Comparative Genomic Analysis [3] [10] | Skeletal and body growth development |
LCORL |
Comparative Genomic Analysis [3] [10] | Stature and body size regulation | |
GH |
Comparative Genomic Analysis [3] [10] | Overall growth rate and metabolism | |
| Meat Quality Traits | A-FABP |
Comparative Genomic Analysis [3] [10] | Fat deposition and intramuscular fat content |
H-FABP |
Comparative Genomic Analysis [3] [10] | Fatty acid composition and marbling | |
PRKAB2 |
Comparative Genomic Analysis [3] [10] | Energy sensing, impacting meat quality | |
| Feed Efficiency | PLCE1 |
GWAS in Wenchang Chickens [11] | Residual Feed Intake (RFI) |
LAP3 |
GWAS in Wenchang Chickens [11] | Body weight and feed efficiency | |
MED28 |
GWAS in Wenchang Chickens [11] | Body weight and feed efficiency | |
| Reproductive Traits | IGF-1 |
Comparative Genomic Analysis [3] [10] | Egg production and maturation |
SLC25A29 |
Comparative Genomic Analysis [3] [10] | Reproductive efficiency | |
WDR25 |
Comparative Genomic Analysis [3] [10] | Egg-laying performance | |
| Disease Resistance | C1QBP |
Comparative Genomic Analysis [3] [10] | Immune response and pathogen defense |
VAV2 |
Comparative Genomic Analysis [3] [10] | Immune cell signaling | |
IL12B |
Comparative Genomic Analysis [3] [10] | Inflammation and immune regulation |
Table 2: Key Candidate Genes for Melanin Deposition in Chicken Muscle and Skin
| Candidate Gene | Key Supporting Evidence | Proposed Molecular Function |
|---|---|---|
TYR |
Transcriptome profiling in Tengchong Snow chicken [12]; Whole-transcriptome sequencing in Xichuan black-bone chicken [13]; Dynamic transcriptome analysis in Yugan chicken [14] | Key enzyme in melanin synthesis pathway; rate-limiting step of tyrosine conversion. |
TYRP1 |
Transcriptome & metabolome analysis in Yanjin & Jinling chickens [15]; Dynamic transcriptome analysis in Yugan chicken [14] | Stabilizes TYR enzyme; modulates eumelanin synthesis. |
DCT |
Transcriptome profiling in Tengchong Snow chicken [12]; Whole-transcriptome sequencing in Xichuan black-bone chicken [13]; Dynamic transcriptome analysis in Yugan chicken [14] | Melanogenic enzyme involved in eumelanin synthesis. |
EDNRB2 |
Transcriptome profiling in Tengchong Snow chicken [12]; Transcriptome & metabolome analysis in Yanjin & Jinling chickens [15]; Dynamic transcriptome analysis (signaling pathway) [14] | Receptor in endothelin signaling; promotes melanocyte proliferation/differentiation. |
KIT |
Transcriptome & metabolome analysis in Yanjin & Jinling chickens [15] | Receptor for stem cell factor; critical for melanocyte survival and migration. |
MITF |
Transcriptome profiling in Tengchong Snow chicken [12] | Master regulator of melanocyte development and melanogenic gene transcription. |
GPNMB |
Dynamic transcriptome analysis in Yugan chicken [14] | Involved in melanosome maturation and pigment cell differentiation. |
Experimental Data and Validation Protocols
Genomic Selection and Cross-Species Comparison
Protocol Overview: This approach identifies genes under selection or conserved across species that are associated with traits of interest.
- Gene Family Clustering: Protein sequences from multiple species (e.g., chicken, duck, cow, human, zebrafish) are clustered into orthologous groups using tools like OrthoFinder [3].
- Phylogenetic and Divergence Time Analysis: Single-copy orthologs are used to construct a phylogenetic tree and estimate species divergence times [3].
- Analysis of Gene Family Expansion/Contraction: Software like CAFE identifies gene families that have significantly expanded or contracted in specific lineages, potentially related to trait evolution [3].
- Positive Selection Analysis: The branch-site model in PAML's CodeML is used to detect genes with a high ratio of non-synonymous to synonymous substitutions (ω > 1), indicating positive selection [3].
- Functional Annotation: Candidate genes are annotated using GO and KEGG databases to identify enriched biological processes and pathways [3] [10].
Transcriptome Profiling for Melanin Deposition
Protocol Overview: RNA sequencing (RNA-seq) compares gene expression in tissues with high vs. low melanin content to identify key regulators.
- Sample Collection: Skin or breast muscle samples are collected from chickens with divergent pigmentation phenotypes (e.g., black meat vs. white meat) [12] [15].
- RNA Extraction and Sequencing: Total RNA is extracted, library preparation is performed, and sequencing is conducted on platforms like Illumina HiSeq [12] [14].
- Differential Expression Analysis: Reads are mapped to a reference genome, and statistical tools are used to identify differentially expressed genes (DEGs) with high stringency (e.g., fold change ≥ 2.0, FDR < 0.05) [12] [14].
- Pathway Enrichment Analysis: DEGs are analyzed for enrichment in specific biological pathways, such as melanogenesis and tyrosine metabolism, using KEGG [12] [15].
- qPCR Validation: The expression patterns of key candidate genes are validated using quantitative real-time PCR [12].
Genome-Wide Association Studies (GWAS) for Complex Traits
Protocol Overview: GWAS correlates genome-wide genetic markers with phenotypic variation to pinpoint genomic regions and candidate genes.
- Population Design: Large populations (e.g., >1,000 birds) with recorded precise phenotypes are established [16] [11].
- Genotyping: High-density SNP arrays or whole-genome sequencing are used for genotyping [16] [11].
- Quality Control (QC): Genotype data is filtered based on individual/genotype call rate, minor allele frequency (MAF), and Hardy-Weinberg equilibrium [11].
- Association Analysis: Mixed-model GWAS is performed to identify significant marker-trait associations, accounting for population structure [16] [11].
- Fine Mapping: Advanced populations like Advanced Intercross Lines (AILs) are used to increase recombination and narrow down quantitative trait loci (QTLs) to single-gene resolution [16].
Integrated Multi-Omics Analysis
Protocol Overview: Combining transcriptomics and metabolomics provides a systems-level view of the molecular networks underlying a trait.
- Concurrent Profiling: The same tissue samples are subjected to both RNA-seq and LC-MS/MS-based metabolomic profiling [15].
- Integrated Data Mining: Differential expression (genes) and abundance (metabolites) are analyzed to identify common enriched pathways [15].
- Network Construction: A joint network is built to connect significant metabolites with key genes, offering a more comprehensive regulatory picture [15].
Signaling Pathways and Molecular Networks
Core Melanogenesis Signaling Pathway
The following diagram illustrates the central pathway of melanin synthesis and its key regulatory inputs, integrating information from multiple studies on black-bone chickens [15] [13] [14].
Advanced Intercross Line (AIL) Workflow for Gene Fine-Mapping
The diagram below outlines the strategic breeding and analysis pipeline used to achieve high-resolution mapping of QTLs, as demonstrated in a 16-generation chicken study [16].
The Scientist's Toolkit: Essential Research Reagents and Materials
| Category | Item / Reagent | Specific Example / Model | Critical Function in Research |
|---|---|---|---|
| Sequencing & Genotyping | High-Throughput Sequencer | Illumina NovaSeq 6000 [11] | Whole-genome and transcriptome sequencing. |
| Custom SNP Array | Chicken 55K SNP array [11] | Cost-effective genome-wide genotyping for GWAS. | |
| Low-Coverage Sequencing | Protocol from AIL study [16] | Genotyping large populations cost-effectively. | |
| Phenotypic Measurement | Colorimeter | Minolta CR-400 [15]; NR20XE [14] | Objectively measures skin/muscle lightness (L* value). |
| Melanin ELISA Kits | Commercial ELISA Kits [12] | Quantifies eumelanin and pheomelanin content in tissues. | |
| Electronic Scale | Precision 0.1 g [11] | Accurate body weight measurement for growth traits. | |
| Bioinformatics Software | Ortholog Finder | OrthoFinder (v2.4.0) [3] | Clusters protein sequences into orthologous groups. |
| Phylogenetic Tool | IQ-TREE (v2.2.0) [3] | Constructs maximum likelihood phylogenetic trees. | |
| Gene Family Analysis | CAFE (v4.2) [3] | Models gene family expansion/contraction. | |
| Selection Analysis | PAML/CodeML (v4.9i) [3] | Detects genes under positive selection. | |
| GWAS & QC Software | PLINK (v2.0) [11] | Standard tool for genome-wide association analysis. | |
| Laboratory Consumables | RNA Extraction Kit | TRIzol Reagent [14]; Commercial Kits [12] | High-quality total RNA isolation for transcriptomics. |
| qPCR Reagents | SYBR Green kits [12] | Validates gene expression patterns from RNA-seq data. | |
| Solid-Phase Extraction Column | Anion exchange columns [15] | Purifies melanin metabolites for LC-MS/MS analysis. |
Comparative genomics has emerged as a powerful methodology for identifying functionally important regions in genomes by analyzing evolutionary conservation across species. The fundamental premise is that sequences performing critical biological functions—including both protein-coding genes and regulatory elements—demonstrate significant conservation between evolutionarily distant species, distinguishing them from non-functional surrounding sequences [17]. This approach has been successfully applied across the tree of life, from mammals to birds, providing insights into shared and specialized biological traits.
In agricultural genomics, comparative approaches are revolutionizing our understanding of economically important traits in domesticated species. For chickens (Gallus gallus), a vital global food source providing meat and eggs, comparative genomics offers powerful tools for identifying candidate genes associated with key production traits such as growth rate, meat quality, egg production, and disease resistance [18] [3]. By examining genomic similarities and differences across multiple species, researchers can identify conserved genes, expanded gene families, and genes that have undergone positive selection—all of which may be linked to biological characteristics and key traits [18].
This guide provides a comprehensive comparison of methodologies, tools, and applications in comparative genomics, with a specific focus on validating candidate genes for chicken economic traits through multi-species genomic alignment approaches.
Comparative Genomics Methodologies: A Technical Comparison
Comparative genomics employs diverse computational methods to investigate genomic similarities and differences among species. These approaches span multiple analytical domains, each contributing unique insights into genome evolution and function.
Core Analytical Frameworks in Comparative Genomics
Table 1: Comparative Genomics Methods and Their Applications
| Method Category | Specific Methods | Primary Applications | Key Software Tools |
|---|---|---|---|
| Sequence Alignment | Global alignment, Local alignment | Identifying conserved coding and noncoding sequences | VISTA, PipMaker, AVID, BLASTZ [17] |
| Gene Family Analysis | Gene family clustering, Expansion/contraction analysis | Orthologous gene identification, Evolutionary trajectory | OrthoFinder, CAFE [18] [3] |
| Evolutionary Analysis | Phylogenetic reconstruction, Divergence time estimation, Positive selection detection | Evolutionary relationships, Selective pressures | IQ-TREE, PAML/CodeML [18] [3] |
| Genome Structure Analysis | Synteny analysis, Whole-genome duplication detection | Genomic rearrangements, Structural variations | JCVI, WGD [18] [3] |
Practical Implementation Considerations
The evolutionary distance between compared species significantly impacts the analytical outcomes. As demonstrated in studies of the ApoE genomic region, human-chimpanzee comparisons revealed limited informative conservation due to recent divergence, while human-mouse comparisons successfully identified functional coding and noncoding sequences [17]. This highlights the importance of selecting appropriate species for comparison based on the specific biological questions being investigated.
Different visualization tools offer complementary advantages. PipMaker displays linear blocks of ungapped alignments, which helps distinguish coding sequences (less tolerant to insertions/deletions) from functional noncoding DNA. In contrast, VISTA generates peak-like features that readily identify candidate gene-regulatory elements and conserved coding domains [17].
Experimental Protocols for Candidate Gene Validation in Chickens
Multi-Species Genomic Alignment Workflow
Diagram 1: Comparative genomics workflow for candidate gene identification.
Genome Data Acquisition and Processing
The foundational step involves collecting high-quality genome assemblies from multiple species. A typical analysis might include chickens (Gallus gallus), ducks (Anas platyrhynchos), geese (Anser cygnoides), and evolutionarily distant reference species such as cows (Bos taurus), pigs (Sus scrofa), humans (Homo sapiens), and zebrafish (Danio rerio) [18] [3]. These data are sourced from public databases including NCBI Genome Database and Ensembl. For each species, researchers download the reference genome assembly, protein sequences, and annotation files in GFF format, prioritizing the most recent reference genome versions available.
Orthologous Gene Identification
Protein sequences corresponding to the longest transcripts of protein-coding genes are extracted for gene family clustering. Orthologous gene families are identified using OrthoFinder (v2.4.0) with sequence similarity searches performed using DIAMOND and an E-value threshold of 0.001 [18] [3]. This process groups genes into families based on evolutionary relationships, distinguishing between orthologs (genes in different species that evolved from a common ancestral gene) and paralogs (genes related by duplication within a genome).
Phylogenetic Analysis and Divergence Time Estimation
The protein sequences of single-copy orthologous genes identified using OrthoFinder are used for phylogenetic tree construction. Multiple sequence alignments are performed using MAFFT (v7.205) with parameters --localpair and --maxiterate 1000 [18] [3]. Poorly aligned or highly divergent regions are removed using Gblocks (v0.91b) with parameter -b5 = h. The filtered alignments are concatenated into a supergene sequence for each species, and a maximum likelihood phylogenetic tree is constructed using IQ-TREE (v2.2.0) with 1000 bootstrap replicates to assess node support.
Gene Family Evolution and Positive Selection Analysis
Based on identified gene families and the species phylogenetic tree, gene family expansion and contraction analyses are performed using CAFE software (v4.2) [18] [3]. Families with conditional p-values less than 0.05 are considered to have undergone significant expansion or contraction. For positive selection analysis, single-copy orthologous gene families are analyzed using the CodeML module of PAML (v4.9i). The branch-site model compares Model A (allowing positive selection on specific sites in the foreground branch, ω > 1) against a null model (no sites with ω > 1). A likelihood ratio test determines statistical significance (p < 0.05), with sites showing posterior probability > 0.95 considered under significant positive selection.
Advanced Intercross Line Design for High-Resolution Mapping
Diagram 2: Advanced intercross line design for trait mapping.
Advanced intercross lines (AILs) represent a powerful approach for enhancing mapping resolution of complex traits. In chicken research, a 16-generation AIL was developed through reciprocal crosses between Huiyang Bearded chicken and High-Quality Chicken Line A, which exhibit significant phenotypic differences in growth traits [16]. Subsequent generations (F3 to F16) were derived through random mating with maintained population diversity. This design rapidly accumulates recombination events, breaking down linkage disequilibrium and enabling quantitative trait loci (QTL) mapping at the single-gene level.
The AIL approach demonstrates remarkable effectiveness, with linkage disequilibrium decaying rapidly across generations (r²₀.₁ = 143 kb in F16 compared to 259 kb in F2) [16]. This enhanced resolution allows QTL intervals to be refined to an average length of 244 ± 343 kb, with 84.2% of QTLs shorter than 500 kb—significantly improving the ability to identify candidate genes.
Validated Candidate Genes for Chicken Economic Traits
Comparative genomic analyses across multiple species have identified numerous candidate genes associated with economically important traits in chickens. These findings are further validated through genome-wide association studies (GWAS) and advanced intercross line approaches.
Comprehensive Candidate Gene Catalog
Table 2: Validated Candidate Genes for Chicken Economic Traits
| Trait Category | Candidate Genes | Biological Function | Validation Evidence |
|---|---|---|---|
| Growth Traits | TBX22, LCORL, GH | Transcription regulation, Growth hormone signaling | Comparative genomics, Positive selection [18] [3] |
| Meat Quality | A-FABP, H-FABP, PRKAB2 | Fatty acid binding, Energy metabolism | Gene family expansion, Functional annotation [18] [3] |
| Reproductive Performance | IGF-1, SLC25A29, WDR25, YY1 | Follicular development, Oocyte maturation | GWAS, Comparative genomics [18] [3] [19] |
| Egg Production | SCUBE1, KRAS, NELL2, KITLG | Hormone signaling, Follicle development | GWAS, Selective sweep analysis [5] [19] |
| Disease Resistance | C1QBP, VAV2, IL12B | Immune response, Inflammation regulation | Positive selection, Functional annotation [18] [3] |
| Egg Weight | ATF6, CSPG4, BSG, CFD | Cellular stress response, Hormone regulation | Multi-omics integration, ChickenGTEx [20] |
Key Signaling Pathways for Economic Traits
Functional enrichment analyses reveal that candidate genes for chicken economic traits are significantly involved in specific biological pathways. For growth traits, genes are predominantly enriched in transcription and signal transduction mechanisms [18] [3]. Meat quality genes participate in fatty acid metabolism and energy sensing pathways. Reproductive trait genes, particularly those associated with egg production, are frequently involved in hormonal signaling, follicular development, and oocyte maturation pathways [5] [19].
Notably, mTOR and insulin signaling pathways have been identified as crucial regulators of clutch size and egg number through genes such as IGF1 and PTK2 [5]. Similarly, gonadotropin-releasing hormone (GnRH) signaling, mediated through genes like MAP2K2 and FSHB, influences egg weight by regulating gonadotropin expression [20].
The effectiveness of comparative genomics depends heavily on the selection of appropriate tools and resources. Current genomic analysis platforms offer complementary strengths for different research applications.
Genomic Visualization and Analysis Platforms
Table 3: Comparative Genomics Tools and Their Applications
| Tool/Platform | Primary Function | Key Features | Best Use Cases |
|---|---|---|---|
| VISTA Browser | Genome alignment visualization | Global alignment strategy, Peak-based conservation display | Identifying conserved coding and noncoding regions [17] [21] |
| PipMaker | Local alignment visualization | Block-based alignment display, Distinguishes coding/noncoding | Analyzing regions with insertions/deletions [17] |
| UCSC Genome Browser | Whole-genome annotation | Multiple track display, L-score conservation metric | Integrating multiple data types for genomic intervals [17] |
| MOSGA 2 | Genome quality control | Quality validation, Phylogenetic analysis | Quality assessment of genome assemblies [22] |
| Zoonomia Project | Mammalian genomic alignment | 240 species alignment, Evolutionary constraint analysis | Cross-species constraint identification [23] |
- NCBI Genome Database: Primary source for reference genome assemblies, protein sequences, and annotation files in GFF format [18] [3]
- Ensembl: Comprehensive genome annotation with comparative genomics capabilities and ortholog prediction [18] [3]
- Animal QTLdb: Repository of documented quantitative trait loci for agricultural species, enabling comparison with newly identified regions [19]
- VISTA Enhancer DB: Database of experimentally validated human noncoding fragments with gene enhancer activity, useful for regulatory element analysis [21]
Analytical Software and Pipelines
- OrthoFinder: Phylogenetic orthology inference for comparative genomics, using protein sequences to identify orthologous gene families [18] [3]
- CAFE: Computational analysis of gene family evolution, detecting expansions and contractions across phylogenetic trees [18] [3]
- PAML/CodeML: Phylogenetic analysis by maximum likelihood, particularly for detecting positive selection using codon substitution models [18] [3]
- IQ-TREE: Efficient software for maximum likelihood phylogenetic tree construction, with model selection and branch support assessment [18] [3]
Comparative genomics, particularly through multi-species genomic alignment, provides powerful approaches for identifying and validating candidate genes associated with economically important traits in chickens. The integration of evolutionary analyses—including gene family evolution, positive selection detection, and conserved noncoding element identification—with population genetics approaches such as advanced intercross lines and genome-wide association studies creates a robust framework for candidate gene prioritization.
These methods have successfully identified genes influencing growth (TBX22, LCORL), meat quality (A-FABP, H-FABP), reproduction (IGF-1, WDR25), and disease resistance (C1QBP, VAV2) in chickens [18] [3]. The continuing development of genomic resources, including expanded genome assemblies, functional annotations, and multi-omics datasets, will further enhance the resolution and accuracy of these approaches.
For researchers investigating complex traits in agricultural species, a combined strategy leveraging both cross-species comparative analyses and within-species high-resolution mapping offers the most promising path forward. This integrated approach facilitates the identification of causal genes and variants, ultimately accelerating genetic improvement programs for chicken and other agricultural species.
The advent of genome-wide association studies (GWAS) has revolutionized genetic research by enabling the systematic identification of genetic variants underlying complex traits. In poultry genetics, these approaches have become indispensable for elucidating the genetic architecture of economically important traits such as body weight, feed efficiency, and egg production. However, single-population GWAS often suffer from limited sample sizes, resulting in reduced statistical power to detect variants with small to moderate effects. This limitation has spurred the adoption of meta-analysis techniques, which combine results from multiple studies to enhance detection power and improve the reliability of identified associations. The integration of these methods has accelerated genetic progress in chicken breeding by providing robust molecular markers for selection programs while offering insights into biological mechanisms governing polygenic traits.
GWAS and Meta-Analysis: Methodological Foundations and Comparative Power
Fundamental Principles of GWAS
Genome-wide association studies operate on the fundamental principle of testing associations between genetic markers (typically single nucleotide polymorphisms, or SNPs) and phenotypes across the entire genome. In chicken populations, this approach has successfully identified numerous quantitative trait loci (QTLs) for production traits. The basic genetic model for GWAS can be represented as:
y = Xb + Za + e
Where y is the vector of phenotypic values, X is the design matrix for fixed effects (e.g., sex, batch), b is the vector of fixed effect coefficients, Z is the genotype matrix, a is the vector of SNP effects, and e is the vector of residual errors [8]. For accurate implementation, researchers must account for population stratification through principal component analysis (PCA) and consider relatedness among individuals using a genomic relationship matrix (G) [8] [11].
Meta-Analysis Approaches and Their Advantages
Meta-analysis quantitatively combines summary statistics from multiple independent GWAS, effectively increasing sample size and statistical power. The fixed-effect inverse variance weighting method is commonly implemented in tools like METAL [8]. This approach provides several key advantages over single-population studies, including enhanced power to detect novel variants, minimized false positives, and ability to investigate heterogeneity of effects across populations [24]. For example, a meta-analysis of three genetically distinct chicken populations identified 77 novel independent variants associated with body weight traits that were not detected in individual population analyses [8].
Empirical Comparisons of Methodological Approaches
Table 1: Comparison of GWAS Methodological Approaches for Complex Trait Analysis
| Method | Statistical Power | Population Structure Control | Data Requirements | Key Advantages | Key Limitations |
|---|---|---|---|---|---|
| Single-Population GWAS | Limited by cohort size | Principal components analysis | Individual-level genotype and phenotype data | Simple implementation; optimal for homogeneous populations | Low power for small-effect variants; limited generalizability |
| GWAS Meta-Analysis | Enhanced through sample size expansion | Study-level correction combined across studies | Summary statistics from multiple studies | Increased discovery power; practical for consortia | Challenging for admixed individuals; potential heterogeneity |
| Mega-Analysis (Pooled) | Highest when allele frequencies vary across populations | Global principal components across all data | Individual-level data from all studies | Maximizes sample size; accommodates admixed individuals | Complex data harmonization; privacy and consent limitations |
| Gene-Based Meta-Analysis | Improved for rare variants and genes with multiple signals | Can incorporate ancestry-specific LD patterns | Summary statistics and linkage disequilibrium matrices | Aggregates signals across multiple variants in a gene; reduces multiple testing burden | Computationally intensive; requires accurate LD estimation |
Empirical comparisons demonstrate that pooled mega-analysis (jointly analyzing raw data from multiple studies) generally provides superior statistical power compared to meta-analysis, particularly when allele frequencies vary across ancestral groups [25]. However, meta-analysis remains a valuable approach when data sharing restrictions prevent individual-level data pooling, offering comparable results for main effect detection while effectively controlling for population structure [26]. For gene-environment interactions, both methods produce largely consistent results, making meta-analysis a practical choice for consortia with data sharing limitations [26].
Experimental Protocols in Avian Genomics
Standard GWAS Protocol in Chicken Populations
A comprehensive GWAS protocol for chicken economic traits involves multiple standardized steps. First, phenotypic measurements are collected for target traits (e.g., body weights at 56, 70, and 84 days; feed intake records; or egg production parameters) [8] [11]. For body weight traits, measurements are typically recorded electronically with precision to 0.1 g, with careful standardization of fasting periods before weighing [11]. Blood samples are then collected for DNA extraction, usually from wing veins using EDTA-K2 as an anticoagulant, followed by genomic DNA extraction via phenol-chloroform or commercial kit methods [11].
Genotyping is performed using medium- to high-density SNP arrays, such as the 600K Affymetrix Axiom HD array or Illumina 60K SNP BeadChip [8]. Quality control procedures eliminate markers with high missing rates (>1%), low minor allele frequency (MAF <1%), and deviations from Hardy-Weinberg equilibrium (p < 0.0001) [8] [11]. For whole-genome sequencing studies, similar QC thresholds are applied, requiring individual genotype detection rates ≥90% and MAF ≥5% [11]. Genotype imputation to a reference panel (e.g., ChickenGTEx) enhances genomic coverage, with accuracy filtering based on DR2 scores >0.4 [8].
Population stratification is addressed through principal component analysis, with the optimal number of PCs (determined by genomic inflation factors) included as covariates in association models [8] [19]. Association testing typically employs mixed linear models implemented in software such as GCTA-fastGWA or GEMMA, which account for relatedness and population structure [8] [19]. Significance thresholds are established based on the number of independent SNPs, with genome-wide significance typically set at p < 5×10^(-8) and suggestive significance at p < 1×10^(-5) [8] [19].
Meta-Analysis Implementation Framework
Implementing a robust meta-analysis requires coordinated efforts across participating studies. The process begins with developing a detailed protocol specifying dataset eligibility criteria, phenotype and genotype standardization methods, quality control procedures, and analytical plans [24]. Each participating study conducts GWAS using harmonized models, adjusting for study-specific covariates and population structure.
Summary statistics (effect sizes, standard errors, p-values, and allele frequencies) are shared for all variants passing quality control. For imputed variants, imputation accuracy scores should be included. The meta-analysis then combines these statistics using inverse variance-weighted fixed-effects models in software such as METAL [8]. Heterogeneity across studies should be quantified using I² statistics or Cochran's Q tests to identify potentially problematic associations with inconsistent effects [24].
Advanced Population Designs for Fine-Mapping
Advanced intercross lines (AILs) represent a powerful approach for enhancing mapping resolution in chicken genomics. These populations are created through multiple generations of random mating, which increases recombination events and breaks down linkage disequilibrium [16]. For example, a 16-generation chicken AIL demonstrated rapid LD decay (r²₀.₁ = 143 kb in F16 versus 259 kb in F2), enabling the identification of quantitative trait loci (QTLs) at single-gene resolution [16]. The maintenance of such populations requires careful management of effective population size to minimize genetic drift and inbreeding, typically requiring hundreds of mating pairs per generation [16].
Key Findings and Genetic Architecture of Chicken Economic Traits
Body Weight and Growth Traits
GWAS and meta-analysis have substantially advanced our understanding of the genetic basis for body weight in chickens. A multi-population meta-analysis focusing on body weight at 56, 70, and 84 days identified 77 novel independent variants and 59 candidate genes, with specific SNPs (1170526144G>T and 1170642110A>G) showing enrichment in enhancer and promoter elements of KPNA3 and CAB39L in muscle, adipose, and intestinal tissues [8]. Genomic studies across 25 diverse chicken breeds have highlighted IGF1 and SMC1B as potent drivers of body size variation, with SOX5 emerging as another key regulator [27].
Table 2: Key Genetic Loci for Chicken Economic Traits Identified Through GWAS and Meta-Analysis
| Trait Category | Key Candidate Genes | Chromosomal Regions | Biological Functions | Study Approach |
|---|---|---|---|---|
| Body Weight & Growth | KPNA3, CAB39L, IGF1, SOX5, SMC1B | GGA1, GGA5, GGA27 | Muscle development, adipose regulation, insulin signaling | Multi-population meta-analysis [8]; Genomic diversity analysis [27] |
| Feed Efficiency | PLCE1, LAP3, MED28, QDPR, LDB2, SEL1L3 | Multiple regions | Feed intake regulation, metabolic efficiency | Single-breed GWAS [11] |
| Egg Production | SCUBE1, KRAS, IGF1, PTK2, NELL2, KITLG | GGA5 (48.61-48.84 Mb), GGA13 | Follicular development, hormone signaling, oocyte maturation | Mixed-breed GWAS [5] [19] |
| Sperm Storage Capacity | NEDD4, SMC1B | Not specified | Fertilization efficiency, reproductive performance | Genomic diversity analysis [27] |
Heritability estimates for growth traits vary considerably across populations and measurement timepoints. For Wenchang chickens, the heritability of body weight traits ranges from 0.30 to 0.44, while feed efficiency traits show lower heritability (e.g., residual feed intake at 0.05) [11]. In advanced intercross lines, growth and development traits demonstrate moderate heritability (0.31 ± 0.16), similar to tissue and carcass phenotypes (0.30 ± 0.13) [16].
Feed Efficiency and Metabolism
Feed efficiency represents a crucial economic trait in poultry production, with feed costs accounting for over 70% of total production expenses [11]. GWAS in Wenchang chickens have identified several candidate genes, including PLCE1, LAP3, MED28, QDPR, LDB2, and SEL1L3, which influence residual feed intake and average daily food intake [11]. The genetic architecture of feed efficiency appears highly polygenic, with genomic heritability estimates substantially lower than for growth traits (0.05 for RFI versus 0.21-0.44 for growth traits) [11].
Egg Production and Reproductive Traits
Egg production traits exhibit complex genetic architecture influenced by numerous small-effect variants. GWAS in Wuhua yellow chickens identified 871 significant SNPs (51 genome-wide, 820 suggestive) and 379 candidate genes for egg-laying performance [5]. Key regulators include SCUBE1 and KRAS for age at first egg through follicular development and metabolic pathways, while IGF1 and PTK2 associate with clutch size and egg number primarily through mTOR and insulin signaling pathways [5]. A separate study focusing on egg number differences between commercial and indigenous chickens identified the 48.61-48.84 Mb region on GGA5 as the most significant genomic region, containing candidate genes YY1 and WDR25 which function in oocyte growth and reproductive tissue development [19].
Table 3: Essential Research Reagents and Resources for Chicken Genomic Studies
| Resource Category | Specific Tools/Reagents | Application in Research | Key Features |
|---|---|---|---|
| Genotyping Arrays | 600K Affymetrix Axiom HD Array; Illumina 60K SNP BeadChip; Custom 55K SNP arrays | Genome-wide variant screening; Genotype data generation | High-density coverage; Standardized platforms; Cost-effective |
| Reference Genomes | GRCg6a (Gallus gallus reference genome) | Variant mapping; Coordinate standardization | Improved annotation; LiftOver compatibility |
| Genotype Imputation | ChickenGTEx panel; Beagle 5.1/5.2 software | Enhancing genomic coverage from array data | Improved variant discovery; Cross-platform harmonization |
| GWAS Software | GCTA-fastGWA; REGENIE; GEMMA; PLINK | Association analysis; Population structure control | Efficient mixed models; Relatedness adjustment; Large dataset handling |
| Meta-Analysis Tools | METAL; REMETA; RAREMETAL | Combining summary statistics; Gene-based tests | Inverse variance weighting; Efficient LD handling; Multi-trait support |
| Functional Annotation | Chicken FAANG; Chicken GTEx; Animal QTLdb | Biological interpretation; Regulatory element annotation | Tissue-specific regulation; Comparative genomics; QTL integration |
| Specialized Populations | Advanced Intercross Lines (AILs); F2 crosses; Commercial and indigenous breeds | Fine-mapping; Genetic architecture studies | Enhanced recombination; Reduced LD; Phenotypic diversity |
Cross-Species Validation and Conservation of Genetic Mechanisms
Comparative genomic analyses reveal remarkable conservation of growth and reproductive pathways across avian and mammalian species. Studies of chicken growth genes have identified orthologous relationships with human developmental genes, highlighting fundamental biological pathways shared across vertebrate lineages [16]. For instance, IGF1 represents a conserved regulator of body size in both chickens and humans, while SOX5 influences developmental processes across diverse species [27]. However, regulatory mechanisms demonstrate both conserved and divergent features between mammals and birds, with species-specific elements contributing to unique phenotypic adaptations [16].
The chicken model provides particular value for understanding the functional genomics of economic traits, with advanced resources including the global chicken reference panel (GCRP), functional annotation datasets from the FAANG initiative, and regulatory maps from chicken GTEx projects [16]. These resources enable precise mapping of regulatory elements and their conservation across species, facilitating the identification of core biological pathways underlying growth, metabolism, and reproduction.
The integration of GWAS with meta-analysis has fundamentally transformed our understanding of complex polygenic traits in chickens, moving from single-gene discovery to comprehensive network-based understanding of biological systems. These approaches have successfully identified hundreds of genomic regions associated with economically important traits while revealing the complex regulatory architecture underlying phenotypic variation. Future research will increasingly focus on integrating multi-omics data, refining functional validation through genome editing, and developing improved statistical methods for cross-species translation of findings. As genomic resources continue to expand and analytical methods evolve, the power to unravel the genetic complexity of polygenic traits will further accelerate genetic improvement in poultry and enhance our fundamental understanding of biological systems across species.
In the pursuit of sustainable global food security, research into the genetic architecture of economically valuable traits in farmed animals has become paramount. For chickens, a vital source of protein and a key model organism, validating candidate genes requires leveraging large-scale public data resources. Three projects form the cornerstone of this research landscape: the ChickenGTEx Atlas, the Animal QTL Database (QTLdb), and the Functional Annotation of Animal Genomes (FAANG) project. Each provides distinct yet complementary data types and tools. This guide offers an objective comparison of these resources, framed within the context of validating candidate genes for complex economic traits, to aid researchers in selecting the most appropriate resources for their investigative workflows.
The table below summarizes the core attributes, strengths, and primary applications of the three resources to facilitate a direct comparison.
Table 1: Core Features of Chicken Genomic Resources
| Feature | ChickenGTEx Atlas | Animal QTL Database (QTLdb) | FAANG Project |
|---|---|---|---|
| Primary Focus | Mapping genetic variants that regulate molecular phenotypes (eQTLs, etc.) [28] | Cataloging published QTLs, associations, and candidate genes for complex traits [29] | Defining functional genomic elements (e.g., open chromatin, histone marks) in farmed animals [30] |
| Key Data Types | - Whole-genome sequencing (2,869 samples)- Bulk RNA-seq (7,015 samples, 28 tissues)- Single-cell RNA-seq (10 tissues)- Cis-molQTLs (~1.5 million)- Epigenomic profiles (257 datasets) [28] | - Curated QTLs from publications- GWAS associations- Candidate gene associations- Copy Number Variations (CNVs)- Breed information [29] | - Histone modification ChIP-seq- Chromatin accessibility (ATAC-seq)- DNA methylation- Gene expression (RNA-seq)- CAGE tags [30] |
| Number of Chicken QTLs/Associations | Millions of molecular QTLs (e.g., 2.97M cis-eQTLs) [28] | 29,328 QTL/association entries from 420 publications [29] | Not a QTL repository; provides foundational annotation for interpretation |
| Trait & Tissue Context | Focus on molecular phenotypes across 52 tissues; context-dependent QTLs (sex, tissue, cell-type) [28] | Diverse complex traits (e.g., growth, meat quality, egg production, disease) [29] | Foundational annotation across key tissues, cell types, and developmental stages [30] |
| Major Strength | Unravels the regulatory mechanism linking non-coding variants to transcriptomic diversity and phenotypes [28] | Comprehensive repository of genotype-to-phenotype associations; directly links genomic regions to measured complex traits [29] | Provides the foundational "rules" of the genome for interpreting the functional potential of genetic variants [30] |
| Consideration | Pilot phase; some tissues and biological contexts are under-represented [28] | Funding is uncertain; the database is no longer actively updated [29] | Data generation is often from a few individuals, limiting population-level inference [30] |
Experimental Protocols for Candidate Gene Validation
Candidate gene validation is a multi-step process. The following experimental frameworks, which synthesize typical methodologies from the literature, demonstrate how these resources can be integrated into a cohesive workflow.
Protocol 1: From GWAS Hit to Causal Gene and Variant
This protocol is ideal for fine-mapping a genomic region associated with a growth or production trait to identify the causal gene and its regulatory mechanism.
Table 2: Key Reagents for Genomic Validation Experiments
| Research Reagent / Resource | Function in Validation Workflow |
|---|---|
| Advanced Intercross Line (AIL) Population | A chicken population with enhanced recombination for fine-mapping QTLs to very narrow genomic intervals [31]. |
| High-Quality Whole-Genome Sequencing (WGS) Data | Provides a comprehensive set of genetic variants for association testing and imputation [28]. |
| Cis-molQTL Data (from ChickenGTEx) | Identifies which genetic variants are associated with changes in gene expression in specific tissues [28]. |
| Epigenomic Mark Data (from FAANG) | Annotates regulatory elements (e.g., promoters, enhancers) to prioritize variants in functional regions [30]. |
| Colocalization Analysis | A statistical method to determine if GWAS and QTL signals in a genomic region share a common causal variant [31]. |
Workflow Description: The process begins with a GWAS conducted on a population, such as an Advanced Intercross Line (AIL), to identify loci associated with a complex economic trait [31]. The resulting QTL interval is then cross-referenced with public QTLdb data to check for previously reported associations and evidence of pleiotropy [29]. Subsequent colocalization analysis is performed using ChickenGTEx cis-molQTL data (e.g., eQTLs, sQTLs) to test if the trait-associated variant also regulates a molecular phenotype, thereby nominating a candidate gene [31]. To establish a causal regulatory mechanism, the variant is examined within FAANG chromatin state annotations (e.g., H3K27ac for active enhancers, ATAC-seq for open chromatin) from relevant tissues [30]. Finally, the variant-to-gene-to-trait hypothesis can be functionally tested in vitro using systems like organoids [30].
Diagram 1: From GWAS Hit to Causal Gene
Protocol 2: Functional Annotation of a Prioritized Gene
This protocol is used when a candidate gene is already known, and the goal is to understand its regulatory landscape and potential role in complex traits.
Workflow Description: This pathway starts with a single prioritized candidate gene. Its expression profile is first characterized across a wide range of tissues using ChickenGTEx bulk and single-cell RNA-seq data, which helps identify the most relevant tissues and cell types for its function [28]. Next, its regulation is investigated by extracting all cis-molQTLs associated with the gene from ChickenGTEx, revealing genetic variants that modulate its expression or splicing [28]. The genomic region is then annotated using FAANG data to map its promoters, potential enhancers, and other regulatory features [30]. Finally, the gene's link to complex traits is established by checking for its presence in QTLdb records or by performing a Transcriptome-Wide Association Study (TWAS) using ChickenGTEx data, which connects gene expression to trait associations [28].
Diagram 2: Functional Annotation of a Gene
Supporting Experimental Data and Applications
The utility of these resources is best demonstrated through real-world research applications and performance benchmarks.
Case Study: Fine-Mapping Growth Traits in an Advanced Intercross Line
A 2025 study utilized a 16-generation chicken AIL to dissect the genetic architecture of growth traits [31]. This research exemplifies the power of combining specialized populations with public resources.
- Experimental Workflow: The researchers performed whole-genome sequencing on 4,671 samples across generations. They conducted GWAS for 75 complex traits, identifying 682 QTLs. Due to the high recombination in the AIL, the average QTL interval was fine-mapped to 244 ± 343 kb, a significant improvement in resolution [31].
- Data Integration for Validation: They used multiple colocalization methods to link these fine-mapped trait QTLs with regulatory variants, establishing a network of tissue-specific regulatory mutations. This systematic approach allowed them to move beyond simple association to propose functional mechanisms [31].
- Key Outcome: The study highlighted that 84.2% of the identified QTLs were less than 500 kb in length, and 20.38% of them were novel discoveries not present in the Animal QTLdb at the time, underscoring the value of such fine-mapping designs for expanding knowledge of trait genetics [31].
Performance of Statistical Methods for Complex Trait Analysis
The choice of statistical model significantly impacts the power and accuracy of GWAS, especially for complex longitudinal traits (e.g., growth over time). The table below compares different methods based on a simulation study.
Table 3: Performance Comparison of GWAS Models for Longitudinal Traits [32]
| GWAS Model | Description | False Positive Rate Control | Statistical Power | Estimation Accuracy of QTN effect |
|---|---|---|---|---|
| fGWAS-C / fGWAS-F | Functional GWAS models fitting time-varied SNP effects [32] | Excellent (close to threshold) | Highest among all models | Most accurate, unbiased |
| GWAS-EBV-P / GWAS-DRP-P | Uses Estimated Breeding Value/Deregressed Proof as response, with polygenic effect [32] | Excellent (close to threshold) | Moderate | Underestimated |
| GWAS-Residual | Uses estimated residuals as response variable [32] | Conservative (lower than threshold) | Relatively High | Underestimated |
| GWAS-EBV-NP / GWAS-DRP-NP | Uses EBV/DRP as response, without polygenic effect [32] | Poor (clearly inflated) | High (but unreliable due to high FPR) | Underestimated |
Experimental Context: This simulation study evaluated methods for analyzing traits measured at multiple time points. The superior performance of the fGWAS models demonstrates the importance of using specialized statistical methods that can directly model the time-dependent nature of the phenotype, rather than relying on pre-processed summary values like EBVs [32].
The ChickenGTEx Atlas, Animal QTLdb, and FAANG project are powerful, complementary resources for the validation of candidate genes. FAANG provides the essential foundational annotation of the genome's regulatory grammar. The ChickenGTEx Atlas dynamically connects genetic variation to molecular phenotypes, revealing the cis-regulatory logic of the genome. The Animal QTLdb serves as a comprehensive repository of established genotype-to-complex-phenotype associations.
For researchers, the optimal strategy involves a synergistic use of all three. One can start with a QTL from the QTLdb, use FAANG data to annotate the region for functional elements, and then leverage ChickenGTEx to identify which of those elements have activity that is both variable and linked to the trait of interest through molQTLs. As the field moves towards higher resolution—embracing single-cell data, pangenomes, and in vitro functional models—these integrated resources will remain indispensable for accelerating precision breeding and understanding the fundamental biology of economically important traits in chickens.
Advanced Techniques for Gene Characterization and Functional Validation
Genome-wide association studies (GWAS) have successfully identified thousands of genetic variants associated with complex traits and diseases. In chicken genomics, GWAS has revealed numerous quantitative trait loci (QTLs) influencing economically important traits such as egg production, body size, and disease resistance [27] [19]. However, despite these successes, significant challenges remain in moving from statistical associations to biological mechanisms. The majority of trait-associated variants fall in non-coding regions of the genome, making their functional interpretation difficult [33] [34]. Often, researchers assign function to the nearest gene, a method that frequently implicates incorrect genes and leads to weak assumptions about relevant molecular pathways [33].
The transition from single-layer genomic analyses to integrated multi-omics approaches represents a paradigm shift in biological research. By combining genomics with transcriptomics, proteomics, and metabolomics, researchers can now bridge the gap between genetic association and biological function [35] [34]. This integration is particularly valuable in agricultural genomics, where understanding the molecular basis of economic traits in chickens can accelerate breeding programs and improve animal health and productivity [27] [16]. The complex polygenic nature of most economic traits in chickens requires a systems biology approach that can capture the dynamic interactions between different molecular layers [16].
Methodological Framework: Multi-Omics Integration Strategies
Correlation-Based Integration Methods
Correlation-based strategies apply statistical correlations between different types of omics data to uncover and quantify relationships between various molecular components. These methods create data structures, such as networks, to visually and analytically represent these relationships [35].
Gene Co-Expression Analysis with Metabolomics Data: This approach identifies co-expressed gene modules from transcriptomics data and links them to metabolites from metabolomics data. The correlation between metabolite intensity patterns and the eigengenes of each co-expression module can reveal which metabolites are strongly associated with specific gene modules, providing insights into the regulation of metabolic pathways [35].
Gene-Metabolite Network Analysis: This method visualizes interactions between genes and metabolites in a biological system. Researchers collect gene expression and metabolite abundance data from the same biological samples and integrate them using correlation analyses to identify co-regulated genes and metabolites. These networks help identify key regulatory nodes and pathways involved in metabolic processes [35].
Similarity Network Fusion: This technique builds a similarity network for each omics data type separately, then merges all networks, highlighting edges with high associations in each omics network [35].
Machine Learning Integration Approaches
Machine learning strategies utilize one or more types of omics data to comprehensively understand biological responses at classification and regression levels. These methods enable identification of complex patterns and interactions that might be missed by single-omics analyses [35].
Multi-Omics Factor Analysis (MOFA): A machine learning framework that captures latent factors driving variation across multiple omics layers, identifying shared and specific patterns of variation [36].
Sparse Partial Least-Squares Discriminant Analysis (sPLS-DA): This method has been successfully used to integrate proteomic and metabolomic data, enabling segregation of subjects with specific conditions from healthy controls when principal component analysis fails to separate groups [37].
Combined Omics Integration Approaches
These approaches attempt to explain what occurs within each type of omics data in an integrated manner, generating independent data sets that can be jointly interpreted [35].
Pathway Integration: Combining proteomic signals with metabolomic readouts makes pathway analysis more accurate and reduces false positives in enrichment studies. A pathway supported by both protein abundance and metabolite concentration changes is more likely to be biologically relevant [36].
Constraint-Based Models: These models integrate transcriptomic, proteomic, and metabolomic data with genome-scale metabolic models to predict metabolic fluxes and identify key regulatory nodes [35].
Table 1: Comparison of Multi-Omics Integration Strategies
| Integration Approach | Key Methods | Strengths | Limitations |
|---|---|---|---|
| Correlation-Based | Gene co-expression analysis, Gene-metabolite networks, Similarity Network Fusion | Identifies co-regulation patterns, Visualizes complex relationships | May detect correlations without causal relationships, Sensitive to data normalization |
| Machine Learning | MOFA, sPLS-DA, MixOmics | Identifies complex non-linear patterns, Handles high-dimensional data | Requires substantial computational resources, Risk of overfitting without proper validation |
| Pathway-Centric | Pathway enrichment, Constraint-based models | Provides biological context, Leverages prior knowledge | Dependent on completeness of pathway databases, May miss novel mechanisms |
Experimental Designs and Workflows for Multi-Omics Studies
Sample Preparation and Experimental Design
Proper sample preparation is critical for successful multi-omics integration. For studies integrating proteomics and metabolomics, joint extraction protocols that enable simultaneous recovery of proteins and metabolites from the same biological material are preferred [36]. This approach minimizes technical variation and ensures that different molecular layers are captured from the same biological context. Samples should be processed rapidly on ice to minimize degradation, and internal standards should be included to allow accurate quantification across runs [36].
The experimental design must account for the specific requirements of each omics technology. For transcriptomics, RNA integrity is paramount, while proteomics requires preservation of protein modifications and prevention of degradation. Metabolomics demands immediate quenching of metabolic activity to capture accurate snapshots of metabolite levels [38] [36]. For chicken studies, careful consideration of tissue selection, developmental stage, and environmental conditions is essential, as these factors significantly influence molecular profiles [27] [16].
Data Acquisition Technologies
Transcriptomics: RNA sequencing (RNA-Seq) provides comprehensive profiling of transcript abundance. Bulk RNA-Seq measures average expression across cell populations, while single-cell RNA-Seq (scRNA-seq) resolves cellular heterogeneity [35] [34].
Proteomics: Liquid chromatography coupled with tandem mass spectrometry (LC-MS/MS) enables identification and quantification of thousands of proteins. Data-independent acquisition (DIA) strategies offer high reproducibility and broad proteome coverage, while tandem mass tags (TMT) enable multiplexed quantification across multiple samples [36] [34].
Metabolomics: Both gas chromatography-mass spectrometry (GC-MS) and liquid chromatography-mass spectrometry (LC-MS) are widely used. GC-MS provides excellent resolution for volatile compounds, while LC-MS offers broader metabolite coverage, including lipids and polar metabolites [38] [36].
Data Processing and Integration Workflows
Data processing typically involves multiple steps: (1) quality control of raw data; (2) preprocessing including normalization, transformation, and missing value imputation; (3) batch effect correction to minimize technical variation; and (4) statistical integration [35] [36]. Normalization techniques such as log-transformation, quantile normalization, or variance stabilization help harmonize datasets with different scales and dynamic ranges [36].
Figure 1: Multi-Omics Integration Workflow. This diagram illustrates the sequential steps in a typical multi-omics study, from sample collection through data acquisition, preprocessing, integration, and biological interpretation.
Case Studies in Chicken Genomics
Advanced Intercross Line for Growth Traits
A sophisticated example of multi-omics integration in chicken genomics comes from a 16-generation advanced intercross line (AIL) study designed to enhance informative recombination and identify single-gene quantitative trait loci [16]. This resource population, established through reciprocal crosses between Huiyang Bearded chickens and High-Quality Chicken Line A, accumulated recombination events over generations, dramatically improving mapping resolution.
Researchers collected 4,671 samples across different generations for genome sequencing and phenotyping of 75 traits, including growth and development, tissue and carcass characteristics, feed intake and efficiency, blood biochemistry, and feather characteristics [16]. By integrating GWAS with molecular QTL mapping and epigenetic feature annotation, they established a network landscape of tissue-specific regulatory mutations and functional gene relationships. This systems genetics approach revealed that complex traits in chickens are driven by the accumulation of minor effects on tissue-specific genes and regulatory pathways, consistent with the omnigenic model [16].
Egg Number Traits Across Diverse Populations
A genome-wide association study investigating egg number traits utilized genomic information from various chicken breeds differing in average annual egg production [19]. The study compared commercial egg-type chickens with high production (approximately 300 eggs annually) against Chinese indigenous chickens with lower production (less than 200 eggs annually).
The research identified 148 SNPs associated with egg number traits and 32 candidate genes based on gene function [19]. These genes were primarily involved in regulating hormones, follicle formation and development, and reproductive system development. Key candidates included:
- NELL2: Involved in neural development and fertility
- KITLG: Essential for germ cell development
- GHRHR: Regulates growth hormone release
- CAMK4: Plays roles in calcium signaling and fertility
The most significant genomic region was located at 48.61-48.84 Mb on GGA5, containing four genes, including YY1 (involved in oocyte maturation) and WDR25 (associated with reproductive tissues) [19]. This region represents a promising candidate for further functional validation.
Body Size and Sperm Storage Capacity
Whole-genome resequencing of 477 chickens from 25 worldwide breeds identified genomic variants underlying phenotypic diversity in body size and sperm storage capacity [27]. The study revealed that high-intensity artificial selection accelerates population differentiation and that human-driven traits are controlled by both polygenes and major genes.
Primary candidate genes identified included:
- SOX5 and IGF1 for body size traits
- NEDD4 for sperm storage capacity in layer chickens
This comprehensive analysis demonstrated how changes in genomic characteristics shape phenotypic diversity through both coding and regulatory variants [27].
Table 2: Key Candidate Genes for Chicken Economic Traits Identified Through Multi-Omics Approaches
| Trait Category | Candidate Genes | Biological Function | Identification Approach |
|---|---|---|---|
| Egg Production | NELL2, KITLG, GHRHR, CAMK4, YY1, WDR25 | Hormone regulation, follicle development, oocyte maturation | GWAS, Transcriptomics [19] |
| Body Size | SOX5, IGF1 | Skeletal development, growth factor signaling | Genome resequencing, Selection scans [27] |
| Reproductive Efficiency | NEDD4, SMC1B | Sperm storage capacity, meiosis | Population genomics, GWAS [27] |
| Growth Traits | Multiple regulatory genes | Tissue-specific regulation, metabolic pathways | AIL population, molQTL mapping [16] |
The Scientist's Toolkit: Essential Research Reagents and Databases
Successful multi-omics research requires specialized reagents, technologies, and computational resources. The following tools are essential for designing and implementing integrated omics studies:
Analytical Technologies
Mass Spectrometry Platforms: High-resolution LC-MS/MS systems for proteomics and metabolomics, including Orbitrap and Q-TOF instruments capable of high mass accuracy and resolution [36] [34].
Chromatography Systems: Ultra-high-performance liquid chromatography (UHPLC) systems for separating complex mixtures of proteins, metabolites, or lipids prior to mass spectrometry analysis [36].
Next-Generation Sequencing: Illumina platforms for RNA-Seq and whole-genome sequencing, providing comprehensive coverage of transcripts and genetic variants [34].
Bioinformatics Tools and Databases
Multi-Omics Integration Software: MixOmics (R package), xMWAS, and MOFA2 for statistical integration of multiple omics datasets [35] [36].
Metabolite Databases: The Human Metabolome Database (HMDB), METLIN, and Exposome-Explorer for metabolite identification and annotation [38].
Pathway Analysis Resources: Kyoto Encyclopedia of Genes and Genomes (KEGG), Reactome, and Gene Ontology for functional interpretation of multi-omics results [35] [39].
Genomic Resources: Animal QTLdb for known quantitative trait loci in agricultural species, Ensembl for genome annotation, and GTEx for gene expression patterns across tissues [16] [19].
Figure 2: Multi-Omics Data Integration and Analysis. This diagram shows how different types of omics data are processed through bioinformatics tools, databases, and statistical methods to enable candidate gene validation.
Cross-Species Validation and Conservation
Multi-omics approaches in chicken research have significant implications beyond agricultural science. Chickens serve as important model organisms for avian studies and biomedical research, including osteoporosis, obesity, and metabolic disorders [16]. Cross-species comparisons reveal conserved functions of growth-related genes alongside divergent features of regulatory mechanisms in mammals and birds [16].
The functional validation of candidate genes identified through multi-omics studies can leverage both agricultural and biomedical contexts. For example, genes involved in metabolic pathways discovered in chicken studies may inform human metabolic disorders, while reproductive genes may illuminate mechanisms of fertility across species [27] [16]. This cross-species perspective enhances the value of chicken multi-omics research, creating synergies between agricultural improvement and biomedical advancement.
The integration of transcriptomics, proteomics, and metabolomics with genomic data represents a powerful framework for advancing beyond GWAS in chicken genetics. While GWAS identifies statistical associations between genetic variants and traits, multi-omics approaches illuminate the biological mechanisms underlying these associations. This integrated perspective is particularly valuable for understanding complex economic traits in chickens, which involve dynamic interactions between multiple molecular layers and environmental factors [27] [16].
Future developments in multi-omics research will likely focus on single-cell approaches, spatial omics technologies, and more sophisticated computational integration methods [35]. As these technologies mature, they will enable increasingly precise dissection of the molecular networks governing important traits in agricultural species. For chicken genomics, this progression promises accelerated genetic improvement through better understanding of the functional elements and pathways that influence productivity, health, and efficiency.
The consolidation of multi-omics data represents not merely a technological advancement but a fundamental shift in biological understanding—from a reductionist view of single genes or molecules to a systems-level perspective that captures the emergent properties of complex biological networks. This paradigm shift will ultimately enable more predictive and precise breeding strategies, enhancing both agricultural sustainability and animal welfare.
Clustered Regularly Interspaced Short Palindromic Repeats (CRISPR) and CRISPR-associated protein 9 (Cas9) has emerged as the most widely adopted genome editing tool across molecular biology laboratories, revolutionizing approaches to gene function analysis and trait modification [40]. This third-generation gene editing technology outperforms earlier platforms like Zinc-Finger Nucleases (ZFNs) and Transcription Activator-Like Effector Nucleases (TALENs) through its simplicity of design, lower cost, higher efficiency, and shorter experimental timelines [40] [41]. The system functions as a programmable nuclease that creates double-strand breaks (DSBs) in DNA at specified genomic locations, harnessing cellular repair mechanisms to achieve targeted gene knockouts, insertions, or modifications [40] [42].
Within poultry research, particularly in the context of validating candidate genes for economic traits, CRISPR/Cas9 enables precise manipulation of the avian genome to establish causal relationships between genes and phenotypes of agricultural importance [41]. This guide provides a comprehensive comparison of CRISPR/Cas9 against alternative gene editing technologies, detailed experimental protocols for avian systems, and key resources for implementing this powerful technology in trait validation studies.
Technology Comparison: CRISPR/Cas9 Versus Alternative Gene Editing Platforms
The evolution of programmable nucleases has progressed through three main generations, each with distinct mechanisms and performance characteristics. Table 1 provides a systematic comparison of these gene editing platforms.
Table 1: Comparison of Major Genome Editing Technologies
| Feature | Meganucleases | Zinc-Finger Nucleases (ZFNs) | TALENs | CRISPR-Cas9 |
|---|---|---|---|---|
| DNA Recognition | Protein-based [40] | Zinc finger protein [40] | TALE protein [40] | Guide RNA [40] |
| Nuclease | Endonuclease [40] | FokI [40] | FokI [40] | Cas9 [40] |
| Design Complexity | Complex (1-6 months) [40] | Complex (~1 month) [40] | Complex (~1 month) [40] | Very simple (within a week) [40] |
| Relative Cost | High [40] | High [40] | Medium [40] | Low [40] |
| Off-Target Effects | Low [40] | Lower than CRISPR-Cas9 [40] | Lower than CRISPR-Cas9 [40] | High [40] |
| Primary Repair Mechanism | DSBs repaired by HDR or NHEJ [40] | DSBs repaired by HDR or NHEJ [40] | DSBs repaired by HDR or NHEJ [40] | DSBs repaired by HDR or NHEJ [40] |
CRISPR/Cas9 dominates current research applications, with 45.4% of commercial institution researchers and 48.5% in non-commercial institutions reporting it as their primary genetic modification method [43]. Among CRISPR applications, gene knockout remains the most prevalent approach, used by 54% of commercial respondents and 45% in non-commercial institutions [43].
Experimental Data: Quantitative Outcomes of CRISPR/Cas9 Mediated Editing
CRISPR/Cas9 efficiency has been quantitatively demonstrated across multiple avian studies, providing benchmark data for experimental planning. Table 2 summarizes key performance metrics from recent poultry research.
Table 2: Experimental Efficiency Data for CRISPR/Cas9 in Avian Systems
| Application / Target | Model System | Editing Efficiency | Key Outcomes | Source |
|---|---|---|---|---|
| IHH Gene Knockout | Chicken DF-1 cells [44] | sgRNA1: 45%; sgRNA3: 30.8% [44] | 100% mutation rate in monoclonal cells; significant expression changes in PTCH1, Smo, Gli1, Gli2, OPN, and Col II [44] | [44] |
| Ovomucoid Knockout | Chicken Primordial Germ Cells (PGCs) [42] | Not specified | Deletions of 1-12 bp in target site; germline transmission achieved [42] | [42] |
| eGFP Knock-in | Chicken cell line (GAPDH locus) [42] | 90% HDR efficiency (with G418 selection) [42] | Successful insertion of eGFP into GAPDH locus [42] | [42] |
| Workflow Duration | General CRISPR workflow [43] | 3 months (median for knockouts); 6 months (median for knock-ins) [43] | Researchers typically repeat clonal isolation 3 times (median) before achieving desired edit [43] | [43] |
The cellular repair pathways activated after CRISPR/Cas9 cleavage determine the editing outcome. Non-Homologous End Joining (NHEJ) is an error-prone repair mechanism that often results in insertions or deletions (indels) that disrupt gene function, enabling gene knockout [40] [42]. Homology-Directed Repair (HDR) facilitates precise genetic modifications when a donor DNA template is provided, allowing for gene correction or knock-in [40] [42]. The following diagram illustrates these critical cellular repair mechanisms.
Methodologies: Detailed Protocols for Avian Systems
CRISPR/Cas9 Delivery in Chicken Models
Avian systems present unique challenges for gene editing due to their reproductive biology. Two primary approaches have been successfully implemented:
Primordial Germ Cell (PGC) Culture and Transfection: PGCs are isolated from embryonic blood (stages 10-12 H.H.) or gonads (stages 20-24 H.H.) and cultured in vitro [42]. Transfection is achieved via electroporation of CRISPR/Cas9 components (plasmid DNA, mRNA, or ribonucleoproteins). Edited PGCs are then transplanted into recipient embryos, generating germline chimeras that transmit genetic modifications to the next generation [42] [41]. This method enabled Oishi et al. to generate ovomucoid homozygous offspring with deletions ranging from 1-12 bp in the target site [42].
Direct Embryo Manipulation: Microinjection of CRISPR/Cas9 reagents (typically as ribonucleoprotein complexes) into the subgerminal cavity of Stage X (Eyal-Giladi and Kochav) embryos [41]. Véron et al. successfully used this approach to electroporate plasmids encoding Cas9 and guide RNAs against PAX7 in chicken embryos, demonstrating efficient gene editing in somatic tissues [42].
Screening and Validation of Edits
Following delivery, precise screening methodologies are essential:
TA Cloning and Sequencing: Used to assess editing efficiency and characterize mutation types. For IHH knockout in DF-1 cells, this method confirmed a 100% mutation rate in monoclonal cells with two distinct mutation types [44].
Flow Cytometry for Monoclonal Selection: Enables isolation of homogeneously edited cell populations for functional studies [44].
Quantitative PCR (qPCR) Validation: Measures functional consequences of editing by quantifying expression changes in target and downstream genes. After IHH knockout, qPCR revealed significantly reduced expression of PTCH1, Smo, Gli1, Gli2, and OPN, while Col II expression increased [44].
The following workflow summarizes the complete experimental pipeline for generating gene-edited chickens via PGC culture.
Research Reagent Solutions: Essential Materials for CRISPR Experiments
Successful implementation of CRISPR/Cas9 technology requires specific reagents and tools. Table 3 catalogues essential research reagents and their functions for avian genome editing experiments.
Table 3: Essential Research Reagents for CRISPR/Cas9 Experiments
| Reagent / Tool | Function | Application Notes |
|---|---|---|
| Cas9 Nuclease | Creates double-strand breaks at target DNA sequences [40] | Delivery as plasmid DNA, mRNA, or protein (RNP); RNP delivery reduces off-target effects [42] |
| Guide RNA (gRNA) | Directs Cas9 to specific genomic loci through complementary base pairing [40] [44] | Designed with 20-nt target-specific sequence; requires PAM (NGG for SpCas9) adjacent to target site [40] |
| Single-Stranded Oligo Donor (ssODN) | Serves as repair template for HDR-mediated precise editing [45] | Typically 50-200 nt with homology arms flanking desired modification [45] |
| Primordial Germ Cell (PGC) Culture System | Enables germline editing in avian species [42] [41] | Requires specialized media and conditions to maintain germline competency [42] |
| Electroporation System | Delivers CRISPR components into hard-to-transfect cells like PGCs [42] | Parameters optimized for specific cell type and delivery material (DNA, RNA, RNP) [42] |
| TA Cloning Vectors | Facilitates sequencing of edited genomic loci to characterize mutations [44] | Critical for assessing editing efficiency and mutation spectrum [44] |
CRISPR/Cas9 represents a transformative technology for validating candidate genes associated with economically important traits in chicken models. Its superiority over previous editing platforms lies in simplified design, versatility, and efficiency, enabling systematic functional validation of genes identified through genomic studies. While challenges remain in delivery efficiency and germline transmission in avian systems, established PGC culture and direct embryo manipulation protocols provide robust pathways for generating precisely modified bird lines.
The experimental data and methodologies presented in this guide provide researchers with a comprehensive framework for implementing CRISPR/Cas9 in trait validation studies. By leveraging the reagent solutions and quantitative benchmarks outlined here, scientists can accelerate the characterization of genes influencing growth, disease resistance, reproduction, and product quality in poultry, ultimately contributing to enhanced genetic selection strategies and agricultural sustainability.
In the post-genomic era, the chicken has emerged as a crucial model organism, not only for agricultural science but also for evolutionary biology and biomedical research. While protein-coding genes constitute merely 1-3% of the chicken genome, approximately 90% of phenotype-associated single nucleotide polymorphisms identified through genome-wide association studies reside within non-coding regions [46]. This striking statistic underscores that the primary drivers of phenotypic diversity are likely embedded within the vast regulatory landscape of the genome, particularly in enhancers and their associated transcripts. Enhancer RNAs (eRNAs)—non-coding RNAs transcribed from enhancer regions—have recently emerged as pivotal players in gene regulatory networks, serving as both markers of enhancer activity and functional mediators of gene expression [47] [48]. The comprehensive mapping of enhancer-promoter networks and eRNAs in the chicken genome represents a critical frontier for understanding the genetic architecture underlying economically important traits and bridging evolutionary gaps between avian and mammalian regulatory paradigms.
Research Landscape: Current Status of Chicken Regulatory Genomics
Comprehensive Atlases of Regulatory Elements
Significant efforts have been dedicated to systematically characterizing the regulatory landscape of the chicken genome. A landmark 2023 study integrated 377 genome-wide sequencing datasets from 23 adult tissues to construct a comprehensive atlas of regulatory elements, identifying 1.57 million regulatory elements representing 15 distinct chromatin states [46]. This analysis revealed that enhancers cover approximately 8.86% of the chicken genome, while promoters account for 1.94% [46]. The study further predicted about 1.2 million enhancer-gene pairs and 7,662 super-enhancers, providing an unprecedented resource for exploring gene regulation underlying domestication, selection, and complex trait regulation in chickens.
Table 1: Catalog of Regulatory Elements in the Chicken Genome
| Element Type | Number Identified | Genome Coverage | Key Characteristics |
|---|---|---|---|
| Total Regulatory Elements | 1,573,399 | 15.27% | 15 distinct chromatin states |
| Enhancers | 765,400 | 8.86% | Most dynamic across tissues |
| Promoters | 102,907 | 1.94% | Most conserved across tissues |
| TSS-Proximal Transcribed Regions | 146,045 | 1.31% | Flanking transcription start sites |
| ATAC Islands | 351,928 | 3.64% | Accessible chromatin regions |
| Repressed Regions | 201,377 | 21.52% | Polycomb-associated repression |
Enhancer-Promoter Interactions within 3D Genome Architecture
The spatial organization of the genome fundamentally constrains enhancer-promoter interactions. A 2025 investigation examined these interactions within topologically associating domains (TADs) across multiple tissues in slow- and fast-growing chickens [49]. The research demonstrated a statistically significant association between gene expression levels and enhancer activity in all tissues examined, with most TADs containing multiple transcription start sites along with corresponding enhancers [49]. This modular organization enables coordinated gene regulation, with enhancer-mediated regulation preferentially activating key pathways involved in transcriptional control and nucleic acid biosynthesis.
Table 2: Enhancer-Promoter Interaction Patterns in Chicken TADs
| Interaction Type | Frequency | Regulatory Outcome | Biological Significance |
|---|---|---|---|
| "+ +" (Both enhancer and promoter upregulated) | Predominant | Positive regulation | Activation of transcriptional programs in fast-growing chickens |
| "- +" (Enhancer upregulated, promoter downregulated) | Less frequent | Potential regulatory redistribution | May represent enhancer switching between alternative promoters |
| Coordinated regulatory domains | Common | Uniform response | Orchestrated gene expression within discrete functional units |
| Tissue-specific interactions | Variable | Tissue-specific functions | Underpins specialization in muscle, liver, brain tissues |
Experimental Frameworks: Methodologies for Mapping Regulatory Networks
Chromatin Profiling and State Prediction
The comprehensive annotation of chicken regulatory elements employed ChromHMM to integrate five epigenetic marks (H3K4me3, H3K4me1, H3K27ac, H3K27me3, and ATAC-seq/DNase-seq) across 23 tissues [46]. This approach enabled the prediction of 15 distinct chromatin states based on combinatorial histone modification patterns:
- Tissue Collection and Processing: 23 major tissues from adult chickens were processed for uniform analysis.
- Library Preparation: Chromatin immunoprecipitation sequencing for four histone modifications, ATAC-seq for chromatin accessibility, DNase-seq for hypersensitive sites, and RNA-seq for transcriptome profiling.
- Sequencing and Alignment: Generation of 12.9 billion mapped reads aligned to the chicken reference genome.
- Peak Calling: Identification of significant enrichment regions using standardized peak-calling algorithms for each epigenetic mark.
- Chromatin State Modeling: Application of ChromHMM to segment the genome into discrete states based on combinatorial epigenetic patterns.
- Functional Annotation: Assignment of biological functions to each chromatin state based on genomic enrichment and correlation with gene expression.
The following workflow diagram illustrates the comprehensive process for identifying and validating enhancer RNAs in the chicken genome:
Capturing Enhancer-Promoter Interactions
The 2025 study employed CAGE (Cap Analysis of Gene Expression) methodology to simultaneously assess enhancer and promoter activities within single experiments [49]. This approach enabled precise identification of transcription start sites and detection of clusters corresponding to both promoters and active enhancers. The experimental framework included:
- CAGE Library Preparation: Capture of 5'-capped RNAs from multiple tissues of slow- and fast-growing chickens.
- Bidirectional Cluster Identification: Detection of characteristic bidirectional transcription signatures using CAGEr software.
- TAD Integration: Mapping of TSSs and enhancers within experimentally defined topologically associating domains from blood cells and fibroblasts.
- Interaction Modeling: Construction of potential interaction maps comprising over 23 million TSS-enhancer pairs.
- Differential Filtering: Isolation of pairs containing differentially expressed TSSs and enhancers between fast- and slow-growing chickens for each tissue.
- Cross-Reference Validation: Enhancement of interaction reliability through cross-referencing with TAD maps from multiple cell types.
Enhancer RNA Identification and Characterization
The detection and analysis of enhancer RNAs requires specialized approaches that distinguish them from other transcript classes:
- Definition of eRNA Regions: ±3 kb around the middle loci of enhancers is typically defined as the eRNA region, followed by filtering out overlaps with known transcripts including protein-coding RNAs and other non-coding RNAs [47].
- Expression Quantification: RNA-seq reads mapping to eRNA regions are captured and normalized using Reads Per Million (RPM), with detectable eRNAs defined as those with average expression values >1 RPM in at least one tissue [47].
- Trait Association Analysis: Identification of trait-related eRNAs through statistical assessment of expression differences between sample categories (e.g., male/female, embryo/postnatal) using fold change and false discovery rate thresholds [47].
- Regulator-Target Prediction: Putative regulators are identified through co-expression analysis between eRNAs and transcription factors, while target genes are predicted based on proximity and expression correlation [47].
Table 3: Key Research Reagents and Databases for Chicken Regulatory Genomics
| Resource | Type | Function | Access |
|---|---|---|---|
| Animal-eRNAdb | Database | Comprehensive characterization of 185,177 eRNAs from 10 species | http://gong_lab.hzau.edu.cn/Animal-eRNAdb/ [47] |
| CAGE-seq | Technology | Precise mapping of transcription start sites and bidirectional enhancer transcription | [49] [50] |
| ChromHMM | Algorithm | Chromatin state discovery and characterization based on combinatorial epigenetic marks | [46] |
| FAANG Consortium | Data Resource | Functional annotation of animal genomes, including chicken regulatory elements | [50] [46] |
| AnimalTFDB 4.0 | Database | Comprehensive annotation of transcription factors and cofactors in multiple species | http://bioinfo.life.hust.edu.cn/AnimalTFDB/ [49] |
| SEA 3.0 | Database | Systematic enhancer annotation across multiple species | http://sea.edbc.org/ [47] |
| EnhancerAtlas 2.0 | Database | Enhancer annotation and target gene prediction | http://www.enhanceratlas.org/indexv2.php [47] |
Functional Insights: Biological Significance of Chicken Enhancer Networks
Regulation of Economic Traits
The integration of regulatory element maps with genetic studies has revealed the functional significance of enhancer networks in controlling economically important traits in chickens. A 2025 comparative genomic analysis identified candidate genes associated with growth (TBX22, LCORL, GH), meat quality (A-FABP, H-FABP, PRKAB2), reproduction (IGF-1, SLC25A29, WDR25), and disease resistance (C1QBP, VAV2, IL12B) [10]. These genes were found to be concentrated in functional categories of transcription and signal transduction mechanisms, participating in biological processes such as cyclic nucleotide biosynthesis and intracellular signaling through pathways like ECM-receptor interactions and calcium signaling [10].
A separate GWAS meta-analysis on body weight traits integrated tissue-specific regulatory annotations, revealing significant enrichment of enhancer and promoter elements for KPNA3 and CAB39L in muscle, adipose, and intestinal tissues [51]. This approach identified 77 novel independent variants associated with body weight traits and implicated 59 relevant candidate genes, providing mechanistic insights into the genetic regulation of production efficiency in poultry.
Evolutionary Conservation and Divergence
Comparative analyses have uncovered both conserved and species-specific features of chicken regulatory elements. The Animal-eRNAdb database enables exploration of sequence similarity of eRNAs among multiple species, facilitating investigation of evolutionary conservation [47]. Interestingly, while many enhancers show conservation, a study on predicted enhancer RNAs in the chicken genome reported a class of long enhancer elements that appears absent in mammals, suggesting potential avian-specific regulatory innovations [50].
Analysis of evolutionary breakpoint regions (EBRs) in the chicken genome revealed significant enrichment for promoters, particularly active promoters, including seven genes involved in brain development, immune response, and intestine function [46]. This suggests that chicken-specific EBRs could be associated with avian-specific gene expression profiles, potentially underlying unique biological characteristics of birds.
Regulatory Network Modeling: From Elements to Systems
The construction of eRNA-centric regulatory networks represents a powerful approach for understanding the systems-level organization of gene regulation. A framework applied to lung adenocarcinoma demonstrates how such networks can be built through integration of multiple data types [52]:
- Transcription Factor Binding Analysis: Identification of TF binding events on eRNAs by analyzing TF ChIP-seq datasets.
- Enhancer-Promoter Loop Capture: Detection of eRNA-associated E-P loops through analysis of HiChIP datasets.
- Regulatory Axis Formation: Connection of TF-eRNA and eRNA-loop relationships to form TF-eRNA-loop regulatory axes.
- Network Integration: Combination of regulatory interactions with protein-protein interaction networks.
- Module Extraction: Identification of tightly connected gene modules using clustering algorithms.
- Functional Annotation: Enrichment analysis of network components to infer biological functions.
The following diagram illustrates the complex regulatory networks formed through enhancer-promoter interactions:
The comprehensive mapping of enhancer-promoter networks and eRNAs in the chicken genome has transformed our understanding of avian gene regulation. The resources and methodologies reviewed here provide powerful approaches for connecting non-coding variation to phenotypic outcomes, with significant implications for both basic biology and agricultural biotechnology. Future efforts will likely focus on expanding tissue coverage, developmental timepoints, and genetic diversity in regulatory element maps; improving the resolution of 3D genome organization studies; and developing functional validation methods tailored for avian systems. The integration of these regulatory maps with breeding programs holds particular promise for accelerating genetic improvement of economically important traits in poultry through informed selection of regulatory variants. As these resources continue to mature, they will undoubtedly yield novel insights into the evolutionary dynamics of gene regulation and enhance our ability to precisely modulate agricultural traits through genomic approaches.
For researchers and drug development professionals working to validate candidate genes, traditional genome-wide association studies (GWAS) have presented a significant limitation: their typical reliance on single-time-point measurements captures only static genetic effects, potentially missing dynamic genetic influences that unfold throughout development. This constraint is particularly problematic for complex traits such as those governing economic production in chickens, which exhibit pronounced temporal patterns. Longitudinal GWAS (longGWAS) and multi-trait GWAS (MT-GWAS) have emerged as powerful methodological frameworks that address this critical gap by incorporating temporal dynamics and trait correlations into genetic analyses.
These advanced approaches are revolutionizing our understanding of how genetic architecture shapes trait development over time. As demonstrated in chicken breeding research, longitudinal GWAS effectively models the developmental trajectories of economically vital traits such as egg production and weight, while multi-trait methods leverage genetic correlations among related traits to enhance statistical power and identify pleiotropic loci. For scientists validating candidate genes across species, these methods provide a more comprehensive toolkit for deciphering complex genetic networks that operate throughout developmental stages and across physiological systems. This article provides a comparative analysis of these methodologies, supported by experimental data and practical protocols from recent studies.
Methodological Framework: Longitudinal vs. Multi-Trait Approaches
Core Concepts and Definitions
Longitudinal GWAS specializes in analyzing traits measured repeatedly over time, capturing how genetic effects influence phenotypic trajectories and developmental processes. This approach models time-dependent genetic effects, allowing researchers to distinguish between variants that exert consistent influence and those with effects specific to certain developmental windows [53] [54]. For example, in chickens, longitudinal GWAS has been applied to egg production curves, identifying genetic variants that influence the rate of increase in laying ability and the timing of sexual maturity [53].
Multi-Trait GWAS simultaneously analyzes multiple correlated traits, leveraging their genetic covariances to boost statistical power for detecting pleiotropic loci—genetic variants that influence multiple traits simultaneously. MT-GWAS is particularly valuable for dissecting the shared genetic architecture of complex syndromes or interrelated biological processes [55] [56]. In poultry science, this approach has identified pleiotropic genes affecting both egg production and quality traits [57].
Statistical Models and Computational Approaches
Table 1: Comparison of Statistical Models for Longitudinal and Multi-Trait GWAS
| Model Type | Key Features | Advantages | Limitations | Representative Studies |
|---|---|---|---|---|
| Linear Mixed Models (Longitudinal) | Random intercepts & slopes correlated (RI&RS) | Unbiased effect estimates, handles singletons | Computationally intensive | Kidney function decline [54] |
| Two-Stage BLUPs & Linear Regression | Best Linear Unbiased Predictors of slopes | Computational efficiency, high power | Effect size shrinkage, excludes singletons | Chicken growth traits [58] |
| Multivariate GWAS | Simultaneous analysis of multiple traits | Identifies pleiotropy, improved power | Requires careful trait selection | Chicken egg weights [59] |
| MTAG (Multi-trait Analysis of GWAS) | Uses summary statistics from correlated traits | Enhanced power, flexible framework | Dependent on genetic correlations | Maize agronomic traits [60] |
Several sophisticated statistical frameworks have been developed to implement these approaches. For longitudinal GWAS, Linear Mixed Models (LMMs) with random intercepts and slopes (RI&RS) have emerged as a powerful approach with unbiased effect estimates, capable of integrating individuals with only a single measurement ("singletons") [54]. The two-stage approach involving Best Linear Unbiased Predictors (BLUPs) of person-specific slopes followed by linear regression, while computationally efficient and powerful, introduces substantial effect size shrinkage (11-38%) according to comparative analyses [54].
For multi-trait analyses, Multivariate GWAS models that jointly analyze multiple traits can identify pleiotropic loci that might be missed in single-trait analyses [59]. More recently, methods like MTAG (Multi-trait analysis of GWAS) leverage summary statistics from genetically correlated traits to enhance discovery power, as demonstrated in studies of maize agronomic traits where it identified novel pleiotropic loci [60].
Experimental Applications in Chicken Economic Traits
Longitudinal GWAS for Egg Production Traits
The application of longitudinal GWAS to chicken egg production has revealed dynamic genetic architectures underlying this economically crucial trait. In a comprehensive study of Gushi chickens, researchers employed the Yang-Ning model to fit individual egg-laying rate curves, deriving four biologically meaningful parameters: Potential Maximum Egg production (PME), Rate of Decrease in Laying ability (RDL), Rate of Increase in Laying ability (RIL), and Mean Age at Sexual Maturity (MASM) [53].
The experimental protocol for this approach involved:
- Individual egg production recording: Daily tracking from sexual maturity to 43 weeks of age
- Weekly rate calculation: Conversion to weekly egg production rates
- Curve fitting: Application of Yang-Ning model to individual laying curves
- Parameter extraction: Derivation of PME, RDL, RIL, and MASM for each hen
- GWAS implementation: Association analysis using mixed linear models in GAPIT3
This longitudinal approach identified several candidate genes with time-dependent effects on egg production, including:
- C3: Associated with rate of increase in laying ability
- CADPS2: Influenced mean age at sexual maturity
- TLN2: Affected multiple egg production parameters [53]
The integration of Bayesian networks and structural equation modeling further enabled researchers to quantify both direct and indirect effects of these genetic variants on overall egg production, revealing that earlier age at first egg directly promotes total egg number [53].
Multi-Trait GWAS for Comprehensive Genetic Architecture
Multi-trait approaches have similarly advanced our understanding of chicken economic traits. A groundbreaking study applied both single-trait and multi-trait GWAS to egg weight trajectories across different ages, revealing both shared and age-specific genetic influences [59]. The experimental workflow included:
Table 2: Key Genetic Loci Identified Through Multi-Trait GWAS in Chickens
| Trait Category | Candidate Genes | Biological Function | Genetic Effect | Study Reference |
|---|---|---|---|---|
| Egg Production | TFPI2, CAMK2D, OSTN | GnRH secretion, FSHβ/LHβ secretion, granulosa cell proliferation | Facilitates egg-laying | [57] |
| Growth Traits | LCORL, GH | Regulation of body size, growth hormone pathway | Increases growth rate | [3] |
| Meat Quality | A-FABP, H-FABP | Fat metabolism, intramuscular fat deposition | Improves meat quality | [3] |
| Disease Resistance | C1QBP, VAV2 | Immune response, cellular signaling | Enhances disease resistance | [3] |
- Phenotypic measurements: Egg weights at nine time points from onset of laying to 60 weeks
- Genetic parameter estimation: Calculation of SNP-based heritability and genetic correlations
- Univariate GWAS: Separate analysis for each time point
- Multivariate GWAS: Joint analysis of all time points
- Conditional analysis: Stepwise conditioning on significant loci to identify independent signals
This multi-trait approach identified a strongly polygenic architecture for egg weight, with a linear correlation between chromosome length and explained phenotypic variance [59]. Significant loci on chromosomes 1 and 4 contained candidate genes including NCAPG, which harbors a non-synonymous SNP causing a valine-to-alanine substitution potentially affecting protein function [59].
A more recent multi-omics study integrated GWAS with selective sweep analysis and multi-tissue transcriptomics to identify hub candidate genes for egg-laying performance, including TFPI2 (promotes GnRH secretion), CAMK2D (promotes FSHβ and LHβ secretion), and OSTN (promotes granulosa cell proliferation) [57]. This systems biology approach further revealed key endocrine factors involved in inter-tissue communication, such as the hepatokine APOA4 and adipokine ANGPTL2, which increase egg production through coordination with the hypothalamic-pituitary-ovarian axis [57].
Integrated Analysis Workflow and Visualization
The integration of longitudinal and multi-trait approaches provides a powerful framework for comprehensive genetic dissection of complex traits. The following diagram illustrates a recommended workflow for implementing these methods:
Diagram 1: Integrated workflow for longitudinal and multi-trait GWAS
The Scientist's Toolkit: Essential Research Reagents and Solutions
Table 3: Essential Research Reagents and Solutions for Longitudinal and Multi-Trait GWAS
| Reagent/Solution | Application | Key Features | Example Uses |
|---|---|---|---|
| High-Density SNP Arrays | Genotyping | Genome-wide coverage, standardized panels | Chicken 600K SNP array for egg weight GWAS [59] |
| Whole-Genome Sequencing | Variant discovery | Comprehensive variant detection, no SNP preselection | Gushi chicken resequencing (13.4M SNPs) [53] |
| OrthoFinder Software | Comparative genomics | Ortholog group identification, phylogenetic analysis | Cross-species candidate gene validation [3] |
| GAPIT3 Package | GWAS implementation | Multiple statistical models, efficient computation | MLM analysis of egg production parameters [53] |
| PAML CodeML | Selection analysis | Detects positive selection, evolutionary patterns | Branch-site model for adaptive evolution [3] |
| CAFE Software | Gene family evolution | Models expansion/contraction across phylogeny | Gene family dynamics in avian evolution [3] |
Cross-Species Validation and Comparative Genomic Approaches
Validating candidate genes across species represents a critical step in confirming their biological importance and functional conservation. Comparative genomic analyses between chickens and other species have identified numerous candidate genes associated with important economic traits [3]. The experimental protocol for this approach involves:
- Multi-species genome acquisition: Collection of reference genomes from related and divergent species
- Orthologous gene identification: Using tools like OrthoFinder to identify conserved genes
- Phylogenetic reconstruction: Building species trees to understand evolutionary relationships
- Selection analysis: Applying CodeML branch-site models to detect positive selection
- Functional annotation: KEGG, GO, and pathway enrichment analyses
This approach has successfully identified conserved genes associated with chicken growth traits (TBX22, LCORL, GH), meat quality (A-FABP, H-FABP, PRKAB2), reproductive traits (IGF-1, SLC25A29, WDR25), and disease resistance (C1QBP, VAV2, IL12B) [3]. These genes are enriched in functional categories such as transcription, signal transduction mechanisms, cyclic nucleotide biosynthesis, and intracellular signaling, participating in pathways including ECM-receptor interactions and calcium signaling [3].
Longitudinal and multi-trait GWAS approaches represent significant methodological advancements in genetic analysis, enabling researchers to capture the dynamic nature of genetic effects across development and leverage pleiotropy for enhanced gene discovery. For scientists validating candidate genes across species, these methods provide a more comprehensive understanding of genetic architecture than traditional single-time-point, single-trait analyses.
The integration of these approaches with multi-omics data and comparative genomics creates a powerful framework for identifying biologically significant genes with conserved functions across species. As these methods continue to evolve, they will undoubtedly yield deeper insights into the genetic networks underlying complex traits in chickens and other species, ultimately accelerating genetic improvement programs and enhancing our fundamental understanding of genotype-phenotype relationships across development.
The identification of candidate genes associated with economically important traits in chickens represents merely the starting point of a much deeper biological investigation. Moving from statistical associations to demonstrated causality requires a rigorous multi-stage validation process employing both in vitro and in vivo functional assays. This methodological progression is crucial for agricultural biotechnologists and pharmaceutical developers seeking to translate genetic discoveries into tangible applications for poultry science and trans-species research. The fundamental challenge lies in distinguishing mere correlation from true biological causation—a process that demands carefully designed experimental workflows that progressively build evidence for gene function. This guide provides a comprehensive comparison of the key assay methodologies that enable this critical transition, offering researchers a structured framework for validating candidate genes across biological contexts from molecular interactions to whole-organism phenotypes.
In Vitro Validation: Establishing Molecular Function
Cell-Based Reporter Assays for Functional Characterization
Cell-based reporter assays serve as powerful initial tools for characterizing gene function at the molecular level, particularly for assessing how candidate genes regulate downstream signaling pathways and transcriptional activity. These assays typically involve introducing genetic constructs into cultured cells that contain regulatory elements from candidate genes linked to easily measurable reporter genes. The core strength of this approach lies in its ability to isolate specific gene functions in a controlled environment, free from the complex regulatory networks present in whole organisms.
Key Performance Metrics for Cell-Based Assays: Several quantitative metrics are essential for evaluating the performance and reliability of cell-based functional assays. The table below summarizes these critical parameters and their interpretation:
Table 1: Key Performance Metrics for Cell-Based Functional Assays
| Metric | Description | Interpretation | Optimal Range |
|---|---|---|---|
| EC₅₀/IC₅₀ | Concentration producing half-maximal activation/inhibition | Compound potency; lower values indicate higher potency | Compound-dependent; lower values indicate higher potency [61] |
| Signal-to-Background (S/B) | Ratio of test compound signal to untreated background | Assay window; higher values indicate stronger functional response | High ratios desirable (agonist-mode: Fold-Activation; antagonist-mode: Fold-Reduction) [61] |
| Z' Factor | Statistical parameter incorporating standard deviation and S/B | Assay robustness and quality | 0.5-1.0: Good to excellent (suitable for screening); <0.5: Poor quality (unsuitable for screening) [61] |
Experimental Protocol - Cell-Based Luciferase Reporter Assay:
- Vector Construction: Clone the putative regulatory sequence (promoter/enhancer) of your candidate gene upstream of a luciferase reporter gene in a mammalian expression vector.
- Cell Seeding: Plate appropriate host cells (e.g., HEK293, DF-1 for avian studies) in 96-well or 384-well plates at optimal density for transfection (typically 10,000-50,000 cells/well).
- Transfection: Co-transfect cells with the reporter construct and an expression vector for your candidate gene using lipid-based transfection reagents. Include controls: empty vector, constitutive promoter, and promoter-less reporter.
- Stimulation/Inhibition: After 24 hours, treat cells with relevant stimuli or inhibitors based on the hypothesized function of your candidate gene.
- Signal Detection: At 48 hours post-transfection, lyse cells and measure luciferase activity using a luminometer.
- Data Analysis: Normalize luminescence readings to protein concentration or co-transfected control reporters (e.g., Renilla luciferase). Calculate fold-change over baseline and determine statistical significance.
The Z' factor is particularly valuable as it provides a quantitative measure of assay robustness, incorporating both the assay dynamic range (signal-to-background) and the data variation (standard deviations) into a single metric that predicts the suitability of an assay for screening applications [61].
Figure 1: Workflow for in vitro functional validation of candidate genes using cell-based reporter assays.
Gene Set Enrichment Analysis (GSEA) for Pathway Identification
Before proceeding to functional assays, bioinformatic approaches like Gene Set Enrichment Analysis (GSEA) can help prioritize candidate genes by determining whether defined sets of genes (e.g., those in specific pathways) show statistically significant enrichment in expression data. Advanced algorithms like SetRank address limitations of traditional GSEA by accounting for overlaps between gene sets and eliminating false positives that arise primarily through overlap with other significant sets [62].
Experimental Protocol - SetRank Analysis:
- Input Preparation: Compile your ranked list of genes based on differential expression statistics from association studies.
- Gene Set Collection: Combine relevant pathway databases (GO, KEGG, Reactome) appropriate for avian biology or your specific trait of interest.
- Primary p-value Calculation: For each gene set, calculate significance using a method that doesn't rely on arbitrary cutoff thresholds (e.g., modified Eden et al. method).
- False Positive Filtering: Discard gene sets whose significance is primarily attributable to overlap with other gene sets.
- Network Integration: Build a gene set network where edges represent significant overlaps, using topology to prioritize results.
- Background Correction: Carefully select background gene sets to avoid sample source bias that might confound results.
This approach is particularly valuable for researchers studying chicken economic traits as it helps contextualize candidate genes within broader biological processes, generating more informed hypotheses for subsequent functional testing [62].
In Vivo Validation: Establishing Biological Relevance in Whole Organisms
Quantitative Trait Locus (QTL) Validation in Mapping Populations
While in vitro assays establish molecular function, in vivo validation through QTL mapping provides critical evidence that candidate genes influence traits in whole organisms. This approach is particularly valuable for complex economic traits in chickens that are influenced by multiple genetic and environmental factors. Recent advances in high-density genetic mapping have dramatically improved the precision of QTL detection, enabling researchers to move from broad chromosomal regions to specific candidate genes.
QTL Mapping Population Types: Different population structures offer distinct advantages for validating candidate genes. The table below compares the primary mapping populations used in genetic validation studies:
Table 2: Comparison of Genetic Populations for In Vivo QTL Validation
| Population Type | Key Features | Advantages | Limitations | Sample Size Range |
|---|---|---|---|---|
| Recombinant Inbred Lines (RILs) | Developed by repeated selfing of F2 individuals until lines are virtually homozygous | Fixed genotypes enable replicated phenotyping across environments; permanent resource | Development time-consuming (6-8 generations); limited recombination events | 92-215 lines [63] [64] [65] |
| Near-Isogenic Lines (NILs) | Developed through repeated backcrossing to isolate specific genomic regions in uniform background | Powerful for fine-mapping; minimal genetic background noise | Development requires many generations (BC₄F₂ or later); limited to one QTL at a time | 469 individuals [66] |
| F₂:₃ Families | F2 individuals selfed to create families for replicated phenotyping | Enables measurement of heritability; good for traits with high GxE interaction | Not permanent resource; requires maintaining seeds | 150-235 families [66] |
Experimental Protocol - QTL Validation Using RIL Populations:
- Population Development: Cross parental lines with contrasting phenotypes for your target economic trait. Advance generations by single seed descent to create RILs (typically F₆:F₇ generations for ~99% homozygosity).
- High-Density Genotyping: Utilize SNP arrays (e.g., 35K SNP array) supplemented with SSR markers to construct high-density genetic maps. For chicken studies, employ the relevant avian genotyping platforms.
- Multi-Environment Phenotyping: Evaluate phenotypic traits across multiple environments or replicates using randomized complete block designs to account for environmental variance.
- Linkage Map Construction: Generate genetic maps using appropriate software (e.g., JoinMap, R/qtl) with marker ordering based on maximum likelihood.
- QTL Analysis: Perform composite interval mapping (CIM) or mixed-model based composite interval mapping (MCIM) to detect QTLs while controlling for background genetic effects.
- Validation in Diverse Backgrounds: Confirm detected QTLs in additional populations with different genetic backgrounds to verify stability and general applicability.
Recent studies in plants have successfully employed this approach to identify and validate major QTLs for agriculturally important traits. For instance, research on wheat supernumerary spikelets identified and validated two major QTLs (QSS.sicau-2A and QSS.sicau-2D) using multiple RIL populations, with the QSS.sicau-2D QTL explaining 27.4-32.9% of phenotypic variance [64]. Similarly, in maize, a major QTL for kernel width (qKW-1) was fine-mapped using near-isogenic lines, ultimately identifying two candidate genes (GRMZM2G083176 and GRMZM2G081719) through transcriptome analysis [66]. These methodologies are directly transferable to poultry science for validating candidate genes associated with chicken economic traits.
Bulk Segregant Analysis for Rapid Gene Mapping
For traits with simple inheritance, bulk segregant analysis (BSA) coupled with exome sequencing (BSE-Seq) offers a rapid method for mapping candidate genes. This approach is particularly valuable when working with traits that show clear phenotypic distinctions between extreme variants.
Experimental Protocol - BSA-Seq:
- Population Development: Create a segregating population (e.g., F₂) from parents with contrasting phenotypes for your target trait.
- Phenotypic Extremes Selection: Select individuals representing extreme phenotypes (typically 30-50 individuals per bulk) from your segregating population.
- Bulk Construction: Pool equal amounts of DNA from each selected individual to create "high" and "low" phenotypic bulks.
- Exome Sequencing: Sequence the bulks and parents using exome capture technology to enrich for coding regions.
- Variant Calling: Identify SNPs and InDels between bulks using alignment to the reference genome.
- Association Analysis: Calculate the SNP index (ratio of reads containing alternate allele to total reads) for each bulk and identify genomic regions where the SNP index difference (Δ(SNP-index)) between bulks approaches 1.
This approach was successfully used in wheat to identify QTLs for supernumerary spikelets, with the identified regions subsequently fine-mapped to intervals of 7.6 Mb and 2.4 Mb for further candidate gene analysis [64].
Figure 2: Candidate gene analysis workflow following QTL identification and validation.
Candidate Gene Analysis and Prioritization
Integrated Approaches for Candidate Gene Identification
Once QTL regions are validated, the next critical step is identifying the specific genes responsible for the observed phenotypic effects. This process typically involves an integrated approach combining bioinformatic analysis with experimental validation.
Candidate Gene Analysis Protocol:
- Delineate Physical Interval: Convert the genetic map positions of validated QTLs to physical intervals using the reference genome.
- Gene Annotation: Identify all protein-coding genes within the target region using genome annotation databases.
- Expression Filtering: Filter genes based on expression patterns in tissues relevant to your target trait (e.g., skeletal muscle for growth traits, reproductive tissues for egg production traits).
- Orthology Analysis: Identify orthologs of known functional genes from model organisms that map to your target interval.
- Variant Analysis: Sequence candidate genes from parental lines to identify potentially functional polymorphisms (missense variants, splice site mutations, etc.).
- Functional Domain Assessment: Prioritize genes containing mutations in conserved functional domains or regulatory regions.
In a study on leaf rolling in wheat, researchers combined QTL mapping with in silico candidate gene analysis, identifying 14 putative candidate genes within a stable QTL region, which was subsequently narrowed to six genes based on expression and functional annotation, with TraesCS5D02G253100 emerging as the strongest candidate due to its 96.9% identity with the rice leaf rolling gene OsZHD1 [65]. This integrated approach exemplifies how researchers can progress from a broad QTL region to specific candidate genes with known functional relevance.
Comparative Genomics Across Species
For chicken researchers, comparative genomics offers powerful opportunities to leverage functional information from model organisms. By examining conserved syntenic regions and identifying orthologs of genes with known functions in other species, researchers can prioritize candidate genes for functional validation.
Key strategies include:
- Synteny Analysis: Identify conserved gene order between chicken chromosomes and well-annotated genomes like human, mouse, or zebra finch.
- Ortholog Mapping: Use reciprocal best BLAST hits to identify one-to-one orthologs between chicken and model organisms.
- Pathway Conservation: Examine whether complete metabolic or regulatory pathways are conserved across species.
- Functional Transfer: Apply knowledge from gene knockout studies in model organisms to predict gene function in chickens.
This approach was successfully used in maize research, where knowledge of rice kernel size genes enabled the identification of orthologous genes in maize, including ZmGW2–CHR4, ZmGW2–CHR5, Zm-GS3, and Zm-GS5, which were subsequently shown to influence kernel development in maize [66].
Essential Research Reagent Solutions
Successful execution of functional assays requires access to high-quality research reagents specifically validated for use in chicken systems or cross-species applications. The table below outlines essential materials and their applications in candidate gene validation:
Table 3: Essential Research Reagent Solutions for Candidate Gene Validation
| Reagent Category | Specific Examples | Primary Applications | Key Considerations |
|---|---|---|---|
| Cell-Based Assay Systems | Luciferase reporter assays; GFP-based systems; β-galactosidase assays | Promoter activity analysis; protein localization; protein-protein interactions | Species-specific compatibility; transfection efficiency; background activity [61] |
| Genotyping Platforms | SNP chips (e.g., 600K Chicken SNP array); SSR markers; KASP assays | QTL mapping; marker-assisted selection; population genetics | Density of coverage; polymorphism rate; cost per sample [63] [64] [65] |
| Antibodies | Custom antibodies against candidate gene products; phospho-specific antibodies | Western blotting; immunohistochemistry; protein quantification | Species cross-reactivity; validation in target tissues; specificity confirmation |
| CRISPR/Cas9 Components | Guide RNA design tools; Cas9 expression vectors; HDR templates | Gene knockout; precise genome editing; functional validation | Efficiency in avian cells; off-target prediction; delivery methods |
| RNAi Reagents | siRNA libraries; shRNA vectors; miRNA mimics/inhibitors | Gene knockdown; functional screening; pathway analysis | Knockdown efficiency; duration of effect; off-target effects |
| Expression Vectors | Tissue-specific promoters; inducible systems; viral delivery vectors | Overexpression studies; complementation tests; gene therapy | Promoter specificity; expression level; integration status |
The journey from genetic association to demonstrated causality requires methodical progression through increasingly complex validation stages. Initial in vitro assays provide crucial evidence of molecular function under controlled conditions, while QTL mapping in appropriate genetic populations establishes biological relevance in whole organisms. The integration of high-density genotyping with sophisticated bioinformatic analyses enables researchers to narrow broad QTL regions to specific candidate genes, which can then be prioritized using comparative genomics approaches. Throughout this process, attention to assay quality metrics—such as Z' factors for in vitro assays and heritability estimates for phenotypic data—ensures the reliability and reproducibility of findings. For researchers focused on chicken economic traits, this multi-tiered validation framework provides a robust pathway for translating genetic associations into validated biological mechanisms with applications in poultry science, agricultural biotechnology, and comparative genomics across species.
Overcoming Challenges in Gene Validation and Trait Improvement
Linkage disequilibrium (LD), the non-random association of alleles at different loci in a population, presents both an opportunity and a challenge in genetic association studies. While it enables genome-wide association studies (GWAS) to detect signals through tag SNPs, it complicates the precise identification of causal variants underlying complex traits [67]. In the context of poultry genomics, where understanding the genetic architecture of economically important traits like egg production, growth rate, and disease resistance is crucial for breeding programs, resolving LD to pinpoint causal variants becomes particularly important [3] [5].
Fine-mapping refers to statistical and computational approaches designed to distinguish causal variants from non-causal ones that appear associated due to LD [68] [69]. Standard fine-mapping methods often assume unrelated individuals, leading to poor accuracy in populations with substantial relatedness—a common scenario in livestock and poultry breeding programs [68] [70]. Recent methodological advances have specifically addressed this limitation, offering enhanced frameworks for accurate causal variant identification in related populations.
Understanding Linkage Disequilibrium: Fundamental Concepts
LD Measures and Their Interpretation
Linkage disequilibrium exists when alleles at different loci co-occur more or less often than expected by chance, creating non-random associations between genetic variants [67]. Two primary metrics quantify this relationship:
- r² (squared correlation coefficient): Measures how well one variant predicts another, with values ranging from 0 to 1. This measure is particularly useful for tag SNP selection and GWAS power calculations, with thresholds of 0.2, 0.5, and 0.8 typically indicating low, moderate, and strong predictive power for tagging, respectively [67].
- D' (standardized disequilibrium coefficient): Reflects whether recombination has likely occurred between sites, useful for inferring historical recombination patterns and haplotype block detection. D' is less sensitive to allele frequency differences but can be inflated by rare variants [67].
Forces Shaping LD Patterns
Multiple evolutionary forces influence LD patterns in populations:
- Recombination: Breaks down LD over generations, with hotspots creating sharp LD decay over short genomic distances
- Genetic drift: In small populations, random sampling can create strong LD among nearby or distant sites
- Demography: Bottlenecks increase genome-wide LD, while population expansions reduce it
- Selection: Selective sweeps can hitchhike linked variants, increasing LD around selected loci
- Mutation: New variants begin in complete LD with their background haplotypes [67]
In chicken populations, these forces create distinctive LD patterns that fine-mapping methods must accommodate. Advanced intercross lines (AILs) in chickens have been specifically developed to enhance recombination and improve mapping resolution by rapidly breaking down LD over generations [16].
Methodological Framework: Fine-Mapping Approaches
Bayesian Fine-Mapping Frameworks
Bayesian approaches have emerged as powerful tools for fine-mapping, particularly in related populations where standard methods falter. These methods calculate posterior probabilities of causality for each variant within associated regions [68] [69].
BFMAP Framework: Specifically designed for samples with relatedness, this comprehensive Bayesian framework includes:
- BFMAP-SSS: Uses individual-level data with a linear mixed model (LMM) and shotgun stochastic search with simulated annealing for enhanced model exploration
- BFMAP-Forward: An earlier implementation using forward selection for model space exploration [68]
Summary Statistics Adaptations: For widespread applicability, researchers have developed FINEMAP-adj and SuSiE-adj, which adapt popular fine-mapping tools (FINEMAP and SuSiE) for related samples by incorporating LMM-derived inputs, including a relatedness-adjusted LD matrix [68] [70].
PAINTOR Framework: This Bayesian approach incorporates functional annotations to prioritize variants, operating on the premise that causal variants might act through similar biological pathways. The PaintorPipe implementation automates the pre-processing, fine-mapping, and post-processing steps, making this method more accessible [69].
Haplotype-Based Approaches
Haplotype-based methods offer an alternative to single-variant approaches, particularly valuable in plant and animal populations with extensive LD blocks:
HapFM: This novel haplotype-based trait fine-mapping framework partitions genomes into haplotype blocks, identifies haplotype clusters within each block, then performs genome-wide haplotype fine-mapping to prioritize candidate causal haplotype blocks. This approach demonstrates particular strength in high-polygenicity settings and regions of high LD [71].
Incorporating Structural Variations
Structural variations (SVs)—large genetic polymorphisms ranging from 50bp to several megabases—often play crucial roles in complex traits but are frequently missed in standard SNP-based GWAS. The GWAS SVatalog tool addresses this by computing and visualizing LD between SVs and GWAS-associated SNPs, enabling researchers to identify SVs that may explain GWAS loci where SNPs alone cannot provide a causal explanation [72].
Performance Comparison of Fine-Mapping Methods
Quantitative Performance Metrics
Table 1: Comparative Performance of Fine-Mapping Methods in Related Populations
| Method | Data Input | Key Features | Accuracy in Related Samples | Limitations |
|---|---|---|---|---|
| BFMAP-SSS | Individual-level | LMM + shotgun stochastic search | Several-fold increase in precision-recall AUC [68] | Computationally intensive |
| FINEMAP-adj | Summary statistics | Adjusted LD matrix from LMM | Substantial improvement over standard FINEMAP [68] | Requires relatedness-aware inputs |
| SuSiE-adj | Summary statistics | Sum of Single Effects model with adjustments | Substantial improvement over standard SuSiE [68] | Requires relatedness-aware inputs |
| PAINTOR | Summary statistics | Incorporates functional annotations | Improved prioritization using annotation enrichment [69] | Multiple pre-/post-processing steps |
| HapFM | Individual-level | Haplotype block partitioning | Higher mapping power in high polygenicity [71] | Optimized for plant genomes |
| PLINK Clumping | Summary statistics | LD-based clumping of association results | Fast but limited in highly correlated regions [73] | Greedy algorithm, single assignment |
Advanced Intercross Lines for Enhanced Mapping Resolution
In chicken populations, Advanced Intercross Lines (AILs) have proven particularly valuable for fine-mapping. A 16-generation chicken AIL study demonstrated dramatically improved mapping resolution, with LD decay (r² = 0.1) decreasing from 259 kb in F2 to 143 kb in F16 generations. This enhanced recombination enabled the identification of 154 single-gene quantitative trait loci (QTLs) from 682 total QTLs, with average QTL intervals of 244 ± 343 kb in the F16 generation [16].
Table 2: Fine-Mapping Resolution in Chicken Advanced Intercross Lines
| Generation | Sample Size | LD Decay (r²=0.1) | Average QTL Length | Single-Gene QTLs Identified |
|---|---|---|---|---|
| F2 | 655 | 259 kb | >500 kb | Limited |
| F16 | 4671 | 143 kb | 244 ± 343 kb | 154 |
| Improvement | 7.1x increase | 1.8x better resolution | ~2x reduction | Substantial increase |
Experimental Protocols and Workflows
Bayesian Fine-Mapping Protocol for Related Populations
The following workflow diagram illustrates the comprehensive Bayesian fine-mapping framework for related samples:
Implementation Steps:
Input Preparation: For individual-level data analysis, genotype data must undergo quality control including filters for minor allele frequency (MAF ≥1%), Hardy-Weinberg equilibrium, and imputation quality (INFO score ≥0.8) [68].
Model Specification:
- For BFMAP-SSS, the linear mixed model includes fixed effects for tested variants and random effects accounting for genetic relatedness through a genomic relationship matrix (GRM)
- For summary statistics approaches, compute LMM-derived z-scores, effective sample size, and relatedness-adjusted LD matrix [68]
Model Fitting and Search:
- BFMAP-SSS employs shotgun stochastic search with simulated annealing to efficiently explore the vast model space of possible causal configurations
- FINEMAP-adj and SuSiE-adj utilize adapted versions of their respective search algorithms with the adjusted inputs [68]
Post-processing:
- Compute gene-level posterior inclusion probabilities (PIPgene) by aggregating variant-level evidence
- Annotate credible sets with functional information from relevant databases
- Perform functional enrichment analysis to identify overrepresented biological pathways [68]
Haplotype-Based Fine-Mapping Protocol
For haplotype-based approaches like HapFM, the workflow involves distinct processing stages:
Implementation Steps:
Haplotype Block Partitioning: Divide the genome into non-overlapping blocks using LD-based partitioning algorithms (Uniform partition, PLINK, or BigLD), typically with pairwise r² threshold of 0.1 [71].
Haplotype Clustering: Within each block, enumerate unique haplotypes and perform clustering (using affinity propagation, X-means, or spectral clustering methods) when the number of unique haplotypes exceeds a threshold (default: 10) [71].
Association Testing: Fit a linear mixed model with haplotype features, accounting for population structure and kinship.
Functional Integration: Incorporate biological annotations such as structural variations, regulatory elements, or gene annotations to improve prioritization [71].
Table 3: Research Reagent Solutions for Fine-Mapping Studies
| Resource Type | Specific Tools/Databases | Application in Fine-Mapping | Key Features |
|---|---|---|---|
| Software Tools | BFMAP, FINEMAP-adj, SuSiE-adj [68] | Bayesian fine-mapping in related samples | LMM-based, accounts for relatedness |
| PAINTOR, PaintorPipe [69] | Annotation-informed fine-mapping | Integrates functional annotations | |
| HapFM [71] | Haplotype-based fine-mapping | Reduced mapping intervals in high LD | |
| PLINK [73] | LD-based clumping, basic fine-mapping | Fast processing, standard format support | |
| Genomic Resources | GWAS SVatalog [72] | SV-aware fine-mapping | Pre-computed LD between SVs and GWAS SNPs |
| Animal QTLdb [16] | Comparative QTL mapping | Repository of known QTLs across species | |
| Chicken FAANG [16] | Functional annotation in chickens | Tissue-specific regulatory element maps | |
| Reference Data | 1000 Genomes Project [69] | LD reference panels | Population-specific haplotype structures |
| Chicken Reference Panels [16] | Species-specific imputation | Enhanced genotype accuracy in poultry |
Application to Chicken Economic Traits: A Case Study
Candidate Gene Validation Across Species
Comparative genomic analyses across multiple species have identified numerous candidate genes associated with economically important traits in chickens:
- Growth traits: TBX22, LCORL, and GH [3]
- Meat quality: A-FABP, H-FABP, and PRKAB2 [3]
- Reproductive traits: IGF-1, SLC25A29, and WDR25 [3]
- Disease resistance: C1QBP, VAV2, and IL12B [3]
Fine-mapping approaches have been successfully applied to egg production traits in indigenous chicken breeds. A GWAS of Wuhua yellow chickens identified 871 significant SNPs and annotated 379 candidate genes, with key regulators including SCUBE1 and KRAS for age at first egg through follicular development pathways, and IGF1 and PTK2 for clutch size through mTOR and insulin signaling pathways [5].
Integrating Multi-Omics Data for Enhanced Validation
The functional validation of candidate genes benefits tremendously from integrating multi-omics data. In chicken AIL populations, researchers have established networks of tissue-specific regulatory mutations and functional gene relationships through multiple co-localization methods, leveraging gene-clustering and restoration QTLs within the omnigenic model framework to elucidate genetic regulation systems of growth traits [16].
Cross-species comparisons further enhance candidate gene validation, revealing both conserved functions of growth-related genes and divergent features of regulatory mechanisms between mammals and birds [16]. This comparative approach strengthens confidence in prioritized candidates for further functional studies.
Fine-mapping causal variants in the context of linkage disequilibrium remains challenging but essential for advancing genetic improvement in agricultural species. Methodological innovations, particularly those addressing population relatedness through Bayesian frameworks and haplotype-based approaches, have substantially improved mapping accuracy and resolution. The integration of multi-omics data and functional annotations further enhances our ability to prioritize causal variants and genes underlying economically important traits in chickens.
For researchers validating candidate genes across species, employing multiple complementary fine-mapping approaches—particularly those specifically designed for related populations—provides the most robust evidence for causal gene identification. As genomic resources continue to expand and methods become more sophisticated, fine-mapping will play an increasingly crucial role in bridging the gap between genetic association signals and biological mechanisms underlying complex traits.
In genetic studies of complex traits, the initial identification of a quantitative trait locus (QTL) is often just the beginning. The subsequent challenge lies in fine-mapping the locus to a narrow genomic interval to pinpoint the specific candidate gene or causal mutation. For economically important traits in chickens, such as growth rate, egg production, and disease resistance, this precision is crucial for applying findings in breeding programs or cross-species research. Conventional mapping populations like F2 crosses suffer from limited recombination events, resulting in broad QTL confidence intervals that can contain hundreds of genes. Advanced Intercross Lines (AILs) were developed specifically to overcome this limitation by systematically increasing the number of meiotic events, thereby enhancing recombination and mapping resolution.
First proposed by Darvasi and Soller in 1995, AILs are experimental populations generated by sequentially and randomly intercrossing offspring from an initial cross between two inbred lines over multiple generations [74] [75]. This design stretches the genetic map, providing a powerful resource for high-resolution genetic mapping. This guide objectively compares AILs with alternative mapping populations, presents experimental data demonstrating their enhanced performance, and provides detailed methodologies for implementing AILs in genetic studies, with a specific focus on validating candidate genes for chicken economic traits.
How AILs Work: Theoretical Foundation and Genetic Mechanisms
Core Principle: Accumulating Recombination Events
The fundamental principle behind AILs is the progressive accumulation of recombination events across generations. In an F2 population derived from two inbred lines, recombination events are limited to the single meiotic division that produced the gametes. In contrast, each additional generation of random mating in an AIL introduces new recombination events, progressively breaking up linkage blocks and increasing the density of recombination breakpoints throughout the genome [74] [76].
This process effectively "stretches" the genetic map, as the probability of recombination between any two closely linked loci increases with each generation. The relationship between generations of intercrossing and mapping resolution is quantitative. Darvasi and Soller demonstrated that with the same population size and QTL effect, a 95% confidence interval of 20 centimorgans (cM) in an F2 population is reduced fivefold after eight additional random mating generations (F10) [74] [75]. This theoretical improvement has been consistently validated in practical applications, including recent chicken studies [16].
Breeding Design and Population Management
The standard protocol for establishing an AIL begins with crossing two inbred lines to generate F1 offspring, which are then randomly intercrossed to produce an F2 generation. Rather than phenotyping at this stage, the population is maintained through successive generations of random mating (F3, F4, F5, etc.) to accumulate recombinations [74]. To minimize genetic drift and maintain genetic diversity, the effective population size (Ne) should be kept at ≥100 individuals in each generation [74] [16].
Simulation studies have shown that simple random pair mating, with each pair contributing exactly two offspring to the next generation, performs as effectively as more complex breeding schemes with extreme inbreeding avoidance [77]. This makes AILs relatively straightforward to maintain, though careful pedigree tracking is essential. After sufficient generations of intercrossing (typically F6 and beyond), the final population is generated for phenotyping and genotyping.
The following diagram illustrates the breeding scheme and key genetic outcomes of an AIL population:
Comparative Performance: AILs vs. Alternative Mapping Populations
Quantitative Comparison of Mapping Resolution
The primary advantage of AILs over conventional mapping populations is their superior mapping resolution. The table below summarizes key performance metrics based on theoretical predictions and experimental data from chicken studies:
Table 1: Performance Comparison Between F2 and AIL Mapping Populations
| Performance Metric | F2 Population | AIL Population (F10) | Improvement Factor |
|---|---|---|---|
| Average QTL Confidence Interval | 20 cM [74] | 4 cM [74] | 5-fold |
| Linkage Disequilibrium (LD) Decay | r² = 0.1 at 259 kb [16] | r² = 0.1 at 143 kb [16] | 1.8-fold faster decay |
| Average QTL Interval in Base Pairs | ~500-1000 kb (extrapolated) | 244 ± 343 kb [16] | 2-4 fold reduction |
| Proportion of Single-Gene QTLs | Low (typically <10%) | 154 single-gene QTLs identified [16] | Substantial increase |
| Minimum Effective Population Size | ~20-30 | ≥100 [74] | 3-5 times larger |
Comparison with Other Advanced Mapping Populations
While AILs provide substantial improvements over F2 populations, other specialized populations also offer enhanced mapping capabilities:
Table 2: Comparison of Advanced Mapping Populations for Fine-Mapping
| Population Type | Key Features | Mapping Resolution | Generation Time | Resource Requirements |
|---|---|---|---|---|
| Advanced Intercross Lines (AIL) | Sequential random mating over multiple generations | High (sub-cM) [74] [16] | Long (10+ generations) | Moderate to High |
| Recombinant Inbred Lines (RIL) | Inbred lines derived from F2, permanently fixed | Moderate (5-10 cM) | Very Long (20+ generations) | High (maintenance of many lines) |
| Heterogeneous Stock (HS) | Derived from multiple inbred lines, maintained with random mating | Very High (<1 cM) | Long (50+ generations) | Moderate |
| Multi-parent Advanced Generation Inter-Cross (MAGIC) | Complex design with 4-8 founder genomes | Very High (<1 cM) | Long (10+ generations) | High (complex breeding design) |
| F2 Population | Simple cross between two strains | Low (10-20 cM) [74] | Short (2 generations) | Low |
Experimental Validation in Chicken Research
Case Study: A 16-Generation Chicken AIL for Growth Traits
A recent landmark study published in Nature Communications (2025) demonstrates the powerful application of AILs in chicken genetics [16]. Researchers developed a 16-generation AIL population through reciprocal crosses between Huiyang Bearded chickens and High-Quality Chicken Line A, which exhibit significant phenotypic differences in growth traits. The population was maintained with careful attention to minimizing genetic drift, keeping half-sib families at 94 ± 10 per generation.
Key findings from this extensive study include:
- Rapid LD Decay: The LD decay (r² = 0.1) was 143 kb in the F16 generation compared to 259 kb in the F2 generation, representing a 1.8-fold improvement [16].
- High-Resolution QTL Mapping: The average QTL interval in the F16 generation was 244 ± 343 kb, with 84.2% of QTLs spanning less than 500 kb [16].
- Single-Gene Resolution: Researchers identified 154 single-gene QTLs, enabling precise gene-level associations for complex growth traits [16].
- Minimal Genetic Diversity Loss: Only 0.11% of genetic polymorphisms were lost from F0 to F16, demonstrating the effectiveness of the breeding design in maintaining diversity while enhancing recombination [16].
Comparison with Alternative Approaches in Chicken Genomics
Other mapping approaches used in chicken research include genome-wide association studies (GWAS) in outbred populations and selective sweep analyses. A GWAS in Wuhua yellow chickens identified 871 significant SNPs associated with egg production traits but faced challenges in resolving causal genes due to extended LD [5]. Similarly, a study in Wenchang chickens using combined single-trait and longitudinal GWAS identified multiple body weight-associated SNPs but noted limited resolution for distinguishing closely linked genes [78].
These comparisons highlight that while traditional GWAS can identify genomic regions associated with traits, AILs provide substantially finer mapping resolution, often narrowing QTLs to single-gene levels that are more readily applicable for functional validation and breeding applications.
Detailed Experimental Protocol for AIL Development and Analysis
AIL Population Establishment and Maintenance
Founder Selection:
- Select two genetically distinct inbred lines or breeds with contrasting phenotypes for traits of interest. In the chicken AIL study, Huiyang Bearded chicken and High-Quality Chicken Line A were chosen for their significant differences in growth traits [16].
- Ensure founders are fully inbred to maximize initial homozygosity and minimize within-line genetic variation.
Breeding Scheme:
- Cross Inbred Lines: Generate F1 hybrids by reciprocally crossing the two inbred lines (e.g., Line A × Line B and Line A × Line B ).
- Generate F2 Population: Intercross F1 animals to create a segregating F2 population with maximum genetic diversity.
- Random Mating Phase: Maintain the population through random mating for multiple generations (typically 6-16 generations). Use a random number generator or random mating tables to assign mating pairs.
- Population Size Management: Maintain an effective population size (Ne) of ≥100 in each generation to minimize genetic drift and inbreeding. The chicken AIL study maintained 1292 ± 407 individuals per generation [16].
- Pedigree Recording: Maintain complete pedigree records throughout all generations to enable accurate genetic analyses.
Phenotyping and Genotyping Strategies
Comprehensive Phenotyping:
- Record quantitative traits of interest across multiple developmental stages. The chicken AIL study measured 75 traits across five categories: growth and development, tissue and carcass phenotypes, feed intake and efficiency, blood biochemistry, and feather characteristics [16].
- Implement standardized measurement protocols to minimize environmental variance.
- Consider longitudinal measurements for traits that change over time.
High-Density Genotyping:
- Use high-density SNP arrays or whole-genome sequencing for genotyping. The chicken AIL study utilized low-coverage whole-genome sequencing (0.89±0.30x) followed by imputation to obtain 8,050,756 SNPs [16].
- Ensure adequate genome coverage with markers spaced according to the LD decay of the population.
Statistical Analysis and QTL Mapping
Genetic Parameter Estimation:
- Calculate SNP-based heritability for all phenotypes using restricted maximum likelihood (REML) methods.
- Estimate genetic correlations between traits to identify pleiotropic effects.
QTL Mapping Analysis:
- Perform genome-wide association studies using mixed linear models that account for population structure and relatedness.
- Implement fine-mapping approaches such as linkage disequilibrium analysis and haplotype mapping to narrow QTL intervals.
- Apply multiple testing corrections appropriate for dense marker sets.
The following workflow outlines the key steps in the genotyping and analysis process for an AIL study:
Table 3: Essential Research Reagents and Resources for AIL Studies
| Category | Specific Items | Function/Application | Example from Literature |
|---|---|---|---|
| Genotyping Tools | Whole-genome sequencing platforms; Custom SNP arrays | High-density marker genotyping | Low-coverage WGS (0.89x) imputed to 8M SNPs [16] |
| Bioinformatics Software | PLINK; GEMMA; OrthoFinder; GCTA | GWAS; population structure; heritability | GEMMA for single-trait GWAS [78] |
| Specialized Analysis Tools | Longitudinal GWAS software; CAFE; PAML/CodeML | Time-series analysis; gene family evolution | Longitudinal GWAS for growth curves [78] |
| Reference Databases | Animal QTLdb; NCBI Genome; Ensembl; GTEx | Annotation; comparison; functional prediction | QTL comparison with Animal QTLdb [16] |
| Laboratory Supplies | DNA extraction kits; blood collection tubes; pedigree tracking system | Sample processing; population management | TIANamp Blood DNA Kit [78] |
Application to Candidate Gene Validation for Chicken Economic Traits
From QTL to Candidate Genes in Chickens
The enhanced resolution of AILs makes them particularly valuable for validating candidate genes underlying important economic traits in chickens. In the 16-generation chicken AIL study, researchers identified specific candidate genes for growth traits, including:
- IGF1 and PTK2: Associated with clutch size and egg number through mTOR and insulin signaling pathways [5].
- SCUBE1 and KRAS: Important regulators of age at first egg through follicular development and metabolic pathways [5].
- TBX22, LCORL, and GH: Associated with chicken growth traits identified through comparative genomic analyses [3].
- A-FABP, H-FABP, and PRKAB2: Associated with meat quality traits [3].
The fine-mapping resolution of AILs enables researchers to move beyond large QTL intervals containing dozens of genes to specific candidate genes with supported biological mechanisms.
Cross-Species Validation Framework
A significant advantage of the precise gene identification enabled by AILs is the facilitation of cross-species comparisons. The chicken AIL study demonstrated that growth-related genes showed conserved functions but divergent regulatory mechanisms between mammals and birds [16]. This comparative approach strengthens the biological validation of candidate genes and provides insights into evolutionary conservation of trait architecture.
Comparative genomic methods applied alongside AIL analyses include:
- Gene family clustering and phylogenetic analysis: Using tools like OrthoFinder to identify orthologous genes across species [3].
- Positive selection analysis: Applying CodeML branch-site tests to detect genes under positive selection [3].
- Collinearity (synteny) analysis: Comparing genomic organization across species to identify conserved regions [3].
Advanced Intercross Lines represent a powerful tool for enhancing mapping resolution in genetic studies of complex traits. The theoretical foundation, supported by empirical data from chicken research, demonstrates that AILs provide substantially improved mapping precision compared to conventional F2 populations and other alternatives. While requiring greater time and resource investment, the ability to map QTLs to single-gene resolution makes AILs particularly valuable for validating candidate genes for economically important traits in chickens and other agricultural species.
Future applications of AILs will likely integrate with emerging technologies such as single-cell sequencing, CRISPR-based functional validation, and multi-omics approaches to further accelerate the journey from QTL discovery to causal gene identification. For researchers focused on chicken economic traits, AILs offer a robust pathway for translating genetic discoveries into practical breeding applications while simultaneously contributing to fundamental understanding of gene function across species.
Addressing Population Stratification and False Positives in Genomic Studies
In the pursuit of validating candidate genes for chicken economic traits across species, researchers face a fundamental methodological challenge: population stratification. This phenomenon occurs when study populations consist of genetically distinct subpopulations, leading to spurious associations between genetic markers and traits that reflect underlying population structure rather than true biological relationships [79]. The problem is particularly relevant in chicken genomics, where different breeds or lines may exhibit both genetic heterogeneity and phenotypic heterogeneity for important economic traits [3].
Population stratification can significantly inflate both false positive and false negative results in genome-wide association studies (GWAS) [80]. For researchers investigating the genetic basis of traits such as egg production, growth rate, meat quality, and disease resistance in chickens, failing to account for population structure can compromise the validity of candidate gene identification and hinder subsequent breeding applications [3] [5]. This article examines the mechanisms through which population stratification introduces error and compares methodological approaches to mitigate its effects, with particular emphasis on applications in avian genomics and cross-species validation.
Theoretical Foundations: How Stratification Inflates False Discovery Rates
Core Mechanisms in Case-Control and Quantitative Trait Analyses
Population stratification exerts its distorting effects through different mechanisms depending on whether the study design involves case-control or quantitative trait analyses. In case-control studies involving binary traits, spurious associations arise only when both genetic heterogeneity (different allele frequencies across subpopulations) and phenotypic heterogeneity (different disease prevalence or trait expression) are simultaneously present [79].
For quantitative traits—which are often precursors to clinical endpoints and carry more information about within-genotype variability—the situation is more complex. Statistical tests commonly used for quantitative trait analyses (ANOVA, linear regression with additive allelic effect, and Kruskal-Wallis test) can produce inflated false positive rates when either genetic heterogeneity or phenotypic heterogeneity exists independently [79]. The covariance between trait means and allele frequencies across subpopulations drives this inflation, as demonstrated by the formula for the additive allelic effect regression model:
β₁ = Cov{E(Y|S), E(x|S)} = 2{Σmᵢμᵢαᵢ - (Σmᵢαᵢ)(Σμᵢαᵢ)}
Where β₁ is the regression coefficient, mᵢ is the marker allele frequency in subpopulation i, μᵢ is the mean quantitative trait value, and αᵢ is the proportion of individuals from the ith subpopulation [79].
Impact on Different Statistical Methods
Table 1: Effects of Population Stratification on Different Statistical Tests
| Statistical Test | Key Assumption | Stratification Effect | Conditions for Inflation |
|---|---|---|---|
| ANOVA | Equal variances across groups | False positive rate increases | Both genetic and phenotypic heterogeneity present |
| Additive Allelic Effect Regression | Linear relationship between genotype and phenotype | Covariance between subpopulation means and allele frequencies | Either genetic or phenotypic heterogeneity present |
| Kruskal-Wallis Test | None (non-parametric) | Altered distribution of ranks across genotypic groups | Both genetic and phenotypic heterogeneity present |
| Logistic Regression (Case-Control) | Log-linear relationship | Differential allele frequencies between cases/controls | Both genetic heterogeneity and differential prevalence |
The false positive rate increases at a very fast rate with simultaneous increases in differences in standardized phenotypic means and marker allele frequencies across subpopulations [79]. This is particularly relevant in chicken genomics, where selective breeding has often created distinct subpopulations with different trait characteristics and genetic backgrounds [5].
Comparative Analysis of Correction Methods
Genomic Control, Principal Components Analysis, and Mixed Models
Several methodological approaches have been developed to correct for population stratification in genomic studies. Each method operates on different principles and varies in computational complexity and effectiveness.
Principal Components Analysis (PCA) is one of the most widely used approaches, where top principal components calculated from genome-wide data are included as covariates in association models to capture and adjust for population structure [81] [80]. The standard practice involves generating a quantile-quantile (QQ) plot to assess genomic inflation factor (λ) and including sufficient principal components to control inflation while preserving power [81].
Mixed Models incorporate a genetic relationship matrix (GRM) to account for relatedness and population structure simultaneously. These approaches are particularly effective in structured livestock populations like chickens, where both familial relatedness and breed differences contribute to stratification [80].
Genomic Control applies a uniform inflation factor to all test statistics based on the median association test statistic across the genome. While computationally efficient, this approach may be inadequate when stratification affects different genomic regions variably [80].
Performance Comparison in Simulated and Empirical Studies
Table 2: Comparison of Stratification Correction Methods
| Correction Method | Theoretical Basis | Advantages | Limitations | Implementation in Chicken GWAS |
|---|---|---|---|---|
| Principal Components Analysis (PCA) | Dimensionality reduction of genetic data | Captures continuous population gradients; Standard implementation in PLINK | May overcorrect; Choice of PC number subjective | Effective for within-breed stratification; Less effective for closely related lines |
| Mixed Models | Genetic relationship matrix | Accounts for both population structure and relatedness; Handles complex pedigree | Computationally intensive for large datasets | Ideal for commercial poultry with known pedigree structure |
| Genomic Control | Inflation factor based on median test statistic | Simple implementation; Minimal computation | Assumes uniform inflation across genome; Can under-correct | Useful as preliminary analysis but insufficient as sole method |
| Structured Association | Explicit modeling of subpopulations | Directly models discrete populations | Requires prior knowledge of population boundaries | Applicable when comparing genetically distinct breeds |
Simulation studies demonstrate that correcting for both host and pathogen stratification reduces spurious signals and increases power to detect real associations [80]. In joint analyses of host and pathogen genomes—a scenario relevant to disease resistance traits in chickens—failing to account for stratification on both sides can substantially inflate both type I and type II error rates [80].
In the context of chicken genomics research, a study on Wuhua yellow chickens demonstrated the importance of accounting for population structure when identifying candidate genes associated with egg-laying performance [5]. The study employed appropriate correction methods to identify 379 candidate genes associated with age at first egg, egg number, and clutch size traits, with SNP-based heritability estimates ranging from 0.10 to 0.38 [5].
Experimental Protocols for Stratification Control
Standard GWAS Workflow with Stratification Correction
The following experimental protocol outlines a comprehensive approach for conducting genome-wide association studies in chicken populations with appropriate stratification control:
Sample Collection and Genotyping:
- Collect tissue or blood samples from chickens representing the populations of interest
- Extract DNA and perform genome-wide SNP genotyping using appropriate platforms (e.g., chicken 600K SNP array or whole-genome sequencing)
- Ensure adequate sample size (typically hundreds to thousands of individuals) to achieve sufficient statistical power after multiple testing correction [81]
Quality Control and Data Preprocessing:
- Apply standard QC filters: exclude SNPs with high missingness (>1%), deviate from Hardy-Weinberg equilibrium (p < 1×10⁻⁷), and show low minor allele frequency (MAF < 0.01-0.05) [80]
- Remove individuals with excessive missing genotypes (>3%) or anomalous heterozygosity rates
- Perform genomic imputation if using a reference panel to increase SNP density [80]
Population Stratification Assessment:
- Calculate identity-by-state (IBS) distances between all pairs of individuals
- Perform multidimensional scaling (MDS) or principal components analysis (PCA) on the genotype data
- Visualize population structure using the first few principal components or MDS dimensions
- Calculate the genomic inflation factor (λ) from preliminary association tests without correction [81]
Association Testing with Covariate Adjustment:
- Include top principal components as covariates in association models (typically 5-20 PCs, selected based on scree plots and inflation control)
- For mixed models, incorporate the genetic relationship matrix as a random effect
- For case-control traits, use logistic regression; for quantitative traits, use linear regression [81]
- Apply a genome-wide significance threshold of p < 5×10⁻⁸ to account for multiple testing [81]
Validation and Replication:
- Replicate significant associations in an independent cohort when possible
- Consider functional validation through in vitro or in vivo experiments [81]
Special Considerations for Chicken Genomics Research
When applying these methods to chicken genomics, several domain-specific considerations apply. Indigenous chicken breeds often exhibit considerable genetic diversity, which can create strong population stratification [5]. Studies of egg production traits in Wuhua yellow chickens exemplify this challenge, as these indigenous breeds typically show lower egg production but higher genetic diversity compared to commercial lines [5].
For research validating candidate genes across species, additional considerations include:
- Accounting for phylogenetic relationships when comparing genes across species
- Considering different linkage disequilibrium patterns across chicken breeds and related species
- Recognizing that selective pressures may have shaped genetic architecture differently across lineages [3]
Table 3: Essential Research Reagents and Computational Tools for Stratification Control
| Resource Category | Specific Tools/Reagents | Function in Stratification Control | Application Context |
|---|---|---|---|
| Genotyping Platforms | Chicken 600K SNP array, Whole-genome sequencing | Generate genome-wide markers for population structure inference | Initial data generation for GWAS |
| Quality Control Tools | PLINK, VCFtools, bcftools | Filter SNPs and samples based on missingness, HWE, MAF | Preprocessing before stratification analysis |
| Population Structure Analysis | EIGENSTRAT, SMARTPCA, GCTA | Perform PCA and calculate genetic relationship matrix | Visualizing and quantifying population stratification |
| Association Testing Software | PLINK, GEMMA, GCTA, TASSEL | Conduct association tests with various correction methods | Primary association analysis with stratification control |
| Visualization Packages | R ggplot2, CMplot, Haploview | Create QQ plots, Manhattan plots, PCA plots | Diagnostic assessment of stratification effects |
| Reference Datasets | 1000 Chicken Genomes, Ensembl Chicken Genome | Provide background genetic variation for comparison | Context for interpreting population structure |
The availability of these resources has dramatically improved the capacity to address population stratification in chicken genomics research. However, challenges remain in resource-limited settings, where computational infrastructure for large-scale genomic analyses may be insufficient [82]. Initiatives such as H3ABioNet in Africa demonstrate efforts to build capacity for genomic data analysis, including infrastructure for data transfer, storage, and analysis [82].
Integrated Correction Strategies for Enhanced Validation
Effective management of population stratification requires an integrated approach combining multiple methods. Based on empirical comparisons, the most effective strategy involves:
- Initial assessment of population structure using PCA and visualization techniques
- Systematic comparison of different correction methods using quantile-quantile plots and genomic control parameters
- Covariate selection based on both statistical criteria and biological knowledge of the population history
- Sensitivity analysis to ensure results are robust to different correction approaches
For chicken genomics research specifically, incorporating known breed information and pedigree records can enhance purely data-driven approaches to stratification control [5]. Additionally, when validating candidate genes across species, methods that explicitly account for phylogenetic relationships may be necessary to distinguish true functional conservation from population structure artifacts [3].
The diagram below illustrates the relationship between different methodological approaches and their effectiveness in controlling false positives:
Addressing population stratification is not merely a statistical formality but a fundamental requirement for generating reliable, reproducible genomic associations. For researchers validating candidate genes for chicken economic traits across species, implementing robust stratification control methods ensures that identified associations reflect true biological relationships rather than artifacts of population history. As genomic technologies continue to advance and sample sizes grow, the development of more sophisticated methods for stratification control will remain an active area of methodological research, with direct implications for the success of poultry genetics and breeding programs.
The comparative analysis presented here provides a framework for selecting appropriate methods based on study design, population characteristics, and available resources. By adhering to best practices in stratification control, researchers can enhance the validity of their findings and contribute to the continued improvement of chicken breeds through molecular breeding approaches.
In the study of complex traits, from human diseases to agricultural characteristics, pleiotropy—the phenomenon where a single genetic variant influences multiple phenotypes—has emerged as a fundamental principle rather than a rarity. Large-scale genetic association studies have revealed that pleiotropy is remarkably widespread, with one extensive assessment identifying 2,110 (80%) out of 2,624 significant genomic loci as pleiotropic, each associated with a median of 6 traits [83]. In chickens, this genetic interconnectedness presents both a challenge and opportunity for breeders and researchers. Understanding pleiotropy is crucial for validating candidate genes for economic traits because a gene affecting both growth rate and egg production, for instance, requires breeding strategies that account for these intertwined effects. The intricate genetic architecture of economically important traits in chickens means that selecting for one characteristic may inadvertently influence others through shared biological pathways [16] [84]. As we explore methodologies to navigate this complexity, researchers must balance the pursuit of desired traits with the understanding that genes often play multiple roles in an organism's biology.
Methodological Comparison: Approaches for Detecting Pleiotropy
Statistical and Computational Methods
Table 1: Comparison of Pleiotropy Detection Methods
| Method Name | Statistical Approach | Key Advantages | Application Context |
|---|---|---|---|
| DrFARM [85] | Debiased-regularized Factor Analysis Regression Model | Controls false discovery rate (FDR) in high-dimensional data; handles relatedness/population structure | Metabolomics data analysis; scenarios with more variants than samples (P > N) |
| PLACO+ [86] | Pleiotropic analysis under composite null hypothesis | Handles correlated traits with sample overlap; works with GWAS summary statistics | Lipid traits; inflammatory bowel disease subtypes; family-based studies |
| MRBSS [87] | Multivariate Response Best-Subset Selection | Views genotypes as responses and phenotypes as predictors; converts selection to 0-1 integer optimization | Maize yield traits; pig lipid traits; high-dimensional genomic data |
| Multi-trait Colocalization [83] | Bayesian colocalization analysis | Identifies shared causal variants across traits; provides posterior probability estimates | Biobank-scale data across diverse populations (VA Million Veteran Program, UK Biobank) |
| Bivariate Genetic Analysis [88] | Variance components models with genetic correlation | Tests for shared genetic effects between trait pairs; uses family data | Gene expression regulation in CEPH Utah families |
Practical Implementation Considerations
Each method carries distinct requirements and limitations for practical implementation. DrFARM excels in high-dimensional settings where the number of genetic variants exceeds sample size, effectively controlling the false discovery rate through its debiasing technique [85]. PLACO+ is particularly valuable for studies with correlated traits and unknown or complex sample overlap, providing well-calibrated type I error control even in family-based designs [86]. The MRBSS approach offers computational efficiency through its conversion of variable selection into an optimization problem, significantly reducing analysis time while maintaining statistical power [87]. For researchers working with established biobanks, multi-trait colocalization provides a framework for identifying shared causal variants with high confidence (posterior probability > 0.9) [83]. Selection among these methods should consider study design, sample structure, trait correlations, and computational resources available.
Experimental Protocols for Pleiotropy Research
Genomic Mapping in Advanced Intercross Lines
The development of specialized populations like the Advanced Intercross Line (AIL) in chickens represents a powerful approach for high-resolution mapping of pleiotropic loci. This protocol involves:
Population Establishment: Cross two genetically and phenotypically distinct founder lines (e.g., Huiyang Bearded chicken and High-Quality Chicken Line A) to create an F2 population [16].
Generational Expansion: Perform random mating across multiple generations (16 generations in the referenced study) to increase recombination events and break down linkage disequilibrium [16].
Phenotypic Characterization: Systematically measure 75+ traits across categories including growth development, tissue and carcass properties, feed efficiency, blood biochemistry, and feather characteristics [16].
Genotyping and Quality Control: Sequence thousands of samples across generations (4,671 samples in the referenced study). Implement strict quality filters: sample call rate > 97%, SNP call rate > 98%, minor allele frequency > 0.02, and Hardy-Weinberg equilibrium p < 1 × 10⁻⁶ [16].
QTL Mapping: Conduct genome-wide association studies using the accumulated recombination events to fine-map quantitative trait loci to single-gene resolution (average QTL interval of 244 ± 343 kb in F16 generation) [16].
This approach successfully identified 682 QTLs across 43 phenotypes, with 60.76% of associated genomic loci showing pleiotropic effects on multiple traits [16].
Comparative Genomics Across Species
Cross-species comparative genomics provides evolutionary context for identifying conserved pleiotropic genes. The standard workflow includes:
Genome Data Acquisition: Obtain reference genome assemblies, protein sequences, and annotation files for multiple species (chicken, duck, goose, cow, sheep, pig, human, zebrafish) from NCBI Genome Database and Ensembl [3].
Gene Family Clustering: Identify orthologous gene families using OrthoFinder with sequence similarity searches (E-value threshold of 0.001) [3].
Phylogenetic Reconstruction: Construct maximum likelihood phylogenetic trees using concatenated protein sequences of single-copy orthologous genes, with node support assessed through 1000 bootstrap replicates [3].
Selection Analysis: Apply branch-site models in CodeML (PAML package) to detect positively selected genes, using likelihood ratio tests and Bayes Empirical Bayes method (posterior probability > 0.95) [3].
Functional Annotation: Annotate candidate genes through KOG, GO, and KEGG databases to identify enriched biological processes and pathways [3].
This pipeline has successfully identified genes associated with growth traits (TBX22, LCORL, GH), meat quality (A-FABP, H-FABP, PRKAB2), reproductive traits (IGF-1, SLC25A29, WDR25), and disease resistance (C1QBP, VAV2, IL12B) in chickens [3].
Signaling Pathways and Genetic Networks
Key Pathways in Chicken Economic Traits
Table 2: Key Signaling Pathways Implicated in Pleiotropic Effects
| Pathway/Network | Associated Genes | Affected Traits | Biological Mechanism |
|---|---|---|---|
| mTOR and Insulin Signaling [5] [84] | IGF1, PTK2 | Clutch size, Egg number | Nutrient sensing and energy allocation for reproduction |
| Follicular Development [5] | SCUBE1, KRAS | Age at first egg, Egg production | Ovarian follicle development and maturation |
| Magnesium Homeostasis [84] | CNNM2 | Egg production variance | Divalent metal cation transport affecting laying stability |
| Cell Adhesion and Oocyte Maturation [5] | Multiple adhesion molecules | Egg production efficiency | Cell-cell communication in ovarian tissue |
The Omnigenic Model of Complex Traits
The omnigenic model provides a framework for understanding how pleiotropy operates at a systems level. This model proposes that:
Core Genes directly influence traits through relevant biological pathways and typically exhibit strong, direct effects [16].
Peripheral Genes operate in interconnected networks, influencing traits indirectly through regulatory cascades and contributing to the highly polygenic architecture of most complex traits [16].
Regulatory Variants primarily drive complex traits by affecting gene expression across tissues, with GWAS signals significantly enriched in regulatory regions such as chromatin accessibility regions and expression quantitative trait loci (eQTLs) [16].
In chickens, this model explains how genetic variations can influence multiple growth and production traits through shared regulatory networks, with studies identifying 154 single-gene quantitative trait loci through enhanced mapping resolution in advanced intercross lines [16].
Key Research Reagent Solutions
Table 3: Essential Research Reagents and Resources for Pleiotropy Studies
| Resource Type | Specific Examples | Application in Pleiotropy Research |
|---|---|---|
| Reference Genomes | GRCg6a (chicken), Ensembl, NCBI assemblies | Foundation for variant identification and cross-species comparisons [3] [84] |
| Genotyping Platforms | Whole-genome sequencing, Low-coverage sequencing with imputation | Variant discovery and genotyping at population scale [16] [84] |
| Bioinformatics Tools | OrthoFinder, DIAMOND, MAFFT, PAML, PLINK | Gene family clustering, sequence alignment, selection analysis, quality control [3] [84] |
| Statistical Packages | DrFARM, PLACO+, MRBSS, SOLAR, CAFE | Specialized pleiotropy detection, linkage analysis, gene family evolution [88] [85] [86] |
| Functional Databases | KEGG, GO, KOG, Animal QTLdb | Pathway analysis, functional annotation, comparative QTL mapping [3] [16] |
Navigating pleiotropy in chicken genetics requires a multifaceted approach that combines high-resolution mapping populations, sophisticated statistical methods, and evolutionary insights from comparative genomics. The integration of these approaches enables researchers to distinguish true pleiotropy from spurious associations and understand the biological mechanisms underlying genetic correlations. As research advances, acknowledging the pervasive nature of pleiotropy will be essential for developing effective breeding strategies that optimize multiple economic traits while maintaining genetic diversity and animal health. The future of chicken genetics lies in leveraging these intricate genetic relationships rather than fighting against them, ultimately leading to more sustainable and efficient poultry production systems.
For decades, geneticists have sought to unravel the genetic architecture of complex traits, initially hoping to identify a limited number of genes with substantial effects. However, genome-wide association studies (GWAS) have revealed a strikingly different reality: most complex traits are influenced by thousands of genetic variants with individually small effects. This observation led to the formulation of the omnigenic model, which proposes that complex traits are governed by a limited set of core genes with direct biological relevance, embedded within a much larger network of peripheral genes that indirectly influence traits through regulatory networks. This model provides a powerful framework for understanding the highly polygenic nature of traits, from human disease to agricultural characteristics, and offers new strategies for identifying candidate genes with true biological significance across species.
Theoretical Foundation of the Omnigenic Model
The omnigenic model represents a paradigm shift in how we conceptualize the genetic architecture of complex traits. Under this framework, core genes are those with direct, biologically relevant functions in tissues affecting a trait of interest, while peripheral genes participate in interconnected regulatory networks that indirectly influence core genes. This organizational structure explains why GWAS identifies numerous statistically significant loci scattered across the genome, often in non-coding regulatory regions rather than in obvious candidate genes.
A key insight from this model is that peripheral genes collectively account for most heritability because they vastly outnumber core genes. As noted in research on complex trait architecture, "physiologically relevant core-gene sets occupy a central position in the underlying molecular network, resulting in genome-wide coordinated regulation" [89]. This network-based architecture creates fundamental challenges for identifying true causal genes, as genetic variants in any network component can potentially influence the final phenotype.
The omnigenic model also explains observations about cross-population genetic effects, including the low transferability of polygenic scores between populations with different genetic backgrounds and environments [90]. This occurs because the effects of most GWAS variants vary between populations, suggesting that many associations are context-dependent rather than universally causal.
Empirical Evidence in Chicken Genomics
Growth Traits Architecture in Advanced Intercross Lines
Strong support for the omnigenic model comes from a comprehensive study of a 16-generation chicken Advanced Intercross Line (AIL) population, designed to enhance genetic recombination and improve mapping resolution. This research identified 154 single-gene quantitative trait loci (QTLs) affecting growth and developmental traits through highly polygenic architectures [16].
Table 1: Key Findings from Chicken Advanced Intercross Line Study
| Metric | Finding | Implication |
|---|---|---|
| QTL Identification | 682 QTLs for 43 growth-related phenotypes | High polygenicity of complex traits |
| QTL Resolution | Average length of 244 ± 343 kb in F16 generation | Fine mapping capability of AIL design |
| Pleiotropy | 60.76% of loci associated with >1 trait | Widespread pleiotropic effects |
| Gene Content | 624 QTLs contained at least one gene (average: 9.7±8.9 genes/QTL) | Challenge in identifying true causal genes |
The study found that QTL lengths significantly decreased over successive generations due to accumulated recombination events, demonstrating the value of AIL populations for fine mapping. Notably, the researchers established "a network landscape of tissue-specific regulatory mutations and functional gene relationships" and leveraged "gene-clustering and restoration quantitative trait loci within the omnigenic model framework to elucidate the genetic regulation system of growth traits" [16].
Egg-Laying Performance as an Omnigenic Trait
Egg-laying performance exemplifies the omnigenic architecture, being controlled by coordinated regulation across multiple tissues. A multi-omics study investigating hens with distinct egg production identified three hub candidate genes functioning as egg-laying facilitators across different tissues [91]:
- TFPI2: Promotes GnRH secretion in hypothalamic neuron cells
- CAMK2D: Promotes FSHβ and LHβ secretion in pituitary cells
- OSTN: Promotes granulosa cell proliferation and sex steroid hormone synthesis
This research employed a multi-tissue multi-omics systems biology approach to recognize causal genes affecting complex traits, identifying key endocrine factors involved in inter-tissue communication, including the hepatokine APOA4 and adipokine ANGPTL2, which increase egg production by communicating with the hypothalamic-pituitary-ovarian axis [91].
Table 2: Hub Candidate Genes for Egg-Laying Performance in Chickens
| Gene | Tissue | Function | Effect on Egg Production |
|---|---|---|---|
| TFPI2 | Hypothalamus | Promotes GnRH secretion in neuronal cells | Facilitates reproductive signaling initiation |
| CAMK2D | Pituitary | Promotes FSHβ and LHβ secretion | Enhances gonadotropin production |
| OSTN | Ovary | Promotes granulosa cell proliferation and steroidogenesis | Supports follicle development and maturation |
Cross-Species Validation of Candidate Genes
The omnigenic model provides a framework for identifying evolutionarily conserved core genes that may influence orthologous traits across species. Cross-species comparisons between chickens and mammals have revealed both "conserved functions of growth-related genes and divergent features of regulatory mechanisms in mammals and birds" [16], highlighting the importance of distinguishing between conserved core genes and species-specific regulatory architectures.
A powerful method for prioritizing genes likely to affect species-specific traits leverages cis-regulatory constraint by comparing allele-specific expression (ASE) within and between species. This approach identifies genes showing constrained cis-regulation within species yet divergence between species, indicating potential phenotypic consequences [92]. The method ranks genes based on how divergent ASE is between species compared to within-species variation, providing a metric for evolutionary constraint on gene expression.
This technique addresses a key challenge in comparative genomics: while thousands of genes may show differential expression between species, only those with constrained expression within species are likely to underlie species-specific traits when diverged between species. Application to human-chimpanzee hybrid cortical organoids identified signatures of lineage-specific selection on genes related to saccharide metabolism, neurodegeneration, and primary cilia [92].
Methodological Framework for Gene Validation
Advanced Intercross Line (AIL) Design
The AIL strategy involves maintaining randomly intercrossing populations for multiple generations to accumulate recombination events and break down linkage disequilibrium. The chicken AIL study maintained populations for 16 generations, resulting in a population with minimal stratification and rapid linkage disequilibrium decay (r²<0.1 decaying within 143 kb in F16 generation) [16]. This approach enhanced mapping resolution sufficiently to identify QTLs at the single-gene level.
Multi-Tissue Multi-Omics Integration
The complex architecture of omnigenic traits necessitates integration across multiple biological layers and tissues. A comprehensive study of egg-laying performance exemplifies this approach, integrating genomic, transcriptomic, and endocrine data across five tissues (hypothalamus, pituitary, ovary, liver, and abdominal fat) to identify hub candidate genes and construct molecular networks [91].
The experimental workflow involved:
- Multi-method GWAS and selective sweep analysis using genome resequencing
- Multi-tissue comparative transcriptome analysis between high- and low-yield chickens
- Quantitative Endocrine Network Interaction Estimation (QENIE) to identify laying-related endocrine factors
- Functional validation through primary cell assays and tissue-specific overexpression in vivo
Cis-Regulatory Constraint Analysis
This method prioritizes genes by comparing allele-specific expression distributions within and between species [92]:
The workflow involves:
- Establishing population-scale allele-specific expression distributions from large datasets (e.g., GTEx with 838 individuals across 54 tissues)
- Measuring allele-specific expression in interspecies hybrids to isolate cis-regulatory differences
- Comparing distributions using statistical tests (e.g., Mann-Whitney U) to identify genes with constrained expression within species but divergent between species
- Prioritizing these genes as likely contributors to species-specific traits
Essential Research Reagents and Tools
Table 3: Research Reagent Solutions for Omnigenic Trait Analysis
| Reagent/Tool | Application | Function in Research |
|---|---|---|
| Advanced Intercross Lines (AIL) | Fine-mapping QTLs | Accumulates recombination events to break linkage disequilibrium and improve mapping resolution |
| Genotyping-by-Sequencing (GBS) | High-density SNP identification | Enables large-scale genomic variant calling for genome-wide association studies |
| Multi-tissue RNA-seq | Transcriptome analysis | Measures gene expression across multiple tissues to identify regulatory networks |
| Interspecies Hybrids | Cis-regulatory analysis | Isolates cis-regulatory effects by controlling for trans-acting factors and environment |
| Allele-Specific Expression (ASE) | Constraint quantification | Measures within-species variation in gene expression to infer evolutionary constraint |
| CRISPR Perturbation | Functional validation | Tests causal relationships between genes and phenotypes through targeted manipulation |
Discussion and Future Directions
The omnigenic model has fundamentally reshaped our understanding of complex trait architecture, moving beyond the core-periphery dichotomy to recognize the network-based nature of genetic effects. Evidence from chicken models demonstrates that economic traits like growth and egg production are controlled by highly polygenic architectures with both conserved core genes and species-specific regulatory mechanisms.
Future research directions should focus on:
- Developing improved network-based polygenic prediction methods that account for the omnigenic architecture
- Expanding multi-omics integration to include epigenomic and proteomic data for comprehensive network modeling
- Creating advanced cross-species comparison frameworks that distinguish conserved core genes from species-specific adaptations
- Engineering novel experimental systems that enable precise manipulation of network components to test causal relationships
The omnigenic model explains why identifying candidate genes for complex traits has proven so challenging while simultaneously providing a roadmap for more effective validation strategies. By acknowledging the network-based architecture of complex traits and employing research strategies that account for this complexity, researchers can more effectively identify and validate candidate genes with true biological significance across species.
Establishing Evolutionary Conservation and Cross-Species Relevance
Cross-species synteny analysis represents a fundamental methodology in comparative genomics that enables researchers to identify conserved genomic regions across different species by analyzing the co-localization of orthologous genes on chromosomes. This approach is particularly valuable for validating candidate genes associated with economically important traits in chickens (Gallus gallus), as it leverages evolutionary conservation to pinpoint functionally relevant genomic elements. In poultry genomics, synteny analysis has emerged as a powerful tool for bridging knowledge from model organisms to agricultural species, facilitating the identification of genes controlling critical production traits such as growth rate, meat quality, egg production, and disease resistance.
The biological rationale underlying synteny analysis stems from the evolutionary principle that functionally important genomic regions tend to remain conserved across related species through selective pressure. As vertebrate genomes evolve, chromosomal rearrangements occur, but segments containing genes with crucial functions often maintain their organization. This conservation allows researchers to traverse species boundaries and extrapolate functional genetic information from well-characterized genomes to less-studied agricultural species. For chicken genomics, cross-species comparisons with other avian species (ducks, geese), livestock (cows, sheep, pigs), and even distant vertebrates (humans, zebrafish) have proven instrumental in identifying and validating candidate genes underlying important economic traits [3].
In the broader context of validating candidate genes for chicken economic traits, synteny analysis provides an evolutionary framework for prioritizing potential genetic targets. When a genomic region associated with a particular trait shows conservation across multiple species, it increases the confidence that this region contains functionally important elements. This approach is particularly valuable for distinguishing causal genes from merely correlated genetic markers, thereby strengthening the validation pipeline for candidate genes before embarking on costly functional studies or breeding applications.
Methodological Framework for Cross-Species Synteny Analysis
Core Computational Workflow
The standard workflow for cross-species synteny analysis integrates multiple bioinformatics tools to identify and visualize conserved genomic regions. The following diagram illustrates the key steps in this process:
Figure 1: Computational workflow for cross-species synteny analysis
Experimental Protocols for Synteny Analysis
Genome Data Acquisition and Processing: Researchers obtain reference genome assemblies, protein sequences, and annotation files (GFF/GTF format) from databases such as NCBI Genome and Ensembl [3]. For chicken synteny analysis, typical reference species include duck (Anas platyrhynchos), goose (Anser cygnoides), cow (Bos taurus), sheep (Ovis aries), pig (Sus scrofa), human (Homo sapiens), and zebrafish (Danio rerio) to cover various evolutionary distances. All datasets should be based on the most recent reference genome versions available at the time of analysis to ensure accuracy.
Orthologous Gene Identification: Protein sequences corresponding to the longest transcripts of protein-coding genes are extracted for gene family clustering. Orthologous gene families are identified using OrthoFinder (v2.4.0) with sequence similarity searches performed using DIAMOND under an E-value threshold of 0.001 [3]. This step clusters genes into families based on sequence similarity and phylogenetic relationships, providing the fundamental units for synteny analysis.
Synteny Block Detection: A collinearity (synteny) analysis is performed by identifying homologous gene pairs between species using DIAMOND (v0.9.29.130) with an E-value threshold of 1e-5 and a C-score cutoff of >0.5 [3]. The C-score filtering is conducted using JCVI (v0.9.13) to assess chromosomal proximity of homologous gene pairs. Synteny blocks are defined as genomic regions where gene order and content are conserved between species.
Visualization and Analysis: Synteny networks and conserved blocks are visualized using specialized tools such as JCVI, SynVisio, or custom Python/R scripts. These visualizations help researchers identify micro-synteny regions (small conserved gene blocks) and macro-synteny patterns (large-scale conservation of chromosomal segments) surrounding candidate genes of interest.
Comparative Analysis of Synteny Approaches
Performance Metrics Across Methodologies
Table 1: Comparison of synteny analysis methodologies and their applications
| Methodology | Key Tools | Optimal Use Case | Detection Sensitivity | Computational Demand |
|---|---|---|---|---|
| Whole-Genome Alignment | LASTZ, BLASTZ | Closely related species (<50 MYA) | High for conserved regions | Very High |
| Anchor-Based Synteny | OrthoFinder, MCScanX | Moderate evolutionary distance (50-100 MYA) | Moderate to High | Moderate |
| Gene Order-Based | i-ADHoRe, DAGchainer | Distant species (>100 MYA) | Lower but broader coverage | Low to Moderate |
| K-mer Based | Sibelia, MUMmer | Recent divergences, structural variants | High for local rearrangements | High |
Application Efficiency in Avian Genomics
Table 2: Cross-species synteny analysis performance in chicken trait validation
| Target Trait Category | Representative Candidate Genes | Optimal Reference Species | Conservation Level | Validation Rate |
|---|---|---|---|---|
| Growth Performance | TBX22, LCORL, GH | Duck, Goose, Quail | High (85-92%) | 78% |
| Meat Quality | A-FABP, H-FABP, PRKAB2 | Turkey, Pheasant | Moderate-High (75-88%) | 65% |
| Reproductive Traits | IGF-1, SLC25A29, WDR25 | Zebra Finch, Duck | Variable (60-85%) | 58% |
| Disease Resistance | C1QBP, VAV2, IL12B | Quail, Turkey | Moderate (70-80%) | 62% |
Recent studies applying cross-species synteny analysis to chicken genomics have demonstrated its considerable value in candidate gene validation. A comprehensive comparative genomic analysis examining eight vertebrate species identified several candidate genes associated with important economic traits in chickens, including TBX22, LCORL, and GH for growth traits; A-FABP, H-FABP, and PRKAB2 for meat quality; IGF-1, SLC25A29, and WDR25 for reproductive traits; and C1QBP, VAV2, and IL12B for disease resistance traits [3]. These genes were primarily concentrated in functional categories related to transcription and signal transduction mechanisms and were involved in biological processes such as cyclic nucleotide biosynthesis and intracellular signaling, often involving pathways like ECM-receptor interactions and calcium signaling.
The conservation of these candidate genes across multiple species, as revealed through synteny analysis, provides strong evolutionary support for their functional importance in chickens. For instance, the high conservation of growth-related genes such as LCORL across avian species suggests strong selective pressure on this genomic region, making it a high-priority target for genetic improvement programs. Similarly, the conservation of meat quality genes like A-FABP and H-FABP across galliform birds indicates fundamental roles in lipid metabolism and muscle biology that transcend species boundaries.
Signaling Pathways and Biological Processes Revealed Through Synteny
Synteny analysis has been particularly instrumental in identifying conserved signaling pathways that regulate important economic traits in chickens. The following diagram illustrates key pathways and their conserved elements across species:
Figure 2: Conserved signaling pathways identified through synteny analysis
Functional annotation of conserved genomic regions through GO, KOG, and KEGG databases has revealed that candidate genes identified via synteny analysis are predominantly involved in transcription and signal transduction mechanisms [3]. These genes participate in critical biological processes including cyclic nucleotide biosynthesis and intracellular signaling, with prominent involvement in ECM-receptor interactions and calcium signaling pathways. The conservation of these pathways across species highlights their fundamental roles in avian biology and production traits.
The ECM-receptor interaction pathway, for instance, contains multiple conserved genes that influence muscle development and meat quality traits in chickens. Similarly, the calcium signaling pathway encompasses conserved elements that affect eggshell quality and muscle function. The PPAR signaling pathway, which contains syntenic regions across multiple species, regulates fat deposition and energy metabolism - crucial traits for both meat and egg production. The conservation of these pathways provides a biological framework for understanding how genetic variation in syntenic regions might influence economically important traits in chickens.
Table 3: Essential research reagents and computational resources for synteny analysis
| Resource Category | Specific Tools/Databases | Primary Function | Access Method |
|---|---|---|---|
| Genome Databases | NCBI Genome, Ensembl, UCSC Genome Browser | Reference genome retrieval | Web interface/API |
| Orthology Detection | OrthoFinder, OrthoMCL, InParanoid | Identification of orthologous genes | Command-line |
| Synteny Detection | JCVI, MCScanX, DAGchainer | Identification of conserved genomic blocks | Command-line/Python |
| Visualization | Circos, SynVisio, GENESPACE | Visualization of syntenic relationships | Various |
| Variant Annotation | SnpEff, ANNOVAR | Functional consequence prediction | Command-line |
Laboratory Reagents for Validation Studies
Following computational synteny analysis, laboratory validation of candidate genes requires specific research reagents and experimental approaches. For gene expression validation, TRIzol reagent (Invitrogen) is widely used for RNA extraction from chicken tissues, followed by quality assessment using Bioanalyzer 2100 (Agilent Technologies) [93]. RNA-seq libraries are typically prepared using Illumina TruSeq RNA Sample preparation kits and sequenced on platforms such as Illumina HiSeq 4000 to produce 100-bp paired-end reads.
For genomic validation, DNA extraction from blood samples can be performed using commercial kits such as the EasyPure Blood Genomic DNA Kit (TransGen Biotech), with DNA concentration and purity measured using NanoDrop 2000 spectrophotometer (Thermo Fisher Scientific) [94]. Whole-genome sequencing libraries are prepared for individuals or pools and sequenced on platforms such as Illumina NovaSeq 6000 with 150 bp paired-end reads.
Functional validation might additionally involve reagents for gene editing (CRISPR-Cas9 systems), antibody-based protein detection (Western blotting), or immunohistochemical analysis of tissue sections. The specific choice of reagents depends on the validation strategy and the particular traits and candidate genes under investigation.
Discussion and Future Perspectives
Cross-species synteny analysis has proven to be an invaluable approach for validating candidate genes associated with economically important traits in chickens. By leveraging evolutionary conservation across species, researchers can prioritize genetic elements with higher confidence, potentially accelerating genetic improvement programs in poultry. The methodological framework outlined in this guide provides a comprehensive roadmap for researchers embarking on synteny-based candidate gene validation.
The performance metrics presented in this analysis demonstrate that synteny approaches are particularly effective for growth and meat quality traits, where conservation tends to be higher across avian species. For reproductive and disease resistance traits, where conservation may be more variable, synteny analysis might need to be complemented with additional validation approaches such as genome-wide association studies (GWAS) or functional analyses.
Future directions in cross-species synteny analysis will likely involve more sophisticated integration of multi-omics data, including transcriptomic, epigenomic, and proteomic information. The development of pangenome references for major poultry species will also enhance synteny detection by capturing a more comprehensive view of genomic variation. Additionally, machine learning approaches applied to synteny networks may help predict functional elements with greater accuracy, further strengthening the candidate gene validation pipeline.
As genomic technologies continue to advance and more high-quality genome assemblies become available for avian and related species, cross-species synteny analysis will remain a cornerstone approach for translating evolutionary insights into practical genetic gains for poultry production.
The domestic chicken (Gallus gallus domesticus), originating from the Red Junglefowl (RJF), represents an exceptional model organism for studying the genomic impacts of artificial selection and domestication [27]. With more than 1,600 breeds worldwide exhibiting remarkable phenotypic diversity, chickens provide a powerful system for exploring how genomic characteristics shape phenotypic traits [27]. The genetic improvement of economic traits in chickens suggests they serve as an excellent model for exploring the genetic changes and molecular mechanisms that underlie phenotypic diversity and artificial selection [27]. Recent advances in whole-genome resequencing have enabled researchers to identify millions of genomic variants and detect signatures of positive selection associated with economically important traits, providing crucial insights into the genetic architecture of domestication [27].
Positive selection occurs when an allele is favored by natural selection, increasing in frequency within a population and potentially becoming fixed [95]. This process leaves distinctive signatures in the genome through genetic hitchhiking, where beneficial mutations reduce linked neutral variation in their vicinity, creating patterns known as selective sweeps [95]. In domestic chickens, positive selection has played a significant role in shaping traits relevant to human needs, with evidence suggesting that it has contributed to evolutionary changes in vision [96], body size [27], and reproductive capabilities [27] during the domestication process.
Methodological Framework for Detecting Positive Selection
Foundational Principles and Statistical Tests
The detection of positive selection relies on predictions made by the neutral theory of molecular evolution, which serves as a null hypothesis against which signatures of selection can be identified [97] [95]. The two primary classes of approaches for identifying positive selection include: (1) methods comparing the incidence of synonymous (silent) and nonsynonymous (amino acid replacement) changes, and (2) tests based on allele or haplotype frequencies within and among populations [98].
The McDonald-Kreitman (MK) test represents one of the strongest approaches for detecting adaptive molecular evolution [97]. This test compares within-species nucleotide diversity and between-species nucleotide divergence for sites subject to natural selection and sites assumed to be evolving neutrally [97]. For protein-coding genes, nonsynonymous sites are typically compared against synonymous sites as a neutral reference. Under neutral evolution, the ratio of nonsynonymous to synonymous polymorphisms (Pn/Ps) should equal the ratio of nonsynonymous to synonymous divergence (Dn/Ds) [97]. Positive selection disrupts this expectation by increasing Dn while contributing negligibly to Pn [97].
The MK test allows estimation of α, the fraction of nonsynonymous differences driven to fixation by positive selection:
$$ \alpha = 1 - \frac{DS{P}n}{Dn{P}s} $$
A significant limitation of this approach is its assumption of the strict neutral model, which can be violated by slightly deleterious mutations that inflate Pn without becoming fixed [97]. Extensions of the MK test address this limitation by explicitly modeling the distribution of fitness effects (DFE) using the site frequency spectrum (SFS) [97].
Advanced Computational Frameworks
More recent methodological advances have led to the development of sophisticated computational frameworks for detecting positive selection:
CEGA (Comparative Evolutionary Genomic Analysis) is a maximum likelihood method that uses multilocus polymorphism and divergence data from two species [99]. This approach is particularly valuable for investigating natural selection in noncoding regions and explicitly models shared genetic polymorphisms between closely related species [99]. CEGA analyzes four summary statistics for each locus: polymorphic sites within species 1 (S1), polymorphic sites within species 2 (S2), shared polymorphic sites (S12), and divergent sites fixed for different alleles (D) [99]. Simulations demonstrate that CEGA outperforms existing methods in detecting both positive and balancing selection [99].
Site-specific models implemented in software packages like PAML and HyPhy test for positive selection by comparing models of molecular evolution that allow for variation in the ω ratio (dN/dS) across sites [100]. Likelihood ratio tests between models that include an extra ω parameter for some proportion of sites and models that do not include this parameter can identify genes with signatures of positive selection [100]. These methods have revealed that between 17-73% of genes show evidence of positive selection across bird species, with approximately 14% of genes representing high-confidence targets when using conservative statistical thresholds [100].
Selective sweep detection methods identify regions of the genome that have experienced recent positive selection through characteristic patterns such as reduced nucleotide diversity, specific shifts in the site frequency spectrum, and distinctive linkage disequilibrium patterns [95]. Popular tools include SweeD, SweepFinder, SweepFinder2, and OmegaPlus, which vary in their sensitivity, specificity, and computational requirements [95].
Table 1: Comparison of Major Methods for Detecting Positive Selection
| Method | Underlying Principle | Data Requirements | Strengths | Limitations |
|---|---|---|---|---|
| McDonald-Kreitman Test | Compares ratios of nonsynonymous to synonymous polymorphisms and divergence | Polymorphism within species and divergence between species | Intuitive framework; estimates proportion of adaptive substitutions | Sensitive to slightly deleterious mutations; requires synonymous sites as neutral reference |
| CEGA | Models polymorphism and divergence patterns using maximum likelihood | Multi-species polymorphism and divergence data | Works in noncoding regions; accounts for shared polymorphisms; high power | Computationally intensive for genome-scale analyses |
| Site-Specific Models (PAML/HyPhy) | Compares models of codon evolution with and without classes of sites under positive selection | Coding sequence alignments across multiple species | Pinpoints specific amino acid sites under selection; well-established statistical framework | Limited to coding regions; requires multiple sequences |
| Selective Sweep Detection (SweeD, OmegaPlus) | Identifies regions with reduced variation, skewed SFS, or distinctive LD patterns | Genome-wide polymorphism data from single species | Genome-wide scope; detects recent selection | Confounded by demographic history; limited to hard sweeps |
Experimental Workflows in Avian Genomics
Whole-Genome Resequencing Approach
Contemporary studies of positive selection in chicken populations typically employ comprehensive whole-genome resequencing strategies [27]. A representative workflow involves:
Sample Collection: Multiple individuals from target populations and outgroups (e.g., 100 commercial Jinghong layer chickens combined with 377 chickens from 24 breeds from public databases) [27].
Sequencing and Quality Control: Generation of high-coverage sequencing data (e.g., 7.4 Tb clean data with average 14.8× depth and 99.28% genome coverage) followed by rigorous quality assessment [27].
Variant Identification: Detection of single nucleotide polymorphisms (SNPs), insertions/deletions (InDels), and structural variations (SVs) using reference-based alignment and variant calling [27]. A typical study might identify ~23.5 million SNPs, ~3.3 million InDels, and ~27,000 SVs [27].
Population Genomic Analysis: Construction of phylogenetic trees, principal component analysis, admixture analysis, and assessment of population genetic parameters including linkage disequilibrium decay and genetic diversity [27].
Selection Signature Detection: Application of multiple statistical tests to identify genomic regions with signatures of positive selection, including FST outliers, Tajima's D, and integrated haplotype scores [27].
The following diagram illustrates this comprehensive experimental workflow:
Cross-Species Comparative Framework
An alternative approach involves comparative genomic analysis across multiple species to identify consistent patterns of positive selection [100]. This methodology includes:
Ortholog Identification: Compiling sets of orthologous genes across related species (e.g., 11,000+ genes conserved across 39 bird species) [100].
Sequence Alignment and Quality Filtering: Generating multiple sequence alignments for each orthologous gene set while controlling for alignment quality [100].
Selection Testing: Applying site-specific models in software such as PAML and HyPhy to test for evidence of positive selection in each gene [100].
Functional Enrichment Analysis: Identifying biological pathways and functional categories enriched for positively selected genes using Gene Ontology and pathway databases [100].
Cross-Clade Comparison: Comparing results with datasets from divergent taxonomic groups (e.g., mammals) to identify shared selection pressures [100].
Table 2: Key Genomic Findings from Avian Selection Studies
| Study Focus | Sample Size | Key Findings | Candidate Genes Identified |
|---|---|---|---|
| Chicken Domestication [27] | 477 individuals from 25 breeds | High-intensity artificial selection accelerates population differentiation; body size and reproduction traits controlled by polygenes and major genes | SOX5, IGF1 (body size), NEDD4, SMC1B (fertility) |
| Vision Evolution [96] | Domestic chickens vs. Red Junglefowl | Positive selection contributed to evolution of vision in domestic chickens rather than relaxation of purifying selection | RHO, GUCA1A, PDE6B, NR2E3, VIT |
| Avian-Mammalian Comparison [100] | 39 bird species + mammalian datasets | Immune genes are hotspots of shared positive selection across divergent clades | Viral defense pathways (PKR, MX1) |
| Taihang Chickens [101] | 66 Taihang + 15 White Plymouth Rock | Identified selection signatures for economic traits and disease resistance | Continuously selected 1.2 Mb region on chromosome 2 |
Significant Findings in Chicken Genomics
Genes Underlying Economic Traits
Genomic analyses of chicken populations have revealed several key genes under positive selection that contribute to economically important traits:
Body Size Regulation: Selection scans have identified SOX5 and IGF1 as primary candidates for body size variation in domestic chickens [27]. IGF1 (Insulin-like Growth Factor 1) represents a potent driver for chicken body size, with evidence of selective sweeps in commercial lines selected for growth traits [27]. The identification of these genes illustrates how artificial selection has targeted conserved growth pathways to generate the remarkable size diversity observed in modern chicken breeds.
Reproductive Traits: Genes including NEDD4 and SMC1B show signatures of selection related to fertility and sperm storage capacity in layer chickens [27]. These findings provide insights into the genetic mechanisms underlying improved reproductive performance in commercial lines, with NEDD4 potentially influencing sperm storage capacity—a trait of particular importance for egg production efficiency [27].
Disease Resistance: Studies of Taihang chickens, known for excellent adaptability and disease resistance, have identified a continuously selected 1.2 Mb region on chromosome 2 that is closely related to disease resistance [101]. This finding highlights how natural and artificial selection have shaped immune-related genomic regions in traditional chicken breeds, providing potential targets for genetic improvement of disease resilience.
Sensory System Evolution
Contrary to initial theories suggesting that diminished visual prowess in domestic chickens reflected relaxed functional constraints, genomic evidence indicates that positive selection actively contributed to the evolution of vision in domestic chickens [96]. Significant differences in mRNA expression for vision-related genes exist between domestic chickens and their wild ancestors, particularly for genes associated with phototransduction and photoreceptor development, including RHO (rhodopsin), GUCA1A, PDE6B, and NR2E3 [96].
The VIT gene, which experienced positive selection and downregulated expression in the retina of village chickens, may represent an adaptation to changed visual requirements in domestic environments [96]. This finding suggests that progenitors of domestic chickens harboring weaker vision may have showed reduced fear response and vigilance, making them easier to domesticate [96].
Shared Selection Across Avian and Mammalian Lineages
Comparative analyses between birds and mammals reveal significant enrichment for positively selected genes shared between these divergent taxa, with shared selected genes particularly enriched for viral immune pathways [100]. This pattern suggests that pathogens, particularly viruses, consistently target the same genes across deep evolutionary timescales, creating hotspots of host-pathogen conflict [100].
Genes up-regulated in response to pathogens show enrichment for positive selection in both birds and mammals, with classic genes involved in host-pathogen co-evolution (PKR, MX1) under selection and up-regulated following pathogen challenge in both clades [100]. This convergence highlights the persistent selective pressure exerted by pathogens across vertebrate evolution.
The following diagram illustrates the functional pathways enriched for positive selection in avian genomes:
Table 3: Essential Research Reagents and Computational Tools for Positive Selection Analysis
| Category | Specific Tools/Reagents | Application in Selection Studies |
|---|---|---|
| Sequencing Platforms | Illumina NovaSeq, PacBio HiFi, Oxford Nanopore | Whole-genome resequencing; variant discovery; structural variant detection |
| Variant Callers | GATK, BCFTools, SAMTools | Identification of SNPs, InDels, and structural variants from sequence data |
| Population Genomic Software | PLINK, ADMIXTURE, VCFTools | Analysis of population structure, genetic diversity, and basic selection statistics |
| Selection Detection Tools | PAML, HyPhy, SweeD, OmegaPlus, SweepFinder | Statistical detection of positive selection using various signatures and models |
| Functional Annotation Databases | Gene Ontology, KEGG, Ensembl, NCBI Gene | Functional interpretation of candidate genes under selection |
| Comparative Genomic Resources | UCSC Genome Browser, OrthoDB, PANTHER | Cross-species comparison of gene evolution and selection patterns |
| Experimental Validation Reagents | CRISPR-Cas9 systems, qPCR assays, antibodies | Functional validation of candidate genes through gene editing and expression analysis |
The identification of genes under positive selection in chicken populations provides not only fundamental insights into evolutionary processes but also practical applications for agricultural improvement and biomedical research. Genes such as SOX5, IGF1, and NEDD4 represent valuable targets for marker-assisted selection in poultry breeding programs, potentially enabling more efficient genetic improvement of growth, reproduction, and disease resistance traits [27].
The conserved patterns of positive selection observed across birds and mammals, particularly in immune-related pathways, highlight fundamental evolutionary constraints and opportunities [100]. These shared selection signatures may inform comparative studies of host-pathogen interactions across species, with potential implications for understanding infectious disease dynamics in both agricultural and human health contexts.
Future directions in positive selection analysis will likely incorporate more sophisticated models that account for polygenic adaptation, regulatory evolution, and epistatic interactions, providing a more comprehensive understanding of how selection shapes genomic diversity. The integration of functional genomics approaches with population genetic scans will further enhance our ability to connect genotypic changes with phenotypic outcomes, ultimately advancing both basic evolutionary biology and applied genetic improvement programs.
Regulatory divergence, the evolutionary changes in non-coding genomic regions that control gene expression, is a fundamental mechanism underlying phenotypic diversity. While both birds and mammals possess complex regulatory architectures, emerging research reveals significant differences in how enhancers and other cis-regulatory elements (CREs) function in these lineages. Understanding these distinctions is particularly crucial for research aimed at validating candidate genes for economic traits in chickens, a major model organism for avian biology and agricultural science.
This guide provides a comparative analysis of enhancer function in birds and mammals, focusing on experimental approaches, mechanistic insights, and practical applications for cross-species validation of candidate genes associated with commercially important traits in poultry.
Fundamental Concepts of Regulatory Divergence
Gene expression is controlled by two primary types of regulatory factors: cis-regulatory elements and trans-regulatory factors. Cis-regulatory elements, such as enhancers, promoters, and silencers, are regions of non-coding DNA that regulate the transcription of nearby genes. In diploid individuals, these elements function in an allele-specific manner. In contrast, trans-regulatory factors (typically proteins) regulate the expression of distant genes by binding to specific target sequences and can affect both alleles of a gene [102].
The functional and evolutionary properties of these two types of regulation differ significantly. Cis-regulatory variants typically exhibit additive effects, making them more exposed to natural selection. Trans-regulatory divergence often involves dominant effects and is influenced by the complex interplay of multiple genetic factors [102]. In evolutionary biology, cis-regulatory changes are particularly valued for their potential to introduce modular changes in gene expression without disrupting multiple genetic networks, making them important drivers of morphological evolution [103].
Comparative Analysis of Enhancer Function in Birds and Mammals
Key Differences in Regulatory Architecture and Function
Table 1: Comparative Analysis of Enhancer Function in Birds and Mammals
| Feature | Birds (Chicken Model) | Mammals (Human/Primate Model) |
|---|---|---|
| Conservation of Imprinting | Largely absent [102] | Well-established genomic imprinting [102] |
| Dosage Compensation | Incomplete on sex chromosomes [102] | More complete (e.g., X-chromosome inactivation) [102] |
| Primary Research Focus | Agricultural traits (growth, reproduction) [102] [5] | Disease modeling, morphological evolution [104] |
| Enhancer Divergence Mechanism | More extensive trans-regulatory changes under artificial selection [102] | cis-regulatory changes often linked to morphological evolution [104] |
| Key Experimental Models | White Leghorn, Cornish Game, Wuhua Yellow chicken [102] [5] | Human, chimpanzee neural crest cells [104] |
Quantitative Patterns of Regulatory Divergence
Table 2: Empirical Data on cis- and trans-Regulatory Divergence in Chickens
| Tissue Type | Genes with cis-Regulatory Divergence | Genes with trans-Regulatory Divergence | Conserved Genes |
|---|---|---|---|
| Brain | ~14.7-17.6% [102] | More extensive than cis [102] | >70% [102] |
| Liver | ~36.5-41.9% [102] | More extensive than cis [102] | ~40% [102] |
| Muscle | ~37.8-38.4% [102] | Most extensive trans-regulation [102] | ~50% [102] |
Experimental Approaches for Studying Regulatory Divergence
Allele-Specific Expression Analysis in Hybrid Crosses
Principle: This approach exploits naturally occurring genetic variants between breeds or species to quantify parental allele expression imbalances in F1 hybrids, directly identifying cis-regulatory divergence.
Protocol from Chicken Studies: Reciprocal crosses between genetically distinct chicken breeds (White Leghorn and Cornish Game) were established to generate F1 hybrid progeny [102]. RNA sequencing was performed on multiple tissues (brain, liver, muscle) from 1-day-old specimens. A computational pipeline using the 'asSeq' package in R was employed to phase genotypes based on millions of breed-specific heterozygous SNPs identified through whole-genome sequencing of parents [102]. Allele-specific reads overlapping these heterozygous markers were counted, and significant deviation from the expected 1:1 allelic ratio indicated cis-regulatory divergence.
Validation: The pipeline was validated by creating artificial hybrid F1 libraries through concatenation of RNA-seq data from purebred individuals, demonstrating strong correlation between simulated and real allele expression ratios [102].
Epigenomic Profiling for Enhancer Annotation
Principle: Active enhancers are characterized by specific chromatin signatures, such as particular histone modifications (e.g., H3K27ac). Comparative epigenomics enables the identification of species-specific enhancer activities.
Protocol from Primate Studies: Human and chimpanzee cranial neural crest cells (CNCCs) were derived from induced pluripotent stem cells (iPSCs) [104]. Chromatin immunoprecipitation followed by sequencing (ChIP-seq) was performed for H3K27ac to map active enhancers. Accessible chromatin regions were identified using ATAC-seq or DNase-seq. Species-biased enhancers were classified based on significant differences in histone modification signals. Genetic variation within transcription factor binding motifs at orthologous enhancers was analyzed to pinpoint potential causal variants for regulatory divergence [104].
Functional Validation: Candidate enhancers were tested using reporter gene assays (e.g., luciferase) in relevant cell types to confirm species-specific activity differences [104].
Integrated GWAS and Functional Genomics
Principle: Genome-wide association studies identify genomic regions associated with traits of interest, while functional genomic annotations help prioritize causal variants and genes within these regions.
Protocol from Chicken Studies: A 16-generation chicken Advanced Intercross Line (AIL) was established between Huiyang Bearded chicken and High-Quality Chicken Line A to enhance recombination and improve mapping resolution [16]. High-density SNP genotyping was performed across 4,671 samples. Growth and slaughter traits were systematically recorded. GWAS identified significant loci, followed by colocalization analysis with molecular quantitative trait loci (molQTLs) such as expression QTLs (eQTLs) and chromatin accessibility QTLs (caQTLs) to link regulatory variants to target genes [16].
Signaling Pathways in Avian Economic Traits
IGF/PI3K-mTOR Pathway in Growth and Body Weight
This pathway centrally regulates growth, cell proliferation, and metabolism—key determinants of body weight in chickens. IGF2R and IGFBP2 showed significant expression bias between fast-growing (Cornish Game) and layer (White Leghorn) chicken breeds, indicating selection on this pathway [102]. IGF1 was associated with clutch size and egg number in Wuhua yellow chickens, primarily through mTOR and insulin signaling pathways [5]. Recent meta-analysis identified KPNA3 and CAB39L as novel candidate genes for body weight traits, with regulatory variants enriched in enhancer and promoter elements in muscle, adipose, and intestinal tissues [51].
Follicular Development Pathway in Egg Production
This pathway governs ovarian follicle development and maturation, directly influencing age at first egg and egg production traits. SCUBE1 and KRTS are important regulators of age at first egg through follicular development and metabolic pathways [5]. PTK2 associates with clutch size and egg number through insulin signaling pathways [5]. GWAS in Wuhua yellow chicken identified 379 candidate genes for egg production traits, with significant enrichment in cell adhesion, hormone signaling, and oocyte maturation pathways [5].
The Scientist's Toolkit: Research Reagent Solutions
Table 3: Essential Research Reagents for Studying Regulatory Divergence
| Reagent/Category | Specific Examples | Function/Application |
|---|---|---|
| Cell Culture Models | Cranial Neural Crest Cells (CNCCs) [104], Primary tissue cells | Species-specific in vitro models for functional studies |
| Antibodies for Chromatin Profiling | H3K27ac [104], Other histone modification-specific antibodies | Mark active enhancers and promoters in ChIP-seq experiments |
| Sequencing Kits | RNA-seq library prep, Whole-genome sequencing, ChIP-seq kits | Generate data for allele-specific expression, genetic variation, and enhancer mapping |
| Software/Packages | 'asSeq' R package [102], eQTL colocalization tools [16] | Analyze allele-specific expression and integrate multi-omics datasets |
| Reporter Assay Systems | Luciferase constructs, GFP reporters | Test enhancer activity of candidate regulatory elements |
| Animal Populations | Advanced Intercross Lines (AILs) [16], Reciprocal F1 crosses [102] | Enhance mapping resolution and detect cis-regulatory divergence |
The comparative analysis of enhancer function between birds and mammals reveals both conserved principles and lineage-specific adaptations in regulatory genome evolution. Chicken models provide exceptional power for elucidating the regulatory genetics of economic traits, particularly through approaches that combine traditional breeding designs with modern genomic technologies. The continued development of functional genomic resources for chickens—including improved reference genomes, tissue-specific epigenomic annotations, and single-cell atlases—will further enhance their utility for both agricultural innovation and fundamental evolutionary studies. For researchers validating candidate genes across species, careful consideration of these regulatory differences is essential for successful translation of findings between avian and mammalian systems.
The domestic chicken (Gallus gallus domesticus) represents a powerful, yet often underutilized, model organism in biomedical research. Its unique biological features, including external embryonic development and a simplified immune gene complex, bridge the gap between mammalian models and in vitro systems. This review objectively compares the chicken model to other alternatives, detailing its proven utility in validating candidate genes for economic traits with direct relevance to human biology. We provide supporting experimental data and methodologies that underscore the chicken's role in groundbreaking discoveries in immunology, oncology, and developmental biology.
For over a century, the chicken has served as an indispensable model organism, contributing to seminal discoveries that have shaped modern biology and medicine [105]. The chicken model combines unique advantages of accessible embryology with a fully sequenced genome, offering a cost-effective vertebrate system for validating gene function and disease mechanisms [106]. Its historical contributions span virology, immunology, and cancer research, with landmark discoveries including the first demonstration of a virus causing cancer (Rous sarcoma virus) and the identification of B lymphocyte development in the bursa of Fabricius [107] [105]. The chicken's value extends beyond agricultural applications to fundamental biomedical research, providing critical insights into human disease mechanisms and genetic validation.
Recent advances in genomic technologies have reinforced the chicken's position as a relevant model for cross-species genetic validation. The sequencing of the chicken genome in 2004 provided a comprehensive resource for comparative genomics, revealing significant fundamental similarities between human and chicken genomes while highlighting differences that help identify conserved functional elements [106]. This review will examine the experimental evidence supporting the chicken as a model for validating genes with relevance to human biology, compare its performance to alternative model systems, and provide detailed methodologies for leveraging this system in biomedical research.
Advantages of the Chicken Model System
The chicken offers a distinctive combination of practical and biological advantages that make it particularly suitable for validating genes identified in genetic studies and exploring their functional significance across species.
Unique Biological and Practical Benefits
Table 1: Key Advantages of the Chicken Biomedical Model
| Advantage Category | Specific Features | Research Applications |
|---|---|---|
| Embryonic Development | Large, externally developing embryos; easy optical access | Real-time developmental studies; microsurgery; teratology testing |
| Genomic Simplicity | Compact, simplified MHC; sequenced genome | Immune gene function studies; evolutionary comparisons |
| Cost Efficiency | Lower maintenance costs than mammals; rapid generation time | Large-scale genetic studies; high-throughput drug screening |
| Physiological Relevance | Complex vertebrate systems comparable to mammals | Cancer research; infectious disease modeling; organogenesis studies |
| Technical Accessibility | Amenable to genetic manipulation; transgenic techniques | Gene function validation; CRISPR-based editing studies |
The accessibility of the chicken embryo represents one of its most significant advantages. Unlike mammalian embryos, which develop in utero, chicken embryos develop externally in eggs, allowing for direct observation and manipulation without invasive procedures [106]. This permits real-time study of developmental processes, including organ formation, tissue differentiation, and neural development. Experimental techniques such as windowing—cutting a small opening in the eggshell and covering it with another piece of shell—enable researchers to observe and manipulate embryonic development directly without dehydration, facilitating detailed study of embryonic germ layers and tissue differentiation [105].
The simplified genomic organization of certain gene families in chickens, particularly the Major Histocompatibility Complex (MHC), provides a streamlined system for understanding gene function. Compared to the large and complex MHC of typical mammals (approximately 4 megabase pairs in humans), the chicken MHC is compact and simple (approximately 95 kilobase pairs), with single dominantly-expressed class I and class II molecules [107] [108]. This simplicity has enabled fundamental discoveries about the interplay of structure, function, and evolution of the adaptive immune system, including the identification of generalist and specialist MHC alleles that determine responses to infectious pathogens [108].
From a practical research perspective, chickens are relatively inexpensive to maintain and breed in large numbers compared to mammalian models, making them a cost-effective option for large-scale studies [106]. Their shorter generation time compared to larger mammalian models enables more rapid experimental turnover. Additionally, the ability to produce large quantities of viruses in chicken eggs has been crucial for vaccine development, particularly for diseases such as influenza [105] [106].
Comparative Performance Against Alternative Models
Table 2: Chicken Model Performance Comparison with Other Research Organisms
| Research Parameter | Chicken Model | Mouse Model | Zebrafish | Cell Cultures |
|---|---|---|---|---|
| Embryonic Accessibility | High | Low | High | Not Applicable |
| Genetic Manipulation Complexity | Moderate | Low | Low | High |
| Physiological Complexity | High (Vertebrate) | High (Mammal) | Moderate | Low |
| MHC/Immune System Complexity | Simplified | Complex | Intermediate | Not Applicable |
| Operational Costs | Moderate | Moderate-High | Low | Low |
| Throughput Capacity | Moderate | Moderate | High | Very High |
| Evolutionary Proximity to Humans | Intermediate | Close | Distant | Variable |
| Ethical Considerations | Moderate | Moderate | Low | Low |
When compared to mammalian models like mice, chickens provide an independent validation system that can challenge or confirm biological dogmas established in mammalian systems. Research on humans directly addresses many questions about disease, but experiments into mechanisms are limited by practicality and ethics. For research into all levels of disease simultaneously, chickens combine many of the advantages of humans and of mice [108]. The differences between mammalian and chicken systems mean that findings confirmed in both carry greater weight regarding their fundamental biological significance.
The chorioallantoic membrane (CAM) of the chicken embryo provides a unique platform for cancer research that overcomes many limitations of studying tumor biology in vivo. As a well-vascularized extra-embryonic tissue, the CAM has served as a biological platform for molecular analysis of cancer including viral oncogenesis, carcinogenesis, tumor xenografting, tumor angiogenesis, and cancer metastasis [105]. Since the chicken embryo is naturally immunodeficient until about day 14 of incubation, the CAM readily supports the engraftment of both normal and tumor tissues, successfully supporting most cancer cell characteristics including growth, invasion, angiogenesis, and remodeling of the microenvironment [105].
Experimental Validation of Gene Function: Methodologies and Protocols
The chicken model provides multiple experimental pathways for validating gene function, with well-established protocols that leverage its unique biological features.
MHC and Immune Gene Validation
The simplicity of the chicken MHC has enabled fundamental discoveries about the structure, function, and evolution of the adaptive immune system. The experimental approach for characterizing MHC function typically involves:
Protocol 1: MHC Haplotype Association Studies
- Genetic Typing: Identify and sequence MHC haplotypes (B locus) in inbred or defined chicken lines using targeted sequencing approaches [107].
- Pathogen Challenge: Expose different haplotype groups to controlled infectious pathogens (e.g., Marek's disease virus, avian coronavirus) [108].
- Response Monitoring: Track disease progression, mortality rates, and viral loads across haplotype groups.
- Peptide Binding Profiling: For resistant vs. susceptible haplotypes, characterize peptide-binding specificities of dominant MHC molecules using crystallography and peptide elution studies [108].
- Cross-Species Comparison: Compare findings with human MHC characteristics to validate conserved mechanisms.
This approach led to the discovery of "generalist" and "specialist" MHC alleles in chickens—generalists bind a few peptides with high affinity for a strong focused response, while specialists bind many peptides with lower affinity for a broad response [108]. This fundamental principle was later extended to humans, where HLA-B46:01 was identified as a specialist allele and HLA-B27:05 as a generalist, demonstrating how chicken studies can reveal biological principles applicable to human systems [108].
Cancer Gene Validation Using the CAM Model
The chicken CAM assay provides a sophisticated yet accessible platform for studying tumor development and metastasis:
Protocol 2: CAM Tumor Xenograft Assay
- Egg Preparation: Incubate fertilized chicken eggs at 37°C with 60% humidity for 8-10 days [105].
- Window Preparation: Create a small window (1-2 cm²) in the eggshell above the CAM using careful drilling or cutting, ensuring the inner shell membrane remains intact.
- Membrane Hydration: Add sterile saline solution to separate the shell membrane from the CAM itself.
- Tumor Implantation: Place tumor cells (1-5×10⁶ cells) or tissue fragments (1-2 mm³) directly onto the CAM surface using sterile techniques.
- Monitoring: Reseal the window with sterile tape and return eggs to incubator. Monitor tumor growth, angiogenesis, and invasion daily for 5-7 days.
- Endpoint Analysis: Harvest CAMs for histological analysis, gene expression studies, or metastasis assessment to other embryonic tissues.
The CAM model successfully supports most cancer cell characteristics including growth, invasion, angiogenesis, and remodeling of the microenvironment [105]. The chicken embryo is naturally immunodeficient until about day 14 of incubation, allowing the CAM to readily support the engraftment of both normal and tumor tissues without rejection [105]. This model has been instrumental in studying the role of oncogenes and tumor suppressor genes in cancer progression.
Developmental Gene Validation
The accessibility of the chicken embryo makes it ideal for studying gene function during development:
Protocol 3: Embryonic Gene Manipulation via Electroporation
- Embryo Access: Incubate fertilized eggs for 48-72 hours (Hamburger-Hamilton stages 10-18) until desired developmental stage is reached.
- DNA/RNA Preparation: Prepare constructs for overexpression (plasmids) or knockdown (siRNA, shRNA) of target genes, often with fluorescent reporters.
- Microinjection: Deliver genetic material to specific embryonic regions using pulled glass capillaries and precision injection systems.
- Electroporation: Apply carefully tuned electrical pulses (5-25V, 5 pulses of 50ms duration with 950ms intervals) to facilitate DNA/RNA uptake into target cells.
- Incubation and Analysis: Reseal eggs and continue incubation for desired periods before fixing embryos for morphological analysis, immunohistochemistry, or in situ hybridization.
This approach has been particularly valuable for studying neural development, limb formation, and organogenesis, providing insights directly relevant to human developmental biology and congenital disorders.
Figure 1: Cross-Species Gene Validation Workflow Using Chicken Models. This diagram illustrates the systematic approach for validating candidate genes identified in livestock GWAS studies through functional testing in chicken models, ultimately confirming relevance to human biology.
Successfully implementing chicken model research requires specific reagents and resources optimized for this system.
Table 3: Essential Research Reagents for Chicken Model Studies
| Reagent/Resource | Specific Function | Example Applications | Considerations |
|---|---|---|---|
| Fertilized Specific-Pathogen-Free (SPF) Eggs | Provide embryos for developmental studies; virus propagation | Embryonic manipulation; vaccine development | Source from certified suppliers; proper storage and handling |
| MHC-Defined Chicken Lines | Controlled genetic background for immune studies | MHC haplotype and disease resistance correlation | Maintain strict breeding protocols; monitor genetic drift |
| Chicken-Specific Antibodies | Detection of chicken antigens in immunohistochemistry, flow cytometry | Immune cell profiling; tissue analysis | Verify cross-reactivity; limited availability vs mammalian systems |
| Chicken Embryo Fibroblasts (CEFs) | Primary cell culture for viral propagation; cytotoxicity assays | Vaccine production; viral tropism studies | Prepare fresh for each experiment; limited passage capacity |
| Avian-Specific Viral Vectors | Gene delivery; expression studies | Genetic manipulation; gene function analysis | Optimize tropism and efficiency for chicken cells |
| Chicken Genomic Databases | Sequence information; comparative genomics | Primer design; phylogenetic analysis | Use updated annotations; cross-reference with mammalian genomes |
The availability of MHC-defined chicken lines has been particularly valuable for immunology research. These genetically defined lines, with characterized B haplotypes, enable researchers to study the specific contributions of MHC genes to disease resistance and immune responses [107] [108]. The compact nature of the chicken MHC means that these haplotypes often represent stable combinations of genes that are inherited together due to low recombination rates [107].
For developmental studies, chicken-specific antibodies against various cell markers, extracellular matrix components, and signaling molecules are essential for characterizing phenotypic outcomes of genetic manipulations. While fewer chicken-specific reagents are available compared to mammalian systems, companies like Boster Bio offer custom antibody development services specifically for researchers working with chicken models [106].
Case Studies: Validating Economic Trait Genes with Biomedical Relevance
MHC Genes and Disease Resistance
The chicken MHC (B locus) provides a powerful example of how genes associated with economic traits in agricultural species can provide insights with biomedical relevance. Unlike the complex MHC of mammals with multiple classical class I and II genes, the chicken MHC is simple, with single dominantly expressed class I (BF2) and class II (BLB2) molecules [107] [108]. This simplicity enabled the discovery that different MHC haplotypes confer resistance or susceptibility to specific viral (Marek's disease, avian influenza), bacterial (Pasteurella multocida), and parasitic (Eimeria) pathogens [108].
The mechanistic basis for these associations was elucidated through structural biology studies, revealing that peptide-binding specificity of the BF2 molecule determines disease outcomes [108]. These findings in chickens subsequently informed our understanding of human MHC (HLA) associations with diseases, demonstrating a direct pathway from agricultural trait validation to biomedical insight.
Cancer Gene Discovery and Validation
Chickens have played a pivotal role in cancer research since Peyton Rous's 1911 discovery of the Rous sarcoma virus (RSV), which demonstrated for the first time that viruses could cause cancer [107] [105]. Subsequent research on RSV led to the identification of the src oncogene, which became the first known oncogene when its cellular homolog (proto-oncogene) was discovered [105]. This fundamental discovery established the concept that normal cellular genes can be subverted to cause cancer, a principle that forms the basis of much modern cancer biology.
The chicken model continues to provide insights into cancer mechanisms through the CAM assay, which offers a natural environment for studying tumor behavior that cannot be fully recapitulated in vitro. The assay has been used to study various aspects of cancer biology, including angiogenesis, metastasis, and the role of specific oncogenes and tumor suppressor genes in these processes [105].
Limitations and Complementary Approaches
While the chicken model offers significant advantages, researchers must also consider its limitations when designing validation studies.
The non-mammalian status of chickens means that certain aspects of mammalian physiology, such as placental development and lactation, cannot be studied in this system [106]. Additionally, genetic manipulation techniques for chickens are less developed and more labor-intensive compared to mouse models, though CRISPR-Cas9 approaches are becoming more established [106]. There are also fewer specialized research reagents, such as antibodies, available for chicken studies compared to mammalian systems [106].
To address these limitations, researchers often adopt a complementary model approach, using chickens for initial validation of candidate genes followed by confirmation in mammalian systems. This strategy leverages the unique advantages of each system while mitigating their respective limitations. For example, genes identified through GWAS in livestock for economic traits can be initially validated in chickens using embryological approaches or MHC association studies, then further investigated in mouse models for mammalian-specific physiological contexts.
Figure 2: MHC Comparative Structure and Function. This diagram compares the compact, simple chicken MHC with the complex human MHC, highlighting how fundamental principles of immunology discovered in chickens apply to human systems.
The chicken model continues to provide unique value for validating gene function and exploring biological mechanisms with relevance to human health. Its distinctive advantages—including embryonic accessibility, simplified genomic organization of key systems like the MHC, and cost-effectiveness—complement more traditional mammalian models. The historical contributions of chicken research to immunology, virology, and cancer biology underscore its ongoing potential for generating fundamental insights.
As genomic technologies advance, the chicken model offers an efficient pathway for functionally validating the growing number of candidate genes identified through GWAS and other genetic approaches in both agricultural and biomedical contexts. By integrating chicken model studies with mammalian validation and human cell-based assays, researchers can establish robust evidence for gene function across species boundaries, accelerating the translation of genetic discoveries to practical applications in both medicine and agriculture.
In the pursuit of enhancing economically vital traits in chickens, such as growth rate and feed efficiency, researchers increasingly rely on identifying candidate genes. However, validating the functional role of these genes and their associated pathways within chickens can be a time-consuming and resource-intensive process. A powerful complementary approach is to investigate the conservation of these genes and pathways across multiple species. Evidence from evolutionarily diverse organisms, including mammals like sheep and cattle, as well as model organisms like yeast and E. coli, can provide strong corroborative evidence for a gene's fundamental role in regulating growth and metabolism. This cross-species comparison framework allows scientists to distinguish between universally critical biological mechanisms and species-specific adaptations, thereby strengthening the rationale for targeting specific genes in poultry breeding programs. This case study examines the conservation of the growth-related gene NCAPG and the principles of metabolic pathway analysis across species, highlighting how data from other organisms can inform and accelerate genetic research in chickens.
Conservation of the NCAPG Gene and Its Role in Growth
Functional Evidence from Sheep Myogenesis
The NCAPG (Non-SMC Condensin I Complex Subunit G) gene serves as a prime example of a growth regulator with conserved functions across species. Genome-wide association studies (GWAS) in sheep, cattle, and chickens have repeatedly highlighted NCAPG as a significant candidate gene associated with body size and growth traits [109] [16]. Recent functional studies in sheep provide direct experimental evidence for its role.
A 2023 study demonstrated that knocking down NCAPG expression in ovine embryonic myoblasts significantly inhibited both cell proliferation and differentiation [109]. Key experimental findings are summarized in the table below.
Table 1: Key Experimental Findings from NCAPG Knockdown in Ovine Myoblasts [109]
| Experimental Assay | Key Finding | Biological Implication |
|---|---|---|
| CCK-8 Assay | Significant decrease in cell viability after 48h and 72h. | NCAPG is essential for myoblast survival and proliferation. |
| EdU Proliferation Assay | Notable decrease in the percentage of EdU-positive cells. | Directly impairs the rate of cell division. |
| Flow Cytometry (Cell Cycle) | Significant decrease in the quantity of S-phase cells. | Causes cell cycle arrest, slowing down proliferation. |
| Quantification of MRFs | Markedly reduced expression of myogenic regulatory factors during differentiation. | Hinders the genetic program that drives muscle cell formation. |
Furthermore, the same study identified single-nucleotide polymorphisms (SNPs) in the promoter region of NCAPG that were significantly associated with body weight, body height, and body length in sheep, providing a genetic marker basis for its role in growth [109]. This functional evidence from sheep reinforces GWAS findings in chickens and cattle, suggesting a conserved molecular mechanism regulating muscle development and overall body size across these species [27] [16].
NCAPG Associated Signaling Pathways
The following diagram illustrates the functional role of NCAPG in myogenesis and its potential regulatory connections, based on evidence from cross-species studies.
Diagram 1: NCAPG in Myogenesis Regulation. This diagram synthesizes experimental evidence from sheep and cattle [109], showing how NCAPG influences myogenesis through cell cycle progression and myogenic regulatory factors (MRFs), and how promoter SNPs can modulate this process.
Comparative Analysis of Metabolic Pathways Across Species
Methodologies for Cross-Species Metabolic Comparison
Beyond single genes, comparing entire metabolic networks across species provides a systems-level view of functional conservation and divergence. Several computational frameworks have been developed for this purpose:
Sensitivity Correlation: This method, detailed in a 2023 Nature Communications study, quantifies the similarity of predicted metabolic network responses to perturbations [110]. It moves beyond simple reaction presence/absence (e.g., Jaccard index) by calculating how perturbations in enzyme-catalyzed reactions affect all other fluxes in the network. The functional similarity between two species for a given reaction is measured by correlating the sensitivity profiles of all common reactions, thereby capturing the influence of network context on gene function [110].
Metabolic Pathway Alignment and Scoring (M-PAS): This framework aligns entire metabolic networks from two species to identify and rank conserved pathways, taking into account mismatches, gaps, and crossovers [111]. It uses a comprehensive scoring function that integrates similarities between substrate sets, product sets, enzyme functions, and alignment topology to quantify pathway conservation [111].
Expression Data Matching: For comparative analysis of gene expression across species, advanced computational methods have been developed. These methods use a co-training algorithm that combines a model of expression similarity (based on the rank order of orthologs) with a model of the textual information accompanying the expression experiments to automatically identify pairs of similar expression datasets across species [112].
Key Findings on Metabolic Pathway Conservation
Application of these methods has yielded critical insights into the evolution and function of metabolism. The following table summarizes experimental data from key comparative studies.
Table 2: Key Findings from Cross-Species Metabolic Network Comparisons
| Study Focus / Species Compared | Method Used | Key Quantitative Finding | Interpretation |
|---|---|---|---|
| Global Phylogeny (15 species) [110] | Average Sensitivity Correlation | Similarity decreases with species divergence time, saturating at high divergence. | Metabolic network function reflects evolutionary history. |
| E. coli vs. B. subtilis [110] | Subsystem Sensitivity Correlation | Lipid & cell wall metabolism least similar; coenzyme metabolism bimodal. | Functional similarity aligns with known biology (e.g., Gram status). |
| S. cerevisiae vs. E. coli [111] | M-PAS | 1198 length-four pathways fully conserved; 1399 cases of unique routes. | Widespread pathway conservation exists alongside significant species-specific variations. |
| Human vs. Yeast [110] | Sensitivity Correlation | Orthologous enzyme pairs had significantly higher sensitivity correlations (P < 10⁻¹⁰). | Network context shapes the function of orthologs, which are not functionally equivalent. |
These findings demonstrate that while core metabolism is often conserved, the precise functional implementation of pathways and enzymes can vary significantly due to network context, providing a framework for interpreting genetic data from non-chicken models.
Workflow for Cross-Species Metabolic Comparison
The typical workflow for a sensitivity correlation analysis, a leading method in the field, is outlined below.
Diagram 2: Workflow for Metabolic Sensitivity Correlation. This diagram outlines the process of comparing metabolic function across species using Genome-Scale Metabolic models (GSMs) and sensitivity analysis, as described in [110].
Table 3: Key Research Reagent Solutions for Cross-Species Genetic and Metabolic Studies
| Reagent / Resource | Function / Application | Example Use Case |
|---|---|---|
| Small Interfering RNA (siRNA) | Knocks down gene expression in cell cultures to study gene function. | Investigating the role of NCAPG in ovine myoblast proliferation and differentiation [109]. |
| Custom SNP Arrays & WGS | Genotyping and variant discovery across the genome for GWAS. | Identifying genetic markers associated with feed efficiency and growth in Wenchang and Wuhua yellow chickens [11] [5]. |
| Genome-Scale Metabolic Models (GSMs) | Computational models of an organism's metabolism for in silico phenotype prediction. | Comparing metabolic network functions and responses across 15 species from all kingdoms of life [110]. |
| Co-training Algorithms | Integrates heterogeneous data types (e.g., expression values and text) to improve cross-species data matching. | Identifying similar gene expression experiments between human and mouse from public databases [112]. |
| Advanced Intercross Line (AIL) | A breeding population that enhances genetic recombination for high-resolution gene mapping. | Fine-mapping hundreds of quantitative trait loci (QTLs) for growth traits in chickens to the single-gene level [16]. |
This case study demonstrates that a cross-species comparative approach provides a powerful strategy for validating candidate genes for chicken economic traits. Functional evidence from sheep firmly establishes NCAPG's conserved role in governing myogenesis and overall growth, giving researchers greater confidence in its importance in poultry. Simultaneously, advanced computational methods for metabolic pathway comparison reveal that while the core architecture of metabolism is often conserved, the functional context of individual enzymes and pathways can diverge. For researchers and drug development professionals, these insights are critical. They underscore the value of leveraging data from model organisms and livestock to prioritize targets for poultry breeding, while also cautioning that a detailed understanding of species-specific network biology is essential for accurate translation. The continued development of functional genomics tools and sophisticated comparative databases will further refine this cross-species validation paradigm, accelerating the improvement of agricultural traits.
Conclusion
The systematic validation of candidate genes for chicken economic traits represents a convergence of advanced genomics, precise genome engineering, and evolutionary biology. By moving from associative studies to functional proof and cross-species conservation analysis, researchers can confidently pinpoint causal genes and variants. The methodologies established in poultry genomics—such as multi-omics integration in the ChickenGTEx project and the use of AIL populations for fine-mapping—offer a robust blueprint for genetic investigation in other species. These advances not only accelerate precision breeding for sustainable poultry production but also solidify the chicken's role as a potent model for uncovering conserved genetic pathways relevant to human development, disease, and physiology. Future directions will be dominated by the integration of single-cell multi-omics, artificial intelligence for predictive genomics, and the development of chickens as dual-purpose models for both agriculture and biopharmaceutical production, thereby bridging the gap between farm and clinic.
References
- 1. Genome-wide association studies for growth traits in broilers [https://bmcgenomdata.biomedcentral.com/articles/10.1186/s12863-021-01017-7]
- 2. Genetic Diversity Analysis and Identification of Candidate ... [https://pmc.ncbi.nlm.nih.gov/articles/PMC11641596/]
- 3. Comparative Genomic Analysis Across Multiple Species to ... [https://pmc.ncbi.nlm.nih.gov/articles/PMC12192435/]
- 4. impacts on meat quality and candidate gene screening [https://www.sciencedirect.com/science/article/pii/S0032579125004870]
- 5. Genome-wide association study reveals candidate genes ... [https://www.sciencedirect.com/science/article/pii/S0032579125009800]
- 6. Genetic Diversity Analysis and Identification of Candidate ... [https://www.mdpi.com/1422-0067/25/23/12939]
- 7. Mapping of Quantitative Trait Loci for Growth and Carcass ... [https://pmc.ncbi.nlm.nih.gov/articles/PMC7005382/]
- 8. Genome-Wide Association Study and Meta-Analysis Uncovers ... [https://pmc.ncbi.nlm.nih.gov/articles/PMC12385673/]
- 9. Conservation of regulatory elements with highly diverged ... [https://www.nature.com/articles/s41588-025-02202-5]
- 10. Comparative Genomic Analysis Across Multiple Species to ... [https://pubmed.ncbi.nlm.nih.gov/40565519/]
- 11. Genome-wide association analysis identify candidate genes ... [https://bmcgenomics.biomedcentral.com/articles/10.1186/s12864-024-10559-w]
- 12. Transcriptome Profile Analysis Identifies Candidate Genes ... [https://pmc.ncbi.nlm.nih.gov/articles/PMC10221249/]
- 13. Whole-transcriptome sequencing reveals a melanin- ... [https://www.sciencedirect.com/science/article/pii/S0032579124001184]
- 14. Dynamic Transcriptome Profile Analysis of Mechanisms ... [https://www.mdpi.com/2076-2615/14/18/2702]
- 15. Identification of key candidate genes and marker ... [https://pmc.ncbi.nlm.nih.gov/articles/PMC12278494/]
- 16. Mapping the regulatory genetic landscape of complex traits ... [https://www.nature.com/articles/s41467-025-60834-x]
- 17. Comparative genomic tools and databases [https://pmc.ncbi.nlm.nih.gov/articles/PMC152942/]
- 18. Comparative Genomic Analysis Across Multiple Species to ... [https://www.mdpi.com/2073-4425/16/6/627]
- 19. Identification of candidate genomic regions for chicken egg ... [https://bmcgenomics.biomedcentral.com/articles/10.1186/s12864-021-07755-3]
- 20. Integrative multi-omics analysis deciphers the regulatory ... [https://www.sciencedirect.com/science/article/pii/S0032579125010545]
- 21. VISTA tools [https://genome.lbl.gov/vista/index.shtml]
- 22. MOSGA 2: Comparative genomics and validation tools [https://www.sciencedirect.com/science/article/pii/S2001037021004098]
- 23. A comparative genomics multitool for scientific discovery ... [https://www.nature.com/articles/s41586-020-2876-6]
- 24. Meta-analysis in genome-wide association studies - PMC [https://pmc.ncbi.nlm.nih.gov/articles/PMC2695132/]
- 25. Evaluating multi-ancestry genome-wide association methods [https://www.sciencedirect.com/science/article/pii/S0002929725003167]
- 26. An empirical comparison of meta-analysis and mega ... [https://pmc.ncbi.nlm.nih.gov/articles/PMC4332385/]
- 27. The genomic characteristics affect phenotypic diversity ... [https://pmc.ncbi.nlm.nih.gov/articles/PMC10068565/]
- 28. About - ChickenGTEx [https://ngdc.cncb.ac.cn/chickengtex/about]
- 29. Animal QTL Database [https://www.animalgenome.org/cgi-bin/QTLdb/index]
- 30. From FAANG to fork: application of highly annotated genomes to... [https://genomebiology.biomedcentral.com/articles/10.1186/s13059-020-02197-8]
- 31. Mapping the regulatory genetic landscape of... | Nature Communications [https://www.nature.com/articles/s41467-025-60834-x?error=cookies_not_supported&code=d7a331e9-0faf-4803-8307-eafe7644d5a6]
- 32. Performance Gains in Genome-Wide Association Studies ... [https://www.nature.com/articles/s41598-017-00638-2]
- 33. GWAS and Beyond: Using Omics Approaches to Interpret SNP ... [https://pmc.ncbi.nlm.nih.gov/articles/PMC7731888/]
- 34. Genome, transcriptome and proteome: the rise of omics data ... [https://pmc.ncbi.nlm.nih.gov/articles/PMC6018996/]
- 35. Strategies for Comprehensive Multi-Omics Integrative Data ... [https://pmc.ncbi.nlm.nih.gov/articles/PMC11592251/]
- 36. Integrating Proteomics with Metabolomics: A Multi-Omics ... [https://www.metwarebio.com/integrating-proteomics-with-metabolomics-a-multi-omics-strategy-for-systems-biology/]
- 37. Consolidation of metabolomic, proteomic, and GWAS data ... [https://www.nature.com/articles/s41598-023-29117-7]
- 38. Beyond genomics: understanding exposotypes through ... [https://humgenomics.biomedcentral.com/articles/10.1186/s40246-018-0134-x]
- 39. Integration of transcriptomics, proteomics, and ... [https://www.frontiersin.org/journals/immunology/articles/10.3389/fimmu.2022.951137/full]
- 40. Precision gene editing: The power of CRISPR-Cas in ... [https://pmc.ncbi.nlm.nih.gov/articles/PMC12590234/]
- 41. Recent Advances in the Application of CRISPR/Cas9 Gene ... [https://www.frontiersin.org/journals/genetics/articles/10.3389/fgene.2021.627714/full]
- 42. CRISPR/Cas9 gene editing in a chicken model [https://pmc.ncbi.nlm.nih.gov/articles/PMC7148258/]
- 43. State of CRISPR Gene Editing in the Drug Discovery Sector [https://www.synthego.com/blog/survey-report-crispr-therapeutics/]
- 44. Effective IHH gene knockout by CRISPR/Cas9 system in ... [https://www.sciencedirect.com/science/article/pii/S0032579125006777]
- 45. CRISPR/Cas9 Targeting - Precision Mouse Engineering ... [https://www.mayo.edu/research/core-resources/precision-mouse-engineering-core/services/crispr-cas9-targeting]
- 46. An atlas of regulatory elements in chicken: A resource for ... [https://pmc.ncbi.nlm.nih.gov/articles/PMC10156120/]
- 47. Animal-eRNAdb: a comprehensive animal enhancer RNA ... [https://pmc.ncbi.nlm.nih.gov/articles/PMC8728245/]
- 48. The emerging roles of eRNAs in transcriptional regulatory networks - PubMed [https://pubmed.ncbi.nlm.nih.gov/24525859/]
- 49. Interaction Between Enhancers and Promoters in Chicken Genome [https://www.mdpi.com/1422-0067/26/23/11407]
- 50. Prediction of Enhancer RNAs in Chicken Genome [https://www.mdpi.com/1422-0067/26/22/10986/review_report]
- 51. Genome-Wide Association Study and Meta-Analysis ... [https://pubmed.ncbi.nlm.nih.gov/40869993/]
- 52. Deciphering functional landscape and clinical implications of enhancer RNAs in lung adenocarcinoma | Scientific Reports [https://www.nature.com/articles/s41598-025-15485-9]
- 53. Genome-wide association studies on longitudinal ... [https://pmc.ncbi.nlm.nih.gov/articles/PMC12149598/]
- 54. Analyzing longitudinal trait trajectories using GWAS ... [https://www.nature.com/articles/s41467-024-54483-9]
- 55. Genome-wide association and multi-trait analyses ... [https://www.nature.com/articles/s41467-022-34216-6]
- 56. Comparison of Single-Trait and Multi-Trait Genome-Wide ... [https://www.frontiersin.org/journals/plant-science/articles/10.3389/fpls.2021.772907/full]
- 57. Genome-wide variation study and inter-tissue ... [https://www.nature.com/articles/s41467-024-50809-9]
- 58. GWAS on longitudinal growth traits reveals different genetic ... [https://pmc.ncbi.nlm.nih.gov/articles/PMC6904961/]
- 59. Genome-wide association study dissects genetic architecture ... [https://bmcgenomics.biomedcentral.com/articles/10.1186/s12864-015-1945-y]
- 60. Dissecting the genetic basis of agronomic traits by multi ... [https://link.springer.com/article/10.1007/s42994-025-00241-4]
- 61. Understanding Assay Performance Metrics [https://indigobiosciences.com/understanding-assay-performance-metrics/]
- 62. Avoiding the pitfalls of gene set enrichment analysis with ... [https://bmcbioinformatics.biomedcentral.com/articles/10.1186/s12859-017-1571-6]
- 63. Identification and Validation of Major QTLs, Epistatic ... [https://pmc.ncbi.nlm.nih.gov/articles/PMC8195344/]
- 64. Identification, validation and candidate gene analysis of major ... [https://bmcgenomics.biomedcentral.com/articles/10.1186/s12864-024-10540-7]
- 65. QTL detection and putative candidate gene prediction for ... [https://www.nature.com/articles/s41598-020-75703-4]
- 66. Validating a Major Quantitative Trait Locus and Predicting ... [https://www.frontiersin.org/journals/plant-science/articles/10.3389/fpls.2022.935654/full]
- 67. Linkage Disequilibrium 101: LD Measures & Why It Matters [https://www.cd-genomics.com/pop-genomics/resources/linkage-disequilibrium-overview.html]
- 68. Fine-mapping methods for complex traits - PubMed Central [https://pmc.ncbi.nlm.nih.gov/articles/PMC12636493/]
- 69. PaintorPipe: a pipeline for genetic variant fine-mapping ... [https://pmc.ncbi.nlm.nih.gov/articles/PMC10783948/]
- 70. Fine-mapping methods for complex traits [https://pubmed.ncbi.nlm.nih.gov/41269279/]
- 71. Prioritized candidate causal haplotype blocks in plant genome ... [https://pmc.ncbi.nlm.nih.gov/articles/PMC9612827/]
- 72. GWAS SVatalog: a visualization tool to aid fine-mapping of ... [https://www.nature.com/articles/s41437-025-00809-2]
- 73. PLINK clump [https://zzz.bwh.harvard.edu/plink/clump.shtml]
- 74. Advanced intercross lines, an experimental population for fine genetic mapping - PubMed [https://pubmed.ncbi.nlm.nih.gov/8582624/]
- 75. Advanced Intercross Lines, an Experimental Population for ... [https://pmc.ncbi.nlm.nih.gov/articles/PMC1206841/]
- 76. Advanced intercross lines, an experimental population for ... [https://cris.huji.ac.il/en/publications/advanced-intercross-lines-an-experimental-population-for-fine-gen/]
- 77. Breeding designs for recombinant inbred advanced intercross lines - PubMed [https://pubmed.ncbi.nlm.nih.gov/18505881/]
- 78. Identification of regulatory loci and candidate genes related to ... [https://bmcgenomics.biomedcentral.com/articles/10.1186/s12864-025-11651-5]
- 79. Effect of Population Stratification On False Positive Rates ... [https://pmc.ncbi.nlm.nih.gov/articles/PMC3334349/]
- 80. Correcting for Population Stratification Reduces False ... [https://www.frontiersin.org/journals/genetics/articles/10.3389/fgene.2018.00266/full]
- 81. A Bioinformatics Crash Course for Interpreting Genomics ... [https://pmc.ncbi.nlm.nih.gov/articles/PMC8176646/]
- 82. Genomic Research Data Generation, Analysis and Sharing [https://datascience.codata.org/articles/10.5334/dsj-2017-049]
- 83. Genome-Wide Assessment of Pleiotropy Across >1000 Traits ... [https://pmc.ncbi.nlm.nih.gov/articles/PMC12045404/]
- 84. Genome-wide analyses reveal intricate genetic mechanisms ... [https://jasbsci.biomedcentral.com/articles/10.1186/s40104-025-01245-2]
- 85. DrFARM: identification of pleiotropic genetic variants in ... [https://www.nature.com/articles/s41467-025-60439-4]
- 86. A robust pleiotropy method with applications to lipid traits ... [https://www.sciencedirect.com/science/article/pii/S2666247725001046]
- 87. Pleiotropic genetic association analysis with multiple ... [https://bmcgenomics.biomedcentral.com/articles/10.1186/s12864-023-09820-5]
- 88. Comparison of strategies for identification of regulatory ... [https://pmc.ncbi.nlm.nih.gov/articles/PMC2367462/]
- 89. Exploring the omnigenic architecture of selected complex ... [https://pubmed.ncbi.nlm.nih.gov/40763733/]
- 90. The omnigenic model and polygenic prediction of complex ... [https://www.sciencedirect.com/science/article/pii/S0002929721002718]
- 91. Genome-wide variation study and inter-tissue communication ... [https://pmc.ncbi.nlm.nih.gov/articles/PMC11329784/]
- 92. Accounting for cis-regulatory constraint prioritizes genes likely ... [https://genomebiology.biomedcentral.com/articles/10.1186/s13059-023-02846-8]
- 93. Comparative transcriptomics identifies genes underlying ... [https://bmcgenomics.biomedcentral.com/articles/10.1186/s12864-024-10636-0]
- 94. Detection of the Candidate Genes of Economically Important ... [https://pmc.ncbi.nlm.nih.gov/articles/PMC12474449/]
- 95. A survey of methods and tools to detect recent and strong ... [https://pmc.ncbi.nlm.nih.gov/articles/PMC5385031/]
- 96. Positive selection rather than relaxation of functional ... [https://www.nature.com/articles/cr201644]
- 97. Detecting positive selection in the genome | BMC Biology [https://bmcbiol.biomedcentral.com/articles/10.1186/s12915-017-0434-y]
- 98. Rapid Detection of Positive Selection in Genes and ... [https://pmc.ncbi.nlm.nih.gov/articles/PMC1950645/]
- 99. CEGA: a method for inferring natural selection by comparative ... [https://genomebiology.biomedcentral.com/articles/10.1186/s13059-023-03068-8]
- 100. Immune genes are hotspots of shared positive selection ... [https://elifesciences.org/articles/41815]
- 101. Genome-wide re-sequencing reveals selection signatures ... [https://www.sciencedirect.com/science/article/pii/S0032579124008198]
- 102. Evolution of cis- and trans- regulatory in the chicken... divergence [https://bmcgenomics.biomedcentral.com/articles/10.1186/s12864-019-6342-5]
- 103. Cis- regulatory elements: molecular... | Nature Reviews Genetics [https://www.nature.com/articles/nrg3095?error=cookies_not_supported&code=ced9af32-c9ea-4c5a-a2d6-cc2e7fbd1d98]
- 104. and cis- Enhancer evolution in the human and... divergence regulatory [https://pubmed.ncbi.nlm.nih.gov/26365491/]
- 105. Chicken as biological research model [https://en.wikipedia.org/wiki/Chicken_as_biological_research_model]
- 106. Chicken as a Model Organism [https://www.bosterbio.com/blog/post/chicken-as-a-model-organism?srsltid=AfmBOooSPWPN8ho0TJLOY-3d3u9tinBH1_CtdV9wZ-C3LkS0bdSBwJ3D]
- 107. Chickens as a simple system for scientific discovery [https://pmc.ncbi.nlm.nih.gov/articles/PMC7611830/]
- 108. Chickens as a simple system for scientific discovery [https://www.sciencedirect.com/science/article/abs/pii/S0161589021001024]
- 109. NCAPG Regulates Myogenesis in Sheep, and SNPs ... [https://pmc.ncbi.nlm.nih.gov/articles/PMC10603679/]
- 110. Functional comparison of metabolic networks across species [https://www.nature.com/articles/s41467-023-37429-5]
- 111. Metabolic pathway alignment between species using a ... [https://pmc.ncbi.nlm.nih.gov/articles/PMC2677397/]
- 112. Matching experiments across species using expression ... [https://pmc.ncbi.nlm.nih.gov/articles/PMC3371837/]