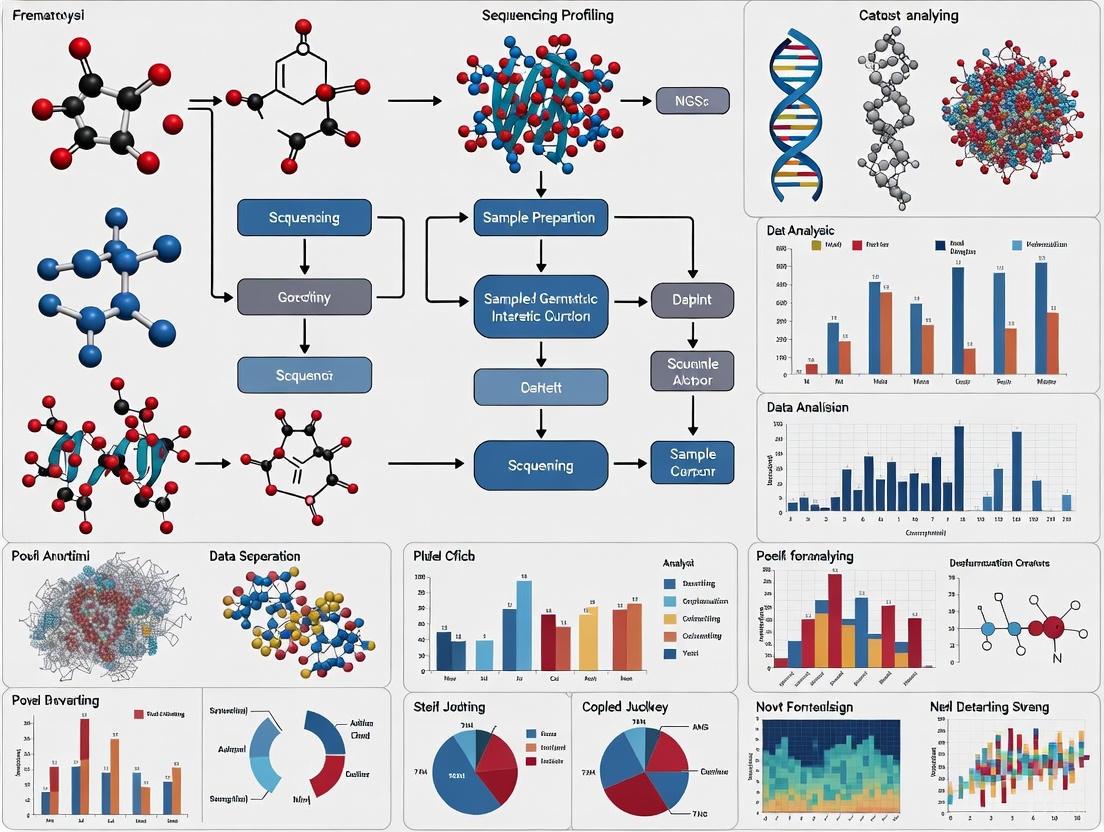
Chemical-Genetic Interaction Profiling in 2025: How NGS is Powering the Next Generation of Drug Discovery
Next-generation sequencing (NGS) has revolutionized chemical-genetic interaction profiling, providing an unparalleled high-throughput lens to decipher how small molecules affect biological systems.
Chemical-Genetic Interaction Profiling in 2025: How NGS is Powering the Next Generation of Drug Discovery
Abstract
Next-generation sequencing (NGS) has revolutionized chemical-genetic interaction profiling, providing an unparalleled high-throughput lens to decipher how small molecules affect biological systems. This article offers researchers, scientists, and drug development professionals a comprehensive guide, from foundational principles to cutting-edge applications. It explores how NGS enables the systematic identification of drug targets and mechanisms of action, details robust methodological workflows for profiling, provides actionable strategies to overcome common data analysis bottlenecks, and validates NGS approaches against traditional methods. By synthesizing these core intents, this article serves as a critical resource for leveraging NGS to accelerate and refine the drug discovery pipeline.
The NGS Revolution: Foundational Principles for Decoding Chemical-Genetic Landscapes
The systematic elucidation of gene function and chemical mechanism of action (MOA) has been revolutionized by fitness-based interaction profiling, a method that quantifies how genetic perturbations alter susceptibility to chemical compounds or other environmental stresses [1]. At the heart of this transformative approach lies the continuous evolution of DNA sequencing technologies, which have progressed from Frederick Sanger's chain-termination method to today's massively parallel next-generation sequencing (NGS) platforms [2] [3]. This technical evolution has enabled unprecedented scalability in profiling chemical-genetic interactions (CGIs), allowing researchers to simultaneously assess thousands of compound-by-mutant combinations in pooled formats [1] [4]. The recent introduction of Roche's Sequencing by Expansion (SBX) technology promises to further accelerate this field by addressing fundamental limitations in signal detection and processing [5] [6] [7]. Within the context of a broader thesis on NGS for chemical-genetic interaction profiling research, this review examines the technical progression of sequencing technologies that underpin this powerful discovery platform, with particular emphasis on their application in drug discovery and functional genomics.
The Sequencing Technology Landscape: From First to Next-Generation
Sanger Sequencing: The Foundational Technology
Sanger sequencing, developed in 1977, established the principle of chain termination using dideoxynucleotide triphosphates (ddNTPs) to halt DNA synthesis at specific bases [3] [8]. This method involves a DNA polymerase reaction incorporating fluorescently-labeled ddNTPs alongside normal dNTPs, generating DNA fragments of varying lengths that are separated by capillary electrophoresis to determine the sequence [8]. Despite its relatively low throughput, Sanger sequencing maintains relevance as a gold standard for validation due to its exceptional accuracy (exceeding 99.99%) and long read lengths (800-1000 bp) [3] [8]. In chemical-genetic interaction studies, it serves primarily for confirming critical hits or validating constructs, while NGS handles the high-throughput discovery screening [8].
Next-Generation Sequencing Platforms
The emergence of NGS in the early 21st century introduced massively parallel sequencing, dramatically increasing throughput while reducing costs [2]. These technologies can be broadly categorized by their underlying biochemistry:
Table 1: Comparison of Major Sequencing Technologies
| Technology | Sequencing Principle | Amplification Method | Read Length | Key Applications in Interaction Profiling |
|---|---|---|---|---|
| Sanger | Chain termination | PCR | 800-1000 bp | Target validation, confirmatory sequencing [3] [8] |
| Illumina | Sequencing by synthesis | Bridge PCR | 36-300 bp | Genome-wide mutant barcode sequencing [2] [1] |
| Ion Torrent | Semiconductor sequencing | Emulsion PCR | 200-400 bp | Targeted interaction screens [2] |
| PacBio SMRT | Real-time sequencing | None | 10,000-25,000 bp | De novo genome assembly for model organisms [2] |
| Oxford Nanopore | Nanopore conductance | None | 10,000-30,000 bp | Direct RNA sequencing, large structural variants [2] |
| Roche SBX | Expansion & nanopore | None | Not specified | Emerging technology for future profiling applications [5] [7] |
Illumina's sequencing-by-synthesis has become the dominant platform for chemical-genetic interaction profiling due to its high accuracy and capacity for multiplexing thousands of samples in a single run [2] [1]. The technology utilizes fluorescently-labeled reversible terminator nucleotides imaged during incorporation on clonally-amplified DNA clusters [2]. This approach enables the highly parallel quantification of genetic barcodes from pooled mutant collections exposed to various compounds [1].
Emerging technologies like Pacific Biosciences' Single Molecule Real-Time (SMRT) sequencing and Oxford Nanopore sequencing offer distinctive advantages for specific applications. PacBio provides exceptionally long reads valuable for de novo genome assembly of model organisms used in screening [2]. Oxford Nanopore's protein nanopores detect nucleotide sequences through changes in ionic current as DNA or RNA molecules pass through, enabling direct RNA sequencing and detection of epigenetic modifications [2].
The following diagram illustrates the evolutionary relationships and core technological principles of major sequencing platforms:
Chemical-Genetic Interaction Profiling: A Technical Workflow
Chemical-genetic interaction profiling represents a powerful application of NGS technology that enables systematic mapping of functional relationships between genes and small molecules [1] [4]. The core methodology involves monitoring the fitness of a pooled collection of genetically barcoded mutants under chemical perturbation, with NGS enabling massively parallel quantification of strain abundances [1].
Experimental Protocol for High-Throughput Profiling
The PROSPECT (PRimary screening Of Strains to Prioritize Expanded Chemistry and Targets) platform exemplifies a sophisticated implementation of this approach for antibiotic discovery in Mycobacterium tuberculosis [4]. The detailed methodology comprises:
Strain Pool Preparation: A collection of hypomorphic M. tuberculosis strains, each engineered for proteolytic depletion of an essential gene and tagged with unique DNA barcodes, is pooled to create the screening library [4].
Chemical Perturbation: The pooled mutant library is exposed to chemical compounds in 96- or 384-well microtiter plates, with each well representing a unique compound-dose combination. Negative control conditions (DMSO-only) are included for baseline comparison [1] [4].
Competitive Growth: Cultures undergo competitive growth for a defined period (typically 48-72 hours), during which strains hypersensitive to specific compounds become depleted in the pool [4].
Barcode Amplification and Sequencing: Genetic barcodes are amplified using indexed primers, creating PCR amplicons that uniquely identify both the mutant strain and experimental condition. These are multiplexed in a single Illumina sequencing run [1] [4].
Data Processing with BEAN-counter: The Barcoded Experiment Analysis for Next-generation sequencing (BEAN-counter) pipeline processes raw sequencing data to quantify barcode abundances, remove low-quality mutants/conditions, and compute interaction z-scores for each mutant-condition pair [1].
Mechanism of Action Prediction: The Perturbagen CLass (PCL) analysis method compares CGI profiles of unknown compounds to a curated reference set of compounds with annotated MOAs, enabling target prediction [4].
The following workflow diagram illustrates the integrated process of chemical-genetic interaction profiling:
The Scientist's Toolkit: Essential Research Reagents
Table 2: Key Research Reagents for Chemical-Genetic Interaction Profiling
| Reagent/Resource | Function | Example Implementation |
|---|---|---|
| Barcoded Mutant Collections | Provides uniquely tagged strains for pooled screening | S. cerevisiae deletion collection (≈4,000 mutants) [1]; M. tuberculosis hypomorph collection (≈600 essential genes) [4] |
| Indexed PCR Primers | Enables multiplexed sequencing of barcodes from different conditions | Illumina-compatible primers with unique index sequences for each sample [1] |
| BEAN-counter Software | Processes raw sequencing data into interaction scores | Python-based pipeline for barcode quantification, normalization, and z-score calculation [1] |
| Reference Compound Set | Enables mechanism of action prediction | Curated collection of 437 compounds with annotated MOAs for M. tuberculosis [4] |
| KAPA Library Preparation Kits | Optimized reagents for NGS library construction | Roche's KAPA products for high-performance DNA and RNA library prep [7] |
Roche's SBX Technology: A Potential Paradigm Shift
Roche's Sequencing by Expansion (SBX) technology represents a novel approach that addresses fundamental signal-to-noise challenges in DNA sequencing [6] [7]. Developed by Mark Kokoris and commercialized following Roche's acquisition of Stratos Genomics in 2020, SBX introduces a unique biochemical process that encodes target DNA sequence information into synthetic surrogate polymers called Xpandomers [6] [7].
Technical Principles of SBX
The SBX method employs a sophisticated two-component system:
Xpandomer Synthesis: Through a proprietary biochemical process, SBX converts native DNA into Xpandomers—expanded surrogate polymers that are approximately fifty times longer than the original DNA molecule. These Xpandomers encode the sequence information into high signal-to-noise reporters, providing clearer signals with minimal background noise [6] [7].
CMOS-Based Detection: The Xpandomers are sequenced using a Complementary Metal Oxide Semiconductor (CMOS)-based sensor module with nanopore detection. This combination enables highly accurate single-molecule sequencing with parallel processing capabilities [7] [9].
The key innovation lies in solving the signal-to-noise challenge that has limited previous sequencing technologies. By creating expanded molecules with larger reporter elements, SBX enhances detection clarity while maintaining sequencing accuracy [6]. This approach enables ultra-rapid, high-throughput sequencing that is both flexible and scalable across different project sizes [7].
Potential Applications in Chemical-Genetic Profiling
While SBX technology is newly unveiled in 2025, its technical capabilities suggest significant potential for chemical-genetic interaction profiling:
Accelerated Screening Cycles: The ultra-rapid sequencing capabilities could reduce the time from sample preparation to genomic analysis from days to hours, potentially increasing screening throughput [7].
Enhanced Multiplexing Capacity: The scalable architecture using CMOS sensor modules may enable processing of larger mutant collections or more complex experimental designs [7] [9].
Integrated Workflows: Compatibility with Roche's AVENIO Edge automated library preparation system could streamline entire profiling workflows from sample to analysis [7].
The progression from Sanger sequencing to NGS platforms has fundamentally transformed chemical-genetic interaction profiling from a targeted, small-scale approach to a comprehensive, systems-level discovery tool. The integration of massively parallel sequencing with pooled mutant screening has enabled the systematic mapping of gene function and compound mechanism of action at unprecedented scale [1] [4]. Emerging technologies like Roche's SBX promise to further accelerate this field by addressing core limitations in signal detection and processing speed [7] [9]. As sequencing technologies continue to evolve, they will undoubtedly unlock new dimensions in our understanding of biological systems and enhance our ability to develop targeted therapeutics for complex diseases. The ongoing integration of these technological advances with sophisticated computational methods like BEAN-counter and PCL analysis represents a powerful paradigm for functional genomics and drug discovery in the coming decade [1] [4].
Chemical-genetic interaction (CGI) profiling represents a powerful systems biology approach that quantifies how genetic alterations modulate cellular responses to chemical compounds. When integrated with next-generation sequencing (NGS) technologies, this method enables high-throughput dissection of compound mechanisms of action (MOA) at unprecedented scale and resolution. This synergy is particularly transformative in antimicrobial discovery, where understanding how small molecules inhibit pathogenic organisms like Mycobacterium tuberculosis (Mtb) is crucial for overcoming drug resistance [4]. The core principle hinges on a simple but profound biological observation: mutants partially depleted of essential gene products (hypomorphs) exhibit heightened sensitivity to compounds that target the corresponding gene product, its pathway, or functionally related processes [4]. NGS acts as the engine for phenotypic readout, precisely measuring the fitness of each mutant in a pooled library under chemical treatment by quantifying the change in abundance of DNA barcodes unique to each strain [4] [10]. This technical guide explores the core concepts, methodologies, and applications of CGI profiling within the broader context of leveraging NGS for modern chemical-genetics research.
Core Principles and Definitions
What is a Chemical-Genetic Interaction?
A chemical-genetic interaction occurs when the effect of a chemical compound on a cell is modulated by a specific genetic alteration. In a typical screening setup, this is measured as a significant deviation in the fitness of a mutant strain compared to a wild-type control when exposed to the compound.
In essential gene knockdowns (hypomorphs), a negative CGI (fitness defect) often suggests the compound's mechanism of action directly or indirectly involves the depleted gene product. The resulting CGI profile for a compound—a vector of fitness scores across hundreds of mutants—serves as a unique, high-dimensional fingerprint that can be used to predict its MOA [4] [11].
The Role of NGS in Phenotypic Readouts
Next-generation sequencing provides the multiplexing capability required to scale CGI profiling to genome-wide levels. Unlike microarray-based detection or manual colony counting, NGS enables the simultaneous tracking of thousands of bacterial mutants in a single pooled experiment through the quantification of unique DNA barcodes associated with each strain [4] [10] [12].
The process, often referred to as Transposon Insertion Sequencing (TnSeq) in prokaryotic systems, involves sequencing the inserts of a saturated transposon mutant library after competitive growth under chemical stress. The change in frequency of each mutant, represented by its barcode count, is calculated as a log~2~ fold change (LFC) or related Z-score, quantifying its relative sensitivity or resistance to the compound [10] [11]. This NGS-based readout provides the quantitative data that forms the basis for all subsequent MOA analysis.
Key Experimental Platforms and Workflows
The PROSPECT Platform for Targeted Screening
A prime example of a focused CGI platform is PROSPECT (PRimary screening Of Strains to Prioritize Expanded Chemistry and Targets). This platform is designed for high-sensitivity primary compound screening while simultaneously providing MOA insights [4].
- Library Design: PROSPECT utilizes a pooled library of M. tuberculosis hypomorphs, each engineered to be proteolytically depleted of a different essential protein. Each strain is tagged with a unique DNA barcode.
- Screening Process: The pooled library is exposed to a chemical compound. Hypomorphs whose depleted proteins are functionally related to the compound's target often show hypersensitivity.
- NGS Readout: Genomic DNA is extracted from the pool before and after compound exposure. The abundance of each barcode is quantified via NGS, generating a fitness profile for the compound across all hypomorphs [4].
Diagram: PROSPECT Screening Workflow
Genome-Wide TnSeq for Unbiased Discovery
For an unbiased, genome-wide survey of intrinsic resistance factors, TnSeq-based CGI profiling is employed. This method uses a highly complex library of random transposon mutants, offering near-complete coverage of non-essential genes and essential gene domains [10].
- Library Construction: A Mariner-based transposon library is created with ~10^5^ unique mutants in M. tuberculosis, achieving approximately 65% coverage of possible insertion sites [10].
- Selection and Sequencing: The library is grown in the presence of a sub-inhibitory concentration of an antibiotic. Genomic DNA is isolated, and the transposon-genome junctions are amplified and sequenced using NGS.
- Data Analysis: Specialized software like TRANSIT analyzes sequence reads to calculate the log~2~ fold change in abundance for each mutant (LTnSeq-FC). A negative LTnSeq-FC indicates a mutant with increased sensitivity, pointing to a gene involved in intrinsic resistance [10].
Data Analysis and MOA Prediction Methods
Reference-Based MOA Prediction with PCL Analysis
Perturbagen CLass (PCL) analysis is a computational reference-based method to infer a compound's MOA by comparing its CGI profile to a curated database of profiles from compounds with known MOAs [4].
- Curated Reference Set: A reference set is assembled, containing hundreds of compounds with published, annotated MOAs (e.g., inhibitors of cell wall synthesis, DNA replication, or respiration).
- Similarity Scoring: The CGI profile (Z-scores or LFCs across all mutant strains) of an uncharacterized compound is compared to every profile in the reference set using similarity metrics.
- MOA Assignment: The compound is assigned the MOA of the reference compound(s) with the most similar profile. This method achieved 69% sensitivity and 87% precision when validating against a set of known GlaxoSmithKline antitubercular compounds [4].
Diagram: PCL Analysis Workflow for MOA Prediction
Deep Learning for CGIP-Based MOA Prediction
Advanced computational methods now leverage graph-based deep learning to predict MOAs directly from chemical structures and CGI profiles (CGIPs) [11].
- Input Representation: Molecular structures are represented as graphs (atoms as nodes, bonds as edges) or via fingerprints (e.g., Morgan Fingerprints).
- Model Architecture: A Directed Message Passing Neural Network (D-MPNN) is used to learn features from the molecular graph. These features are used to predict bioactivity against predefined clusters of functionally related genes.
- Gene Clustering: To improve model efficiency and biological interpretability, genes are first clustered into groups based on the biological similarity of their products, often using homology information from well-annotated model organisms like E. coli [11].
- Output: The model outputs a multi-label prediction, indicating which gene clusters (and thus which biological processes) a compound is likely to inhibit.
Quantitative Data and Performance Metrics
The performance of NGS-based CGI profiling is quantified through its accuracy in predicting known biological mechanisms and its ability to identify novel targets.
Table 1: Performance Metrics of Reference-Based MOA Prediction (PCL Analysis)
| Validation Set | Sensitivity | Precision | Key Outcome |
|---|---|---|---|
| Leave-one-out cross-validation | 70% | 75% | Validated on a curated reference set of 437 known molecules [4] |
| Independent test set (GSK compounds) | 69% | 87% | 75 compounds with known MOA; 29 of 60 predicted QcrB inhibitors validated [4] |
Table 2: Key Quantitative Features in CGI Profile Analysis
| Data Feature | Description | Interpretation |
|---|---|---|
| Log~2~ Fold Change (LFC) | Log~2~ ratio of mutant abundance in treated vs. control samples [11] | Negative LFC indicates hypersensitivity; positive LFC indicates resistance |
| Wald Test Z-score | LFC divided by its standard error [11] | More significant growth inhibition is indicated by smaller (more negative) Z-scores |
| False Discovery Rate (FDR) q-value | Corrected p-value accounting for multiple hypothesis testing [10] | q < 0.05 typically signifies a statistically significant chemical-genetic interaction |
The Scientist's Toolkit: Essential Reagents and Solutions
Successful execution of NGS-based CGI profiling requires a suite of specialized biological and computational reagents.
Table 3: Key Research Reagent Solutions for CGI Profiling
| Reagent / Resource | Function | Application Notes |
|---|---|---|
| Hypomorphic Mutant Library | Collection of strains with inducible depletion of essential genes; each has a unique DNA barcode [4] | Core screening reagent for targeted platforms like PROSPECT |
| Saturated Transposon Mutant Library | Complex library of random transposon insertions for genome-wide screening [10] | Used in TnSeq for unbiased discovery of intrinsic resistance factors |
| NGS Library Prep Kit | Prepares pooled barcode or transposon amplicons for high-throughput sequencing | Must be compatible with the sequencing platform (e.g., Illumina, Ion Torrent) [2] |
| TRANSIT Software | Open-source computational pipeline for TnSeq data analysis [10] | Identifies conditionally essential genes and significant fitness defects |
| Curated MOA Reference Database | Collection of CGI profiles from compounds with validated mechanisms of action [4] | Essential for reference-based prediction methods like PCL analysis |
The integration of chemical-genetic interaction profiling with next-generation sequencing has created a robust framework for elucidating the mechanism of action of small molecules directly in a physiologically relevant, whole-cell context. Platforms like PROSPECT and TnSeq provide complementary strengths, enabling both targeted, high-sensitivity screening and unbiased genome-wide discovery. The resulting high-dimensional CGI profiles serve as rich functional fingerprints, which can be deciphered using computational methods ranging from reference-based similarity matching (PCL analysis) to advanced graph neural networks. As NGS technologies continue to evolve, becoming faster, more accurate, and more cost-effective, their application in chemical genetics will undoubtedly deepen our understanding of biological systems and accelerate the discovery of novel therapeutics, particularly against recalcitrant pathogens like Mycobacterium tuberculosis.
Why NGS? Advantages in Throughput, Cost, and Sensitivity for High-Throughput Screening
Next-Generation Sequencing (NGS) has revolutionized genomics research by providing unparalleled capabilities for analyzing DNA and RNA molecules in a high-throughput and cost-effective manner. [2] This transformative technology has swiftly propelled genomics advancements across diverse domains, but its impact is particularly profound in the field of chemical-genetic interaction (CGI) profiling. In contrast to first-generation Sanger sequencing, which sequences only a single DNA fragment at a time, NGS is massively parallel, sequencing millions of fragments simultaneously per run. [13] This fundamental difference in scale has established NGS as the technological backbone for sophisticated research methodologies like the PRimary screening Of Strains to Prioritize Expanded Chemistry and Targets (PROSPECT) platform, which leverages CGI profiling to elucidate small molecule mechanism of action (MOA) in complex biological systems such as Mycobacterium tuberculosis. [4]
For researchers investigating chemical-genetic interactions, NGS provides three decisive advantages over conventional sequencing: unmatched throughput that enables comprehensive profiling of entire mutant libraries, superior sensitivity for detecting subtle phenotypic changes across genetic variants, and dramatically lower cost-per-sample that makes large-scale screens financially feasible. This technical guide examines these advantages in detail, provides experimental frameworks for implementation, and demonstrates how NGS-powered platforms are accelerating drug discovery through rapid MOA identification.
Core Advantages of NGS in Screening Applications
Unmatched Throughput and Scalability
The massively parallel nature of NGS enables screening capabilities that are simply unattainable with traditional sequencing methods. Where Sanger sequencing interrogates a single gene or small genomic region, targeted NGS can simultaneously sequence hundreds to thousands of genes across numerous samples. [13] This scalability is critical for chemical-genetic interaction studies, which require monitoring thousands of genetic perturbations in response to chemical treatments.
Table 1: Throughput Comparison Between Sanger Sequencing and NGS
| Parameter | Sanger Sequencing | Targeted NGS |
|---|---|---|
| Sequencing Scale | Single DNA fragment at a time | Millions of fragments simultaneously [13] |
| Typical Read Depth | 50-100 reads per sample [13] | Tens to hundreds of thousands of reads per sample [13] |
| Multiplexing Capacity | Limited | High (multiple samples pooled in one run) [13] |
| Genes Interrogated | 1-20 targets cost-effectively [13] | Hundreds to thousands of genes simultaneously [13] |
| Application in CGI | Low throughput, limited discovery power | Comprehensive mutant library profiling |
Enhanced Sensitivity and Discovery Power
NGS provides significantly greater sensitivity for detecting multiple variants across targeted genomic regions. The high sequencing depth achievable with NGS enables detection of low-frequency variants with limits of detection down to 1%, a crucial capability for identifying rare genetic interactions or minor subpopulations in heterogeneous samples. [13] Furthermore, NGS offers greater discovery power—the ability to identify novel variants—and higher mutation resolution that can identify everything from large chromosomal rearrangements down to single nucleotide variants. [13]
In chemical-genetic interaction profiling, this enhanced sensitivity allows researchers to detect even subtle hypersensitivity responses in hypomorphic strains, enabling the discovery of active small molecules that would elude conventional wild-type screening. [4] The PROSPECT platform leverages this capability to identify compounds with previously undetectable activity by measuring minute changes in hypomorph abundance through NGS-based barcode quantification. [4]
Cost-Effectiveness for Large-Scale Studies
While Sanger sequencing remains cost-effective for interrogating small regions (1-20 targets), NGS becomes increasingly economical as scale increases. [13] The paradigm of "do more with less" has been extremely impactful across the research community, enabling more 'omics' data to be generated with higher quality at lower cost. [14] A systematic review of NGS cost-effectiveness in oncology found that targeted panel testing (2-52 genes) reduces costs compared to conventional single-gene assays when four or more genes require testing. [15]
Table 2: Cost-Effectiveness Analysis of NGS vs. Single-Gene Testing
| Testing Scenario | Cost-Effectiveness Outcome | Key Factors |
|---|---|---|
| 1-3 genes | Single-gene testing generally more cost-effective [15] | Lower direct testing costs for simple assays |
| 4+ genes | Targeted NGS panels more cost-effective [15] | Efficiency of simultaneous testing |
| Holistic analysis | NGS consistently provides cost savings [15] | Reduced turnaround time, staff requirements, hospital visits |
| Large panels (hundreds of genes) | Generally not cost-effective for routine use [15] | Higher reagent and analysis costs |
NGS-Driven Methodologies for Chemical-Genetic Interaction Profiling
Experimental Workflow for PROSPECT-Based Screening
The PROSPECT platform represents a cutting-edge application of NGS for chemical-genetic interaction profiling. This systems chemical biology strategy couples small molecule discovery to MOA information by screening compounds against a pooled library of hypomorphic Mycobacterium tuberculosis strains, each engineered to be proteolytically depleted of a different essential protein. [4] The following diagram illustrates the complete experimental workflow:
Diagram 1: PROSPECT Workflow for MOA Identification. This NGS-based approach identifies chemical-genetic interactions by quantifying barcode abundances from pooled hypomorphic strains after small molecule treatment.
Key Research Reagent Solutions for NGS-Based Screening
Successful implementation of NGS-based chemical-genetic interaction profiling requires specialized reagents and tools. The following table details essential components for establishing these screening platforms:
Table 3: Essential Research Reagents for NGS-Based Chemical-Genetic Interaction Profiling
| Reagent/Tool | Function in Experimental Workflow | Application in CGI Profiling |
|---|---|---|
| Hypomorphic Strain Library | Engineered mutants with depleted essential proteins; sensitized background for detecting chemical interactions [4] | Core component of PROSPECT platform; enables detection of compound hypersensitivity |
| DNA Barcodes | Unique nucleotide sequences that tag each strain for multiplexed tracking [4] | Enables quantification of strain abundance in pooled screens via NGS |
| NGS Library Prep Kits | Reagents for fragmenting DNA/RNA, adding adapters, and preparing sequencing libraries [2] | Processes barcode amplicons for high-throughput sequencing |
| Targeted Sequencing Panels | Probes to enrich specific genomic regions of interest; reduce sequencing costs [15] | Focuses sequencing on barcode regions; improves efficiency and cost-effectiveness |
| Automated Liquid Handling | Robotics for consistent sample and reagent dispensing in high-throughput formats [16] | Enables screening of thousands of compound-dose conditions with minimal variability |
| Bioinformatics Pipelines | Computational tools for processing raw NGS data, variant calling, and interaction scoring [2] [14] | Converts sequencing data into chemical-genetic interaction profiles and MOA predictions |
Application in Drug Discovery: From CGI Profiling to Mechanism of Action
Reference-Based MOA Prediction Using PCL Analysis
The true power of NGS in chemical-genetic interaction profiling emerges when the massive datasets are analyzed using sophisticated computational approaches. Perturbagen Class (PCL) analysis represents a reference-based method that infers a compound's mechanism of action by comparing its chemical-genetic interaction profile to those of a curated reference set of known molecules. [4] In practice, researchers have achieved 70% sensitivity and 75% precision in MOA prediction using leave-one-out cross-validation with a reference set of 437 compounds with annotated MOAs. [4]
This approach demonstrates how NGS-derived CGI profiles serve as fingerprints of chemical perturbations, enabling rapid classification of novel compounds without requiring complete understanding of all biological interactions within the cell. The methodology has successfully identified novel inhibitors targeting QcrB, a subunit of the cytochrome bcc-aa3 complex involved in respiration, including the validation of a pyrazolopyrimidine scaffold that initially lacked wild-type activity but was optimized through chemistry efforts to achieve potent antitubercular activity. [4]
Integration with Multiomics and AI for Enhanced Discovery
The future of NGS in chemical-genetic interaction profiling lies in its integration with multiomic datasets and artificial intelligence. The year 2025 is expected to mark a revolution in genomics, driven by the power of multiomics—the integration of genetic, epigenetic, and transcriptomic data from the same sample—and AI-powered analytics. [14] This synergy enables researchers to unravel complex biological mechanisms, accelerating breakthroughs in rare diseases, cancer, and infectious disease research.
AI and machine learning are having a profound impact on the NGS field by helping accelerate biomarker discovery, identify new pathways for drug development, and offer a more defined path toward precision medicine. [14] The intersection of NGS and AI/ML is becoming critical for generating the large datasets required to drive AI-scale breakthroughs, for which the cost and quality of sequencing data will be paramount. [14]
Next-Generation Sequencing has established itself as an indispensable technology for high-throughput screening applications, particularly in the realm of chemical-genetic interaction profiling. The trifecta of advantages—massive parallelization, exceptional sensitivity, and compelling cost-effectiveness at scale—positions NGS as the foundational technology for platforms like PROSPECT that aim to accelerate drug discovery through early MOA identification. As NGS technologies continue to evolve toward long-read sequencing, single-molecule resolution, and tighter integration with multiomics and AI, their impact on understanding chemical-biological interactions will only intensify. For researchers investigating the complex interplay between small molecules and cellular networks, NGS provides the technological framework to move beyond simple potency measurements toward truly mechanism-driven discovery paradigms.
Next-Generation Sequencing (NGS) has revolutionized pharmaceutical research by providing powerful, high-throughput methods to elucidate the complex interactions between chemicals and biological systems. By enabling the detailed profiling of chemical-genetic interactions (CGIs), NGS technologies allow researchers to systematically identify drug targets, decipher mechanisms of action (MOA), and uncover resistance pathways with unprecedented scale and precision [4] [16]. This technical guide explores the core applications of NGS in chemical-genetic interaction profiling, providing methodologies, data interpretation frameworks, and essential tools for researchers in drug discovery and development.
Core Concepts of Chemical-Genetic Interaction Profiling
Chemical-genetic interaction profiling is a powerful systems biology approach that quantifies how genetic alterations modulate the sensitivity of cells to chemical compounds. The core principle is that strains of an organism, each with a different mutated or depleted essential gene, will show differential fitness—hypersensitivity or resistance—when treated with a small molecule. The pattern of these fitness changes across a comprehensive library of mutants, known as the chemical-genetic interaction profile, serves as a unique fingerprint that can reveal the biological pathways affected by the compound [4] [10].
The advent of NGS has been pivotal to this field. It allows for the simultaneous quantification of the abundance of thousands of unique mutants within a pooled screening culture by sequencing DNA barcodes associated with each mutant. This provides a highly sensitive, quantitative, and comprehensive readout of CGI profiles [4] [10]. Platforms like Illumina's sequencing-by-synthesis and PacBio's single-molecule real-time (SMRT) sequencing are commonly employed for their high accuracy and throughput [2].
Application 1: Uncovering Novel Drug Targets
A primary application of NGS-based CGI profiling is the de novo identification of novel drug targets. This is achieved by screening compounds against a comprehensive library of hypomorphic (gene-knockdown) mutants. When a mutant with reduced levels of a specific essential protein is hypersensitive to a compound, it strongly suggests that the compound's target is either that protein, a member of its pathway, or a functionally related pathway [4].
The PROSPECT (PRimary screening Of Strains to Prioritize Expanded Chemistry and Targets) platform in Mycobacterium tuberculosis (Mtb) is a leading example. PROSPECT uses a pooled library of hypomorphic Mtb mutants, each depleted of a different essential protein. The screening readout is a vector of chemical-genetic interactions that can pinpoint the compound's target directly or through pathway context [4].
Case Study: Discovery of a Novel QcrB Inhibitor From a screen of ~5,000 compounds, a novel pyrazolopyrimidine scaffold was identified. Its CGI profile showed high similarity to known inhibitors of the cytochrome bcc-aa₃ complex, a key component in the respiratory chain. The QcrB subunit was predicted as the target. This prediction was subsequently validated by demonstrating that the compound lost activity against strains with a resistant qcrB allele and showed increased activity against a mutant lacking the alternative cytochrome bd oxidase, a hallmark of QcrB inhibitors [4].
Application 2: Elucidating Mechanism of Action
Rapid and accurate mechanism of action (MOA) determination is a major bottleneck in drug discovery. NGS-based CGI profiling addresses this through reference-based computational approaches. The core idea is that compounds with similar MOAs will produce similar CGI profiles. By comparing the profile of an uncharacterized compound to a curated reference set of profiles from compounds with known MOAs, the MOA of the unknown compound can be inferred [4].
Perturbagen CLass (PCL) Analysis This computational method, developed for PROSPECT data, infers a compound's MOA by comparing its CGI profile to a reference set of 437 known molecules. The performance of this approach is robust, as demonstrated in the table below [4].
Table 1: Performance Metrics of PCL Analysis for MOA Prediction
| Validation Method | Sensitivity | Precision | Context |
|---|---|---|---|
| Leave-one-out cross-validation | 70% | 75% | Internal validation with curated reference set |
| Independent test set | 69% | 87% | 75 antitubercular compounds from GSK |
In a practical application on 98 uncharacterized antitubercular compounds from GlaxoSmithKline (GSK), PCL analysis assigned putative MOAs to 60 compounds. Twenty-nine of these, predicted to target bacterial respiration, were functionally validated [4].
Application 3: Deciphering Antimicrobial Resistance Pathways
Understanding intrinsic and acquired resistance mechanisms is critical for combating drug-resistant infections. NGS-based CGI profiling can systematically identify genes that, when mutated, confer increased sensitivity or resistance to an antimicrobial, thus revealing the genetic basis of intrinsic resistance and potential targets for combination therapy [10] [17].
TnSeq for Intrinsic Resistance Determinants A study using Transposon Insertion Sequencing (TnSeq) in Mtb identified mutants with altered fitness under sub-inhibitory concentrations of five antibiotics. The screen identified 251 mutants with significant fitness changes, revealing the cell envelope as a major determinant of antibiotic susceptibility. The analysis identified 17 genes linked to intrinsic resistance to at least 4 of the 5 antibiotics tested. A key finding was FecB, a gene not involved in iron acquisition as previously thought, but a critical mediator of general cell envelope integrity; its mutation led to hypersensitivity to all five antibiotics tested [10].
Table 2: Key Intrinsic Antibiotic Resistance Genes Identified by TnSeq in M. tuberculosis
| Gene | Function | Antibiotic Sensitivity Profile | Validated Role |
|---|---|---|---|
| fecB | Putative iron dicitrate-binding protein | Rifampin, Isoniazid, Ethambutol, Vancomycin, Meropenem | Cell envelope integrity |
| lcp1 | Peptidoglycan-arabinogalactan ligase | Multiple antibiotics | Cell wall synthesis |
| mmaA4 | Mycolic acid synthase | Multiple antibiotics | Mycolic acid synthesis |
| secA2 | Protein translocase | Multiple antibiotics | Protein export |
| caeA/hip1 | Cell envelope-associated protease | Multiple antibiotics | Envelope protein homeostasis |
NGS is also instrumental in identifying resistance mechanisms in cancer. For instance, in HER2-positive gastric cancer, NGS analysis of patient tumors revealed that specific genetic alterations like ERBB2 L755S mutation, CDKN2A insertions, and RICTOR amplification were enriched in patients who did not respond to trastuzumab, uncovering potential drivers of primary resistance [18].
Experimental Protocol: A Representative Workflow
The following detailed protocol outlines a standard workflow for NGS-based chemical-genetic interaction screening, drawing from established methods in mycobacterial research [4] [10].
Stage 1: Library Preparation and Screening
- Pooled Mutant Library Construction: Generate a comprehensive mutant library. For Mtb, this can be a saturated transposon mutant library (e.g., ~10⁵ unique Mariner transposon mutants) or a pooled collection of hypomorphic strains (as in PROSPECT), each with a unique DNA barcode [4] [10].
- Compound Treatment: Inoculate the pooled library into culture medium and divide it into treatment and control arms. Expose the treatment arm to a pre-determined, partially inhibitory concentration of the test compound (causing a 25-40% reduction in overall growth). The control arm grows in the absence of the compound [10].
- Competitive Outgrowth: Allow both cultures to grow for a set number of generations (e.g., ~6.5 generations, resulting in a 100-fold population expansion) to enable fitness differences between mutants to become apparent [10].
- Genomic DNA Extraction and Barcode Amplification: Harvest cells from both cultures. Extract genomic DNA and use PCR to amplify the unique barcodes from each mutant with primers that also add Illumina sequencing adapters [4] [19].
Stage 2: Sequencing and Data Analysis
- High-Throughput Sequencing: Pool the amplified barcode libraries from control and treated samples and sequence them on an NGS platform such as an Illumina NextSeq or NovaSeq, following color balance best practices to ensure high-quality data [4] [20].
- Sequence Alignment and Quantification: Demultiplex the sequencing reads and map them to a reference file of known barcodes to obtain a count for each mutant in the control and treated samples [19].
- Fitness Calculation: For each mutant, calculate a fitness score. This is typically the Log₂ Fold Change (LTnSeq-FC) in its abundance in the treated library compared to the control library. A negative score indicates hypersensitivity, while a positive score indicates resistance [10].
- Statistical Analysis: Use specialized software like TRANSIT (for TnSeq data) to perform statistical testing (e.g., resampling or ZINB methods) to identify mutants with fitness scores that are significantly different from the neutral expectation [10].
Stage 3: Interpretation and Target Prediction
- Profile Generation and Clustering: Compile the significant fitness scores for all mutants into a single CGI profile for the compound. Use hierarchical clustering to compare and group compounds with similar profiles [10].
- Reference-Based MOA Prediction: Compare the compound's CGI profile to a curated reference database of profiles from compounds with known MOAs using a method like PCL analysis to generate a hypothesis about its MOA [4].
- Functional Validation: Conduct downstream experiments to confirm the predicted target or MOA. This may include:
- MIC Shift Assays: Determine the minimum inhibitory concentration (MIC) against individual deletion mutants predicted to be hypersensitive [10].
- Resistance Mutant Isolation: Generate spontaneous resistant mutants and sequence their genomes to identify mutations in the putative target gene [4].
- Biochemical Assays: Demonstrate direct binding or inhibition of the purified target protein [4].
The Scientist's Toolkit: Essential Research Reagents and Solutions
Table 3: Key Research Reagents and Kits for NGS-Based CGI Profiling
| Item | Function | Example Product/Source |
|---|---|---|
| NGS Library Prep Kit | Prepares DNA barcodes for sequencing by adding adapters and indices. | Illumina DNA Prep [17] |
| Targeted Sequencing Panel | For focused sequencing of resistance genes or specific genomic regions. | AmpliSeq for Illumina Antimicrobial Resistance Panel (targets 478 AMR genes) [17] |
| Unique Dual Index (UDI) Kits | Allows multiplexing of many samples by tagging each with a unique barcode pair, minimizing index hopping. | Illumina UD Index Plates, NEXTFLEX UDI Adapters [20] |
| Whole-Genome Sequencing Kit | For comprehensive genome analysis to identify resistance mutations in evolved strains. | Illumina Microbial WGS solutions [17] [21] |
| TnSeq Analysis Software | Statistical tool for identifying essential genes and conditionally important genes from TnSeq data. | TRANSIT [10] |
The integration of NGS into chemical-genetic interaction profiling has created a powerful, data-driven pipeline for modern drug discovery and development. By systematically linking chemical perturbations to genetic backgrounds, this approach accelerates the identification of novel targets, deconvolutes the mechanism of action of new chemical entities, and reveals the complex networks underlying drug resistance, ultimately contributing to the development of more effective therapeutics.
From Cells to Data: Methodological Workflows and Real-World Applications in Drug Development
Next-generation sequencing (NGS) has revolutionized genomics research by providing unprecedented capacity to analyze genetic material in a high-throughput and cost-effective manner [2]. In the specific context of chemical-genetic interaction profiling, which seeks to understand how genetic background influences response to chemical compounds, the choice of sequencing approach is paramount. Each method—whole-genome sequencing (WGS), whole-exome sequencing (WES), and targeted sequencing—offers distinct advantages and limitations that must be carefully balanced against research goals, resources, and analytical capabilities [22] [23] [24]. This technical guide provides a structured framework for selecting the optimal NGS approach to illuminate the complex relationships between genetics and chemical response, ultimately accelerating drug discovery and development.
Technical Comparison of NGS Approaches
The three primary NGS approaches interrogate different portions of the genome with varying levels of comprehensiveness and resolution. Understanding their technical specifications is the first step in experimental design.
Table 1: Technical Specifications of WGS, WES, and Targeted Sequencing
| Parameter | Whole-Genome Sequencing (WGS) | Whole-Exome Sequencing (WES) | Targeted Sequencing Panels |
|---|---|---|---|
| Sequencing Region | Entire genome (coding + non-coding) [24] [25] | Protein-coding exons only (~2% of genome) [23] [24] | Selected genes/regions of interest [22] [25] |
| Approximate Region Size | 3 Gb (human) [23] | ~30 Mb [23] | Tens to thousands of genes [23] |
| Typical Sequencing Depth | > 30X [23] | 50-150X [23] | > 500X [23] |
| Data Output per Sample | > 90 GB [23] | 5-10 GB [23] | Varies, but significantly less than WES [24] |
| Detectable Variants | SNPs, InDels, CNVs, Structural Variants, Fusions [23] | SNPs, InDels, some CNVs, Fusions [23] | SNPs, InDels, CNVs, Fusions [23] |
Table 2: Strategic Advantages and Limitations in Drug Research Context
| Aspect | Whole-Genome Sequencing (WGS) | Whole-Exome Sequencing (WES) | Targeted Sequencing Panels |
|---|---|---|---|
| Primary Strengths | Most comprehensive view; detects variants in regulatory regions and structural variants; enables novel discovery [24] [25]. | Cost-effective for coding regions; high depth on known disease-associated areas; simpler data analysis [22] [24]. | Highest depth for sensitive mutation detection; most cost-effective for focused questions; simplest data handling [22] [25]. |
| Key Limitations | Highest cost; massive data storage/analysis challenges; may generate more false positives for low-frequency variants [22] [24]. | Misses non-coding and regulatory variants; low sensitivity for structural variants; coverage uniformity issues [22] [24]. | Limited to pre-defined genes; impossible to re-analyze for genes not on the panel after sequencing [22]. |
| Ideal for Drug Discovery Phase | Target identification & novel biomarker discovery [16] [26]. | First-tier test for rare diseases and validating targets in coding regions [22] [21]. | Patient stratification, therapy selection, and pharmacogenomics in clinical trials [27] [16]. |
Experimental Design Framework
Selecting the optimal sequencing approach requires a systematic evaluation of the research objective. The following decision framework and workflow can guide this process.
Defining the Research Objective
The first step is to articulate the precise scientific question, as this directly dictates the most suitable NGS method.
- Target Identification and Novel Biomarker Discovery: If the goal is to uncover novel genetic associations with drug response, including variations in non-coding regulatory regions, promoter sites, or intergenic regions that might influence gene expression, WGS is the unequivocal choice [16] [26]. Its unbiased nature allows for hypothesis-free exploration, which is critical in the early stages of discovery.
- Validation and Association in Coding Regions: For studies focused on validating targets where the hypothesis is confined to protein-altering variants, or for large-cohort association studies where cost-effectiveness is key, WES provides an optimal balance of comprehensiveness and practicality [22] [24]. It is particularly powerful for rare disease diagnosis and identifying pathogenic coding variants linked to drug efficacy or adverse events [22].
- Clinical Diagnostics and High-Throughput Screening: When the application demands high-throughput, cost-effective screening of specific gene sets—such as in patient stratification for clinical trials, companion diagnostic development, or monitoring minimal residual disease—targeted panels are the most efficient tool [27] [16] [21]. Their high depth allows for sensitive detection of low-frequency variants in a defined genetic space.
Practical Considerations and Constraints
Beyond the research question, several practical factors critically influence the decision.
- Budget and Resources: The total cost includes not only sequencing but also data storage, transfer, and computational analysis. WGS generates data an order of magnitude larger than WES, requiring significant investment in bioinformatics infrastructure and expertise [22] [24]. Targeted panels minimize these downstream costs.
- Data Analysis Expertise: The complexity of data analysis escalates from targeted panels to WES to WGS. Interpreting non-coding variants from WGS remains particularly challenging due to insufficient research on these regions [22] [28]. The availability of bioinformatics support is a crucial deciding factor.
- Sample Throughput and Timelines: For studies requiring rapid turnaround on hundreds or thousands of samples, the streamlined data analysis of targeted panels and, to a lesser extent, WES, offers a significant logistical advantage over WGS.
Methodologies for Key Experiments in Drug Development
The following section outlines detailed protocols for applying these NGS approaches to common scenarios in chemical-genetic interaction research.
Protocol 1: Unbiased Target Identification Using WGS
Objective: To identify novel genetic variants (SNPs, indels, SVs) across the entire genome associated with resistance or sensitivity to a lead compound [16] [26].
Workflow:
- Sample Preparation: Extract high-quality genomic DNA from case (e.g., drug-resistant cell lines or patient samples) and control (e.g., drug-sensitive) groups.
- Library Construction: Fragment DNA and prepare sequencing libraries using standard kits (e.g., Illumina DNA Prep). Avoid amplification if possible to reduce bias.
- Sequencing: Sequence on a platform capable of long-insert paired-end reads (e.g., Illumina NovaSeq) to a minimum depth of 30X for confident variant calling and structural variant detection [23].
- Bioinformatics Analysis:
- Primary & Secondary Analysis: Perform quality control (FastQC), align reads to a reference genome (BWA-MEM), and call variants (GATK) for SNPs/indels. Use specialized tools (e.g., Manta, DELLY) for structural variant calling [28].
- Tertiary Analysis: Annotate variants (ANNOVAR, VEP). Integrate with functional genomics data (e.g., ChIP-Seq, ATAC-Seq) to prioritize non-coding variants affecting regulatory elements. Conduct pathway enrichment analysis (GO, KEGG) to identify biological processes enriched for mutations in the case group.
Protocol 2: Profiling Coding Variants for Mechanism of Action Using WES
Objective: To comprehensively profile coding variants and expression changes in a large set of tumor samples to understand drug mechanism of action and identify patient subgroups [27] [21].
Workflow:
- Sample Preparation: Extract DNA and RNA from matched tumor and normal samples (e.g., FFPE tissue).
- Library Preparation & Target Enrichment:
- For DNA: Prepare libraries and perform hybridization-based capture using a whole-exome probe set (e.g., Illumina Nexome, Roche KAPA HyperExome).
- For RNA: Prepare RNA-Seq libraries to correlate genetic variants with gene expression changes.
- Sequencing: Sequence to a high depth of coverage (>100X for DNA) to reliably detect somatic mutations present in a subpopulation of cells [23].
- Bioinformatics Analysis:
- DNA Analysis: Align sequences, call variants, and filter for somatic mutations by comparing tumor vs. normal. Focus on protein-coding consequences (missense, nonsense, splice-site).
- RNA Analysis: Align RNA-Seq reads, quantify gene expression (FPKM/TPM), and perform differential expression analysis between genetic subgroups.
- Integration: Correlate specific mutations with transcriptional profiles to infer pathway activation and propose drug combination strategies.
Protocol 3: High-Throughput Pharmacogenomic Screening Using Targeted Panels
Objective: To rapidly screen clinical trial participants for pre-defined pharmacogenomic markers that predict drug response or risk of adverse events [27] [16].
Workflow:
- Panel Selection: Choose a clinically validated targeted panel that encompasses genes relevant to the drug's metabolism (e.g., CYP450 family), mechanism of action, and known toxicity pathways.
- Library Preparation: Use a multiplex PCR or hybridization-based approach for target enrichment. This workflow is highly amenable to automation in 96- or 384-well plates.
- Sequencing: Sequence on a benchtop instrument (e.g., Illumina MiSeq) to a very high depth (>500X) to enable ultra-sensitive detection of low-allele-fraction variants [23].
- Bioinformatics & Reporting: Use a streamlined, validated bioinformatics pipeline for rapid turnaround. The analysis is focused on a shortlist of clinically actionable variants. Generate a clear report for each sample to guide patient stratification or dosing decisions.
The Scientist's Toolkit: Essential Research Reagents and Platforms
Successful execution of NGS experiments relies on a suite of trusted reagents, platforms, and software.
Table 3: Key Research Reagent Solutions for NGS Experiments
| Category | Item | Function in Workflow |
|---|---|---|
| Library Prep | KAPA HyperPrep Kit | Construction of sequencing-ready libraries from genomic DNA. |
| Target Enrichment | Illumina Nextera Flex for EnrichmentRoche KAPA HyperExome Probe Panels | Hybridization-based capture of whole exome or custom gene panels. |
| Sequencing Platforms | Illumina NovaSeq & MiSeqPacBio Sequel & OnsoOxford Nanopore PromethION | High-throughput short-read, accurate long-read, and real-time sequencing, respectively [2]. |
| Bioinformatics Tools | Illumina DRAGEN PlatformGATKANNOVAR | Accelerated secondary analysis; variant calling and filtering; functional annotation of variants [21] [28]. |
| Data Management | DNAnexus, Seven Bridges Genomics | Cloud-based platforms for secure, scalable, and reproducible NGS data analysis [28]. |
The strategic selection between WGS, WES, and targeted sequencing is a cornerstone of effective experimental design in chemical-genetic interaction research. WGS offers an unparalleled comprehensive view for discovery, WES provides a cost-effective balance for coding region analysis, and targeted panels deliver precision and depth for applied clinical questions. By aligning the research objective with the technical capabilities and practical constraints of each method, scientists can robustly profile genetic interactions with chemical compounds, thereby de-risking and accelerating the entire drug development pipeline. As sequencing technologies continue to advance and computational tools become more sophisticated, the integration of these multi-scale genomic approaches will undoubtedly yield deeper insights and more personalized therapeutic interventions.
Next-generation sequencing (NGS) has revolutionized genomic research, providing a high-throughput, cost-effective method for deciphering genetic information [12]. This technical guide details the core Illumina NGS workflow, a foundational technology enabling sophisticated research approaches such as chemical-genetic interaction (CGI) profiling, which is critical for elucidating small molecule mechanisms of action in drug discovery [4].
Library Preparation: From Sample to Sequence-Ready Fragments
Library preparation is the critical first step that converts a generic nucleic acid sample into a platform-specific, sequence-ready library [29]. This process ensures that DNA or RNA fragments can be efficiently recognized and sequenced by the NGS instrument.
Detailed Methodology
The standard library preparation protocol involves a series of enzymatic and purification steps [29] [30]:
- Fragmentation: Isolated genomic DNA is fragmented into smaller, manageable pieces. This can be achieved through:
- Physical Methods: Such as sonication (using sound waves) or acoustic shearing.
- Enzymatic Methods: Using transposases that simultaneously fragment and tag the DNA with adapter sequences, streamlining the workflow. The optimal fragment size range is typically 100–800 base pairs, depending on the application [30].
- Adapter Ligation: Special oligonucleotide sequences, known as adapters, are ligated to both ends of the fragmented DNA. These adapters are multifunctional [30]:
- Platform Binding: Contain sequences complementary to the oligonucleotides bound on the flow cell.
- Sequencing Primers: Provide the binding sites for the primers used in the sequencing-by-synthesis reaction.
- Sample Indexing: Include unique molecular barcodes (indexes) that allow multiple libraries to be pooled and sequenced simultaneously in a single run (multiplexing), then computationally separated after sequencing.
- Library Amplification & Quality Control: The adapter-ligated fragments are amplified by PCR to generate a sufficient quantity of the library for sequencing. Finally, the prepared library is quantified using methods like fluorometry or qPCR to ensure optimal loading onto the sequencer [29].
Diagram: The NGS Library Preparation Workflow
Application in Chemical-Genetic Profiling
In CGI profiling studies like the PROSPECT platform, library preparation is performed not on the human genome, but on the DNA barcodes of a pooled microbial mutant library [4]. Each mutant strain, engineered with a unique DNA barcode, is pooled and subjected to a small molecule. After exposure, genomic DNA is extracted, and the barcode regions are specifically amplified and prepared for NGS. The change in abundance of each barcode, measured by sequencing, reveals which genetic mutants are most sensitive or resistant to the compound, providing a "fitness profile" that serves as a fingerprint for its mechanism of action [4].
Cluster Generation: In Situ Amplification on the Flow Cell
Before sequencing can begin, the library must be clonally amplified to create strong enough signals for detection. On Illumina platforms, this is achieved through cluster generation on a flow cell [29].
Detailed Methodology: Bridge Amplification
The process of bridge amplification occurs on a glass flow cell coated with oligonucleotides complementary to the library adapters [29].
- Loading and Annealing: The diluted library is loaded onto the flow cell. Single-stranded DNA fragments from the library bind randomly to the complementary primers on the flow cell surface.
- Bridge Formation and Amplification: The flow cell is flooded with enzymes and nucleotides for PCR. The bound template bends over and "bridges" to an adjacent complementary primer on the flow cell surface, forming a double-stranded bridge.
- Denaturation and Cycling: The double-stranded bridge is denatured, leaving two single-stranded copies attached to the flow cell. This process repeats over many cycles, with each copy creating new bridges with nearby primers, ultimately amplifying a single original fragment into a dense, clonal cluster containing millions of identical copies.
Diagram: Cluster Generation via Bridge Amplification
Sequencing by Synthesis: The Core Imaging Technology
Sequencing by Synthesis (SBS) is the biochemistry that enables the simultaneous, massive parallel sequencing of all clusters on the flow cell [29] [12]. Illumina's method utilizes fluorescently labeled, reversibly terminated nucleotides.
Detailed Methodology: Cyclic Reversible Termination
The SBS process is a cyclic, automated process occurring inside the sequencer [29]:
- Nucleotide Incorporation: All four fluorescently labeled dNTPs (each with a distinct color) are flowed into the flow cell simultaneously. Each nucleotide also contains a reversible terminator, which blocks the addition of the next nucleotide after a single base is incorporated. DNA polymerase adds a single nucleotide to each growing DNA strand complementary to the template.
- Imaging: After incorporation, unincorporated nucleotides are washed away. The flow cell is then imaged with lasers. The fluorescent color detected at each cluster identifies the base that was just incorporated.
- Cleavage: The fluorescent dye and the terminator group are chemically cleaved from the nucleotide, leaving a native DNA strand and removing the block to further synthesis.
- Cycle Repetition: Steps 1-3 are repeated "n" times to achieve a read length of "n" bases. This cyclic process generates millions of short sequences, or "reads," in parallel.
Diagram: Sequencing by Synthesis Chemistry
Application in Chemical-Genetic Profiling
In the PROSPECT platform, SBS is used to quantitatively sequence the DNA barcodes from the pooled mutant library [4]. The raw output is a digital count of reads per barcode, which is proportional to the abundance of that mutant in the pool after compound treatment. By comparing barcode counts from compound-treated samples to untreated controls, a quantitative chemical-genetic interaction profile is generated for each small molecule. Computational methods like Perturbagen Class (PCL) analysis then compare these profiles to a reference database of compounds with known mechanisms to predict the target of uncharacterized molecules [4].
Quantitative Data and Platform Comparisons
The NGS workflow generates massive amounts of data. Key quantitative metrics and a comparison of sequencing technologies are summarized below.
Table 1: Key Quantitative Outputs from an NGS Run
| Metric | Description | Typical Range/Value |
|---|---|---|
| Read Length | Length of a single DNA fragment read. | 36-300 bp (Short-Read) [2] |
| Read Depth | Number of times a genomic region is sequenced. | Varies by application (e.g., 30x for WGS) |
| Throughput | Total data generated per run. | 300 kilobases to multiple Terabases [12] |
| Accuracy | Raw accuracy per base. | >99.9% (Q30 score) [30] |
| Q30 Score | Quality score indicating a 0.1% error rate. | Industry standard for high-quality data [30] |
Table 2: Comparison of Short-Read Sequencing Platforms
| Platform | Sequencing Technology | Amplification Type | Read Length (bp) | Key Limitations [2] |
|---|---|---|---|---|
| Illumina | Sequencing by Synthesis | Bridge PCR | 36-300 | Overcrowding can spike error rate to ~1% |
| Ion Torrent | Semiconductor (H+ detection) | Emulsion PCR | 200-400 | Signal degradation with homopolymer sequences |
| 454 Pyrosequencing | Pyrosequencing (PPi detection) | Emulsion PCR | 400-1000 | Insertion/deletion errors in homopolymers |
| SOLiD | Sequencing by Ligation | Emulsion PCR | 75 | Substitution errors, under-represents GC-rich regions |
The Scientist's Toolkit: Essential Research Reagent Solutions
Successful execution of the NGS workflow relies on a suite of specialized reagents and kits.
Table 3: Essential Reagents for NGS Workflows
| Item | Function | Application in Chemical-Genetic Profiling |
|---|---|---|
| Nucleic Acid Isolation Kits | Extract high-quality, pure DNA/RNA from sample source. | Extracting genomic DNA from pooled microbial mutant cultures [4]. |
| Library Prep Kits | Fragment DNA/RNA and ligate platform-specific adapters. | Preparing sequencing libraries from amplified barcode regions [4]. |
| PCR Enzymes & Master Mixes | Amplify adapter-ligated libraries or specific target regions. | Amplifying mutant barcodes prior to library prep [29]. |
| Indexing (Barcoding) Oligos | Unique nucleotide sequences to tag individual samples. | Multiplexing hundreds of compound screens in a single sequencing run [30]. |
| Target Enrichment Probes | Biotinylated probes to capture genomic regions of interest. | Not typically used; PROSPECT relies on whole-barcode sequencing [4]. |
| Quality Control Kits | Fluorometric or qPCR-based kits for quantifying libraries. | Ensuring accurate library quantification before loading onto the flow cell [29]. |
| Sequencing Chemistries | Reagent kits containing enzymes and nucleotides for SBS. | Essential for all sequencing runs to generate the interaction profile data [12]. |
The standardized NGS workflow of library preparation, cluster generation, and sequencing by synthesis provides a powerful and reliable engine for modern genomics. By enabling the quantitative, parallel analysis of millions of DNA fragments, it forms the technological foundation for advanced research methodologies like chemical-genetic interaction profiling. This application directly accelerates drug discovery by providing deep mechanistic insights into compound action, facilitating the prioritization of hits, and guiding the development of novel therapeutics against critical targets such as Mycobacterium tuberculosis [4]. As NGS technology continues to evolve towards greater speed, lower cost, and longer reads, its impact on functional genomics and personalized medicine will only intensify.
The selection of an appropriate next-generation sequencing (NGS) platform is a critical decision that directly impacts the quality, depth, and applicability of data generated in chemical-genetic interaction profiling research. This field, which systematically explores how genetic perturbations influence cellular responses to chemical compounds, demands sequencing technologies that can deliver specific capabilities ranging from high accuracy to long read lengths. The current NGS landscape features established second-generation short-read technologies from Illumina, third-generation long-read platforms from PacBio and Oxford Nanopore Technologies (ONT), and the emerging Sequencing by Expansion (SBX) technology from Roche. Each technology presents distinct trade-offs in terms of read length, accuracy, throughput, cost, and operational flexibility, making platform selection highly dependent on specific research objectives and experimental constraints.
Chemical-genetic interaction studies have been transformed by NGS, enabling high-throughput assessment of how chemical compounds affect pools of genetically barcoded mutants. Technologies such as QMAP-Seq (Quantitative and Multiplexed Analysis of Phenotype by Sequencing) leverage Illumina-based sequencing to precisely measure how drug response changes across hundreds of genetic perturbations simultaneously [31]. Similarly, the PROSPECT platform (PRimary screening Of Strains to Prioritize Expanded Chemistry and Targets) utilizes NGS to identify chemical-genetic interactions in Mycobacterium tuberculosis by tracking the abundance of DNA barcodes in hypomorphic strains after compound treatment [4]. As these applications continue to evolve, understanding the technical capabilities and limitations of available sequencing platforms becomes essential for designing effective experiments and accurately interpreting results in chemical-genetic research.
Technology Comparison & Performance Metrics
Core Sequencing Technologies
Illumina technology employs sequencing-by-synthesis with bridge amplification, generating billions of short reads (typically 50-300 bp) with exceptional accuracy exceeding 99.9% [32]. This high accuracy makes it particularly suitable for applications requiring precise variant detection, such as single-nucleotide polymorphism identification in chemical-genetic interaction studies. However, its short read length presents challenges for resolving complex genomic regions or detecting large structural variations that may be relevant in drug response studies.
PacBio Single Molecule, Real-Time (SMRT) sequencing generates long reads averaging 15-20 kb through its circular consensus sequencing (CCS) approach, which produces high-fidelity (HiFi) reads with accuracy exceeding 99.9% by repeatedly sequencing the same molecule [33] [32]. This combination of long reads and high accuracy enables precise resolution of complex genomic regions, making it valuable for identifying structural variants and haplotype phasing in chemical-genetic studies.
Oxford Nanopore Technologies (ONT) utilizes protein nanopores to sequence single DNA or RNA molecules in real-time as they pass through the pore, producing ultra-long reads that can exceed 100 kb [32]. While historically associated with higher error rates, recent improvements in chemistry (R10.4.1 flow cells) and basecalling algorithms have increased accuracy to over 99% [33]. The platform's ability to perform real-time sequencing and its extreme portability (particularly the MinION device) offer unique experimental flexibility.
Roche SBX (Sequencing by Expansion), scheduled for launch in 2026, represents a novel approach that converts DNA information into a longer "expanded" molecule (Xpandomer) before sequencing through proprietary nanopores [34] [35]. This technology is designed to offer a combination of high accuracy (>99.8% for SNVs), flexible read lengths (50bp to >1000bp), and very high throughput, potentially making it suitable for large-scale chemical-genetic interaction studies when it becomes commercially available [34].
Quantitative Performance Comparison
Table 1: Technical Specifications of Major Sequencing Platforms
| Platform | Read Length | Accuracy | Throughput Range | Run Time | Key Applications in Chemical-Genetic Research |
|---|---|---|---|---|---|
| Illumina | 50-300 bp | >99.9% | 0.1M - 5B reads | 1-3.5 days | QMAP-Seq [31], PROSPECT [4], targeted NGS for drug resistance [36] |
| PacBio | 15-20 kb (HiFi) | >99.9% (HiFi) | 0.5-4M reads (Revio) | 0.5-30 hours | Full-length 16S rRNA sequencing [33], structural variant detection, haplotype phasing |
| Oxford Nanopore | Up to 100+ kb | >99% (latest) | 10-290 Gb (PromethION) | Real-time (minutes to days) | Full-length 16S rRNA sequencing [37], direct RNA sequencing, rapid diagnostics |
| Roche SBX | 50-1000+ bp | >99.8% (SNV) | Up to 5B duplex reads/hour | <5 hours (workflow) | Whole genome sequencing (planned) [34] [35], rapid clinical applications |
Table 2: Performance in Microbial Community Profiling (16S rRNA Sequencing)
| Platform | Target Region | Species-Level Classification Rate | Key Findings in Comparative Studies |
|---|---|---|---|
| Illumina | V3-V4 (300-600 bp) | 47-48% | Clear clustering by soil type except for V4 region alone (p=0.79) [33] |
| PacBio | Full-length (1.4 kb) | 63% | Comparable to ONT, slightly better at detecting low-abundance taxa [33] |
| Oxford Nanopore | Full-length (1.4 kb) | 76% | Highest species-level resolution despite higher error rate [37] |
Performance characteristics vary significantly across platforms depending on the specific application. In 16S rRNA sequencing for microbiome studies, which shares methodological similarities with barcode sequencing in chemical-genetic interaction profiling, ONT demonstrated the highest species-level classification rate at 76%, followed by PacBio at 63%, and Illumina at 47-48% [37]. Notably, a comparative study of soil microbiomes found that both PacBio and ONT provided comparable assessments of bacterial diversity, with PacBio showing slightly higher efficiency in detecting low-abundance taxa [33]. Importantly, the study demonstrated that regardless of the sequencing technology used, microbial community analysis ensured clear clustering of samples based on soil type, with the exception of the V4 region alone where no soil-type clustering was observed (p=0.79) [33].
Applications in Chemical-Genetic Interaction Profiling
Established Methodologies and Workflows
Chemical-genetic interaction profiling has emerged as a powerful strategy for elucidating compound mechanism of action and gene function. The QMAP-Seq (Quantitative and Multiplexed Analysis of Phenotype by Sequencing) platform exemplifies how Illumina sequencing enables large-scale chemical-genetic studies in mammalian systems [31]. This approach leverages short-read sequencing to quantify the abundance of genetic barcodes in pooled cell populations following chemical treatment, generating precise quantitative measures of drug response across thousands of genetic perturbations simultaneously.
The typical QMAP-Seq workflow involves: (1) engineering barcoded cell lines with inducible genetic perturbations (e.g., CRISPR-Cas9 knockouts); (2) treating pooled cells with compound libraries across multiple doses; (3) preparing crude cell lysates with spike-in standards for quantification; (4) amplifying target barcodes with indexed primers for multiplexing; and (5) sequencing on Illumina platforms with a single-read strategy to capture sgRNA and cell line barcodes [31]. The resulting data enables quantification of chemical-genetic interactions through comparison of barcode abundances between treated and control samples, revealing both synthetic lethal and synthetic rescue interactions that provide insights into drug mechanism of action.
Similarly, the PROSPECT (PRimary screening Of Strains to Prioritize Expanded Chemistry and Targets) platform employs Illumina sequencing to identify chemical-genetic interactions in Mycobacterium tuberculosis [4]. This system screens compounds against a pool of hypomorphic Mtb strains, each depleted of a different essential protein, using NGS to quantify changes in strain-specific DNA barcodes after compound treatment. The resulting chemical-genetic interaction profiles serve as fingerprints for mechanism of action prediction through comparison to reference compounds with known targets.
Workflow Visualization
Diagram 1: Chemical-genetic interaction profiling workflow using NGS. This generalized workflow underpins platforms like QMAP-Seq [31] and PROSPECT [4].
Experimental Design & Implementation
Platform Selection Guidelines
Selecting the appropriate sequencing platform for chemical-genetic interaction research requires careful consideration of multiple experimental parameters. For large-scale chemical-genetic screens involving thousands of compound-genotype combinations, Illumina platforms offer the required throughput, accuracy, and cost-effectiveness for barcode sequencing applications [31] [4]. The high accuracy of Illumina sequencing (>99.9%) is particularly important for distinguishing subtle differences in barcode abundance that indicate chemical-genetic interactions.
For applications requiring long-range sequencing to resolve complex genomic regions or detect structural variants resulting from chemical treatments, PacBio HiFi reads provide the combination of length and accuracy needed [33] [32]. Similarly, when real-time analysis or rapid turnaround is critical for experimental decision-making, Oxford Nanopore platforms offer unique advantages due to their streaming data capabilities [32].
The emerging Roche SBX technology promises to deliver an exceptional combination of accuracy, speed, and throughput when it becomes commercially available, potentially enabling ultra-rapid chemical-genetic profiling for time-sensitive applications [34] [35]. Its demonstrated ability to generate variant call files in less than 5 hours could significantly accelerate therapeutic discovery pipelines.
Research Reagent Solutions
Table 3: Essential Research Reagents for Chemical-Genetic Interaction Studies
| Reagent/Category | Specific Examples | Function in Experimental Workflow |
|---|---|---|
| Genetic Perturbation Tools | CRISPR-Cas9 systems, hypomorphic strains [4] [31] | Introduction of specific genetic modifications to test gene-compound interactions |
| Barcoding Systems | lentiGuide-Puro plasmid with cell line barcodes [31], hypomorph-specific DNA barcodes [4] | Unique identification of different genetic variants in pooled screens |
| Quantification Standards | 293T cell spike-in standards with unique sgNT barcodes [31] | Normalization for accurate quantification of cell abundance from sequencing data |
| Amplification Reagents | KAPA HiFi Hot Start DNA Polymerase [33], indexed primers with P5/P7 adapters [31] | PCR amplification of target sequences for library preparation |
| Library Prep Kits | SMRTbell Express Template Prep Kit 2.0 (PacBio) [33], 16S Barcoding Kit (ONT) [37] | Preparation of sequencing libraries optimized for specific platform requirements |
| Bioinformatic Tools | DADA2 pipeline [37], Emu [33], Spaghetti (ONT) [37] | Processing, error-correction, and analysis of platform-specific sequencing data |
Cost and Operational Considerations
Economic Factors in Platform Selection
The economic aspects of sequencing platform selection significantly influence experimental design in chemical-genetic interaction research, particularly for large-scale studies. Current pricing structures reveal substantial differences between platforms, with Illumina generally offering the lowest cost per sample for high-throughput applications, particularly when using NovaSeq X Series which can generate over 20,000 whole genomes annually [32]. Core facility pricing for Illumina NovaSeq X Plus 150 bp paired-end sequencing ranges from approximately $1,300-$1,800 per lane for academic researchers [38].
Long-read technologies command a premium, with PacBio Revio sequencing costing approximately $2,050 per flow cell for academic users, plus $400 per sample for HiFi library preparation [38]. Oxford Nanopore pricing shows significant variability based on scale, with PromethION flow cells (up to 290 Gb data) priced around $1,750 and MinION flow cells (up to 50 Gb data) at approximately $950, plus library prep costs of $350 per sample [38]. These cost structures make long-read technologies most appropriate for targeted applications where their specific advantages in read length provide essential biological insights.
The cost-effectiveness of NGS technologies must be evaluated in the context of specific research objectives. A 2025 study on tuberculosis drug-resistance testing found that targeted NGS (tNGS) could be cost-saving in centralized settings or cost-effective in decentralized scenarios compared to standard phenotypic drug susceptibility testing, while providing more comprehensive resistance profiling and faster turnaround times [36]. Similar principles apply to chemical-genetic interaction studies, where the information value of comprehensive mechanism-of-action data may justify higher sequencing costs for certain applications.
Implementation Strategies
Successful implementation of sequencing technologies for chemical-genetic interaction profiling requires strategic planning around several operational factors. Platform accessibility varies significantly, with Illumina instruments widely available through core facilities, while PacBio and ONT platforms may require specialized service providers or significant capital investment. The technical expertise required for operation and data analysis differs across platforms, with long-read technologies often demanding more specialized bioinformatic skills for optimal processing.
Experimental timelines should account for platform-specific workflow requirements, with Oxford Nanopore offering the fastest time-to-result for urgent applications, while Illumina provides predictable turnaround times for high-throughput projects. For large-scale chemical-genetic screens requiring analysis of thousands of samples, Illumina's throughput and multiplexing capabilities make it the current platform of choice, though this may change as third-generation technologies continue to improve in capacity and cost-efficiency.
Future Directions and Emerging Technologies
The NGS landscape continues to evolve rapidly, with significant implications for chemical-genetic interaction research. Roche's SBX technology, scheduled for commercial release in 2026, promises to deliver unprecedented combination of accuracy, speed, and throughput that could transform large-scale chemical-genetic screening applications [34] [35]. Early collaborations with Broad Clinical Labs aim to leverage SBX for trio-based whole genome sequencing of critically ill newborns, demonstrating its potential for rapid genomic analysis in time-sensitive scenarios [35].
Continuous improvements in existing platforms further expand experimental possibilities. Illumina's 5-base chemistry enables detection of standard bases and methylation states in single runs, potentially providing additional dimensions of epigenetic information in chemical-genetic studies [32]. Oxford Nanopore's ongoing improvements in accuracy through enhanced basecalling algorithms and flow cell chemistries progressively address the platform's historical limitations while maintaining its advantages in read length and real-time sequencing [33].
The development of increasingly sophisticated chemical-genetic profiling methods like PCL (Perturbagen CLass) analysis, which infers compound mechanism-of-action by comparing chemical-genetic interaction profiles to curated reference sets, will continue to drive requirements for sequencing technologies [4]. As these methods mature, the integration of multi-omic data types—including long-read transcriptomics, epigenomics, and proteomics—with chemical-genetic interaction datasets will create new opportunities for comprehensive mechanistic understanding of compound action, further emphasizing the importance of strategic platform selection in chemical-genetic research.
In the development of advanced cell and gene therapies, plasmid DNA (pDNA) serves as a fundamental starting material for producing viral vectors and engineering therapeutic cells. Ensuring the sequence fidelity of these plasmids is paramount, as low-level sequence variants can be introduced during gene synthesis or plasmid propagation in E. coli, potentially compromising therapeutic efficacy and safety [39]. Such variants, if undetected and introduced into production cell lines, can become persistent impurities that are challenging to remove downstream [39].
This case study explores the application of Next-Generation Sequencing (NGS) to achieve a level of sequence verification that surpasses traditional Sanger sequencing, which has a limited variant detection resolution of approximately 15-20% [39]. We frame this technical application within the broader research paradigm of chemical-genetic interaction (CGI) profiling, a powerful approach for elucidating small molecule mechanisms of action (MOA). In CGI studies, the integrity of the genetic tools—including plasmids and viral vectors used to create hypomorphic mutant strains—is a foundational prerequisite for generating reliable interaction profiles [4]. Just as reference-based CGI profiling depends on precise genetic perturbations to infer compound MOA, the production of consistent, safe, and effective biotherapeutics depends on the absolute fidelity of their underlying genetic components [4].
Client Challenge: Regulatory-Grade Plasmid QC
A gene therapy company preparing an Investigational New Drug (IND) submission faced a critical challenge: it required a validated, regulatory-compliant method to confirm the identity, purity, and sequence fidelity of its plasmid-based drug substance prior to batch release [40]. Beyond standard quality control (QC), the client needed high-resolution detection of low-frequency sequence variants (including substitutions and indels) and trace levels of contaminating DNA (e.g., host or microbial) to ensure the integrity of their therapeutic product [40]. This requirement mirrors the foundational need in CGI profiling for pure, well-characterized genetic constructs, where the accuracy of the initial genetic perturbation directly influences the quality of the resulting interaction data and subsequent MOA predictions [4].
Avance Biosciences’ NGS Solution: A Validated Workflow
Avance Biosciences implemented a solution centered on its validated Plasmid ID and Purity by NGS assay, designed to meet FDA expectations for genetic fidelity and contamination control [40]. The comprehensive workflow is outlined below.
Experimental Protocol and Workflow
The following diagram illustrates the key stages of the NGS plasmid fidelity workflow:
Step 1: Plasmid Prep and QC DNA was purified from client cell banks using validated Standard Operating Procedures (SOPs) and quantified by spectrophotometry (e.g., Nanodrop) to ensure accurate input into the library preparation process [40].
Step 2: Shearing and Library Prep The plasmid DNA was mechanically sheared to fragments of approximately 550 bp using a Covaris or equivalent instrument. A TruSeq PCR-Free kit was used for library preparation to minimize amplification bias that can introduce errors or skew variant frequencies [40]. This is a critical consideration, as PCR amplification artifacts are a known source of error in NGS [41].
Step 3: Sequencing and Mapping Paired-end sequencing (2x150 bp) was performed on the Illumina MiSeq platform. The resulting reads were aligned to the plasmid reference sequence. Simultaneously, they were screened against human and E. coli genomes to assess potential host or microbial DNA contamination. PhiX was included as a sequencing control [40].
Step 4: Variant Detection and Analysis A custom-validated bioinformatics pipeline was used to detect single-nucleotide variants (SNVs) and indels with a validated limit of detection (LOD) of 1% variant allele frequency [40]. This high sensitivity is essential for identifying minor variant populations.
Step 5: Sequence Fidelity Verification A consensus sequence was assembled de novo and compared to the reference to confirm 100% sequence identity and structural integrity, ensuring the absence of structural variants or rearrangements [40].
The Scientist's Toolkit: Key Research Reagent Solutions
The following table details essential materials and reagents used in the featured NGS workflow for plasmid fidelity testing.
| Research Reagent Solution | Function in the NGS Workflow |
|---|---|
| TruSeq PCR-Free Library Prep Kit | Prepares sequencing libraries without PCR amplification, minimizing the introduction of amplification biases and errors [40]. |
| Illumina MiSeq Platform | A benchtop sequencer that generates high-quality paired-end reads (e.g., 2x150 bp), ideal for targeted sequencing applications [40]. |
| PhiX Control | A well-characterized control library spiked into sequencing runs to monitor sequencing accuracy and cluster identification in real-time [40]. |
| Custom Bioinformatics Pipeline | Validated software for aligning sequence reads, detecting variants with high specificity, and screening for adventitious contaminants [40]. |
| Unique Molecular Identifiers | Barcodes that tag individual DNA molecules to improve sequencing accuracy by distinguishing true variants from PCR/sequencing errors [42]. |
Performance Qualification and Data Analysis
To validate assay performance, a rigorous qualification protocol was executed. QC samples were prepared at defined variant frequencies (1–50%) by mixing the wild-type drug substance plasmid with variant plasmids containing known mutations. This approach enabled empirical verification of the assay's linearity, reproducibility, and sensitivity for rare variant detection [40].
Quantitative Performance Data
The table below summarizes key performance metrics from the assay qualification and a comparative analysis of sequencing error rates across different technologies, highlighting the critical need for advanced error-correction methods.
Table 1: NGS Assay Performance Metrics for Plasmid Fidelity
| Parameter | Performance Metric | Context / Comparative Technology |
|---|---|---|
| Variant Detection Sensitivity | 1% Variant Allele Frequency [40] | Sanger Sequencing: ~15-20% [39] |
| NGS Platform Error Rate | 0.26% - 0.8% (Illumina) [41] | Sanger Sequencing: 0.001% [41] |
| Cell-free DNA Synthesis Error | 10⁻⁴ – 10⁻⁶ (phi29 polymerase) [42] | E. coli replication: 2-5 x 10⁻¹⁰ [42] |
| Variant Analysis in Clones | 0.5% limit for clone rejection [39] | Atypical case showed 0.9%-30.6% variant in clones [39] |
The data underscores a fundamental challenge: the intrinsic error rates of NGS chemistries are significantly higher than both traditional Sanger sequencing and the natural mutation rate of E. coli used for plasmid propagation [41] [42]. This clearly demonstrates why simple consensus building from NGS data is insufficient for detecting low-frequency variants and underscores the necessity of using unique molecular identifiers and validated bioinformatics pipelines to distinguish true plasmid variants from sequencing artifacts [42].
Customer Outcome and Regulatory Impact
The implementation of this NGS-based assay enabled the client to integrate a powerful QC tool into their lot release strategy for GMP plasmid production. The comprehensive data package generated by Avance Biosciences successfully supported regulatory filings by demonstrating [40]:
- Sensitive and quantitative detection of low-frequency variants (≥1%).
- Reliable identification and quantification of contaminants (e.g., host DNA, microbial).
- High specificity and reproducibility for lot-to-lot consistency.
This case highlights a critical trend in biopharmaceutical development: the proactive application of highly sensitive NGS assays to control sequence variants at the earliest stages of production. A relevant industrial case study demonstrated that even with careful single-colony picking and Sanger confirmation, a pDNA preparation contained a 2.2% mutation level that was subsequently inherited by 43% of the stable clones generated [39]. Introducing NGS-based QC for the pDNA itself is a robust strategy to prevent such costly downstream issues during Cell Line Development (CLD) and Chemistry, Manufacturing, and Controls (CMC) [39].
This case study demonstrates that applying NGS for plasmid sequence fidelity is more than a quality control measure; it is an enabler of reliable research and robust therapeutic development. The principles of rigorous genetic characterization and contamination control directly parallel the needs of chemical-genetic interaction profiling, as exemplified by the PROSPECT platform for antimicrobial discovery [4]. In both fields, the integrity of the starting genetic material is non-negotiable.
For CGI profiling, reliable reference profiles of known compounds are built using precisely engineered strains, and the accuracy of these profiles is critical for the correct MOA prediction of novel compounds via Perturbagen Class analysis [4]. Similarly, ensuring the sequence fidelity of plasmids used in gene therapy is foundational to ensuring the consistent performance and safety of the final therapeutic product. As the CGT industry continues to expand, the adoption of sensitive, NGS-based analytical techniques for plasmid and vector characterization will remain a cornerstone of regulatory compliance, product consistency, and ultimately, patient safety [40] [43].
Within the framework of chemical-genetic interaction profiling, the precise quantification of in vivo gene editing efficiency is a critical step for evaluating the efficacy and safety of novel therapeutic candidates. Next-generation sequencing (NGS) amplicon sequencing (Amplicon-Seq) has emerged as a powerful methodology for this application, enabling sensitive and quantitative measurement of editing events directly from complex tissue environments [44] [45]. This case study details the implementation of a validated NGS Amplicon-Seq approach to characterize in vivo gene editing efficiency across multiple preclinical tissues, providing a robust model for integrating precise genomic measurements into therapeutic development pipelines.
Case Study: Quantifying In Vivo Editing in Preclinical Tissues
Client Objective and Experimental Challenge
A biotechnology company advancing a novel gene-editing therapy required confirmation of in vivo editing efficiency within a preclinical study involving rat models [44]. The primary objective was to accurately quantify the percentage of gene-edited cells containing defined single-nucleotide substitutions across multiple tissue types, including blood, spleen, and bone marrow. The challenge involved detecting low-frequency editing events with high sensitivity and reproducibility to inform critical go/no-go decisions in their development pathway [44].
NGS Amplicon-Seq Solution
Avance Biosciences employed a validated NGS Amplicon-Seq method to address this challenge [44]. The solution utilized Illumina's MiSeq sequencing system in combination with custom-designed primers that targeted the genomic region of interest. This targeted approach allowed for the precise amplification and subsequent sequencing of the specific locus, facilitating accurate measurement of editing frequencies down to 1% [44]. A comprehensive validation was performed using custom synthetic DNA controls mixed in defined ratios spanning from 1% to 100% edited DNA to establish assay confidence [44].
Table: Key Validation Parameters for the NGS Amplicon-Seq Assay
| Validation Parameter | Established Performance | Importance for Quantification |
|---|---|---|
| Specificity | Ability to distinguish edited from wild-type sequences | Ensures accurate variant calling and prevents false positives |
| Accuracy & Precision | High inter-operator reproducibility | Provides reliable and consistent data across experiments and operators |
| Linearity & Dynamic Range | Validated across 1%–100% edited DNA mixtures | Confirms reliable quantification across a wide range of editing efficiencies |
| Limit of Detection (LOD) | As low as 0.02% | Enables identification of very rare editing events |
| Lower Limit of Quantification (LLOQ) | Established at 1% | Provides a threshold for precise quantitative measurement |
Detailed Experimental Workflow and Protocol
The experimental workflow consisted of several critical steps, each optimized for tissues [44]:
- Sample Acquisition and Genomic DNA Extraction: Tissue samples (blood, spleen, bone marrow) were collected from dosed rats. Genomic DNA (gDNA) was then isolated using optimized, tissue-specific extraction protocols to maximize yield and quality from diverse biological matrices [44].
- DNA Quality and Quantity Assessment: The concentration and quality of the extracted gDNA were rigorously assessed using fluorescence-based methods (e.g., PicoGreen, Qubit) and spectrophotometry (e.g., Nanodrop). This step is crucial for normalizing input DNA across samples to prevent sequencing bias [44].
- Targeted PCR Amplification and Library Preparation: Custom primers were designed to flank the specific genomic region containing the target edit. These primers were used in a targeted PCR amplification to generate amplicons, enriching for the locus of interest. During this step, sample-specific index sequences (barcodes) and Illumina sequencing adapters were added to the amplicons via a subsequent PCR reaction. This creates a pooled library where each sample can be tracked bioinformatically after simultaneous sequencing [44] [46].
- High-Throughput Sequencing: The pooled, barcoded library was loaded onto an Illumina MiSeq sequencer. The system sequences millions of DNA fragments in parallel, generating a high volume of short reads that are aligned to the reference genome [44].
- Bioinformatic Analysis and Variant Calling: A custom, validated bioinformatics pipeline was used to process the raw sequencing data. The steps include demultiplexing (sorting reads by sample barcode), alignment to the reference genome, and precise variant calling to identify the specific nucleotide substitution and calculate its frequency in each sample [44].
Diagram of the end-to-end NGS Amplicon-Seq workflow for quantifying in vivo gene editing.
The Scientist's Toolkit: Essential Reagents and Technologies
Successful implementation of this quantitative approach relies on several key technologies and reagent systems.
Table: Key Research Reagent Solutions for NGS Amplicon-Seq
| Item / Technology | Function in the Workflow | Key Features for Gene Editing Analysis |
|---|---|---|
| Illumina MiSeq System | High-throughput sequencing platform | Generates millions of short reads for deep coverage of amplicons; ideal for targeted sequencing [44]. |
| Custom Primer Panels | Target-specific amplification | Designed to flank the edited genomic region; enable specific enrichment of the locus before sequencing [44]. |
| rhAmpSeq CRISPR Analysis System | An end-to-end amplicon sequencing solution | A multiplexed amplicon sequencing system specifically optimized for sequencing CRISPR edits across multiple on- and off-target sites in a single reaction [47]. |
| Synthetic DNA Controls | Assay validation and calibration | Comprises defined mixtures of wild-type and edited sequences (e.g., 1%-100%) to validate LOD, LLOQ, and linearity [44]. |
| CleanPlex Technology | Advanced multiplex PCR-based target enrichment | Overcomes traditional amplicon sequencing drawbacks like high background noise and PCR bias, offering high uniformity and sensitivity, even for low-input DNA [46]. |
Discussion and Impact
Study Outcomes and Broader Implications for Therapeutic Development
The application of the validated NGS Amplicon-Seq solution successfully delivered a full editing profile across all preclinical tissue samples within a 12-week timeframe [44]. The data enabled the client to precisely determine the percentage of editing in each tissue type, identify variability between tissues and individual animals, and justify dosing strategies for subsequent IND-enabling studies [44]. The ability to obtain a quantitative editing profile from complex in vivo environments underscores the critical role of NGS Amplicon-Seq in bridging the gap between initial therapeutic concepts and regulated preclinical development. This data package provided the foundational evidence required for regulatory submissions, highlighting the direct impact of robust genomic quantification on the drug development pathway [44].
Advanced Applications and Future Directions
While this case study focused on quantifying a specific single-nucleotide edit, the Amplicon-Seq methodology is highly adaptable for comprehensive profiling in chemical-genetic interaction research. Its applications extend to:
- CRISPR QC and Off-Target Detection: Amplicon sequencing is widely used to validate on-target CRISPR edits and to screen for potential off-target effects at nominated sites, which is crucial for assessing the safety of gene-editing therapeutics [45] [47].
- Single-Cell Genotyping: Emerging single-cell DNA sequencing (scDNA-seq) technologies, like the Tapestri platform, can now be applied to genome-edited cells. This advanced approach moves beyond bulk population averages to reveal the co-occurrence of edits (e.g., multiple on-target edits), their zygosity (heterozygous/homozygous), and their correlation with protein expression within individual cells [48].
- Analysis of Diverse Edit Types: The flexibility of amplicon sequencing makes it suitable for detecting not just single-nucleotide variants, but also insertions, deletions (indels), and other small mutations induced by gene-editing tools, providing a comprehensive view of editing outcomes [45] [46].
Diagram comparing the informational outputs of bulk versus single-cell NGS analysis.
Navigating the Bottlenecks: Proven Strategies for Optimizing NGS Data Analysis
The advent of Next-Generation Sequencing (NGS) has propelled molecular biology into the exabyte era, creating unprecedented computational and storage challenges that threaten to outpace traditional analytical capabilities. By 2025, genomic data alone is projected to consume over 40 exabytes of storage capacity, growing at an annual rate estimated to be 2-40 times faster than other major data domains such as astronomy or social media [49]. This data deluge is particularly acute in chemical-genetic interaction profiling research, where projects like the PROSPECT platform generate massive multidimensional datasets by screening compounds against pooled hypomorphic Mycobacterium tuberculosis mutants, with sequencing used to quantify hypomorph-specific DNA barcodes and reveal chemical-genetic interactions (CGIs) [4].
The National Institutes of Health (NIH) and other large-scale research initiatives now generate petabytes of data annually, placing extraordinary demands on storage infrastructure, network bandwidth, and computational frameworks [49]. This data explosion stems from multiple factors: dramatically reduced sequencing costs (now under $1,000 per whole human genome), massively parallel sequencing capabilities that process millions to billions of fragments simultaneously, and the increasing complexity of multi-omics approaches that integrate genomic, epigenomic, transcriptomic, and proteomic data [14] [50] [51]. For researchers employing chemical-genetic interaction profiling methods like PROSPECT, this translates to critical bottlenecks in data processing, analysis, and interpretation that must be overcome to leverage the full potential of their experimental platforms.
Understanding NGS Data Generation and Workflows
The NGS data generation process follows a structured pipeline that transforms biological samples into interpretable genetic information. Understanding this workflow is essential for identifying potential bottlenecks and optimization points for computational handling. The process begins with sample preparation, where nucleic acids are extracted and converted into sequencing-ready libraries through fragmentation and adapter ligation [52] [51]. The critical stages where data volume expands exponentially occur during sequencing and the subsequent computational analysis phases.
The following diagram illustrates the complete NGS workflow and the corresponding data management challenges at each stage:
NGS Data Generation and File Types
In chemical-genetic interaction profiling, each stage of the NGS workflow generates distinct file types with characteristic storage requirements and computational demands. The PROSPECT platform exemplifies this challenge, as it relies on quantifying changes in hypomorph-specific DNA barcode abundances across multiple compound-dose conditions, generating complex chemical-genetic interaction (CGI) profiles for each compound [4]. A typical experiment progresses through these data generation stages:
- Raw Data (FASTQ): The initial output from sequencing instruments, containing sequence reads and quality scores. A single high-throughput NGS run can generate terabytes of raw data, with file sizes dramatically influenced by sequencing depth and the number of samples multiplexed [50].
- Aligned Data (BAM/SAM): Binary files containing sequence reads aligned to a reference genome. These files typically constitute the largest storage footprint in NGS pipelines, particularly in chemical-genetic interaction studies where multiple mutant strains are analyzed simultaneously [53].
- Variant Data (VCF): Text files containing identified genetic variants. While more compact than BAM files, these require sophisticated annotation and filtering in chemical-genetic interaction analysis to distinguish meaningful hypersensitivities from background noise [4] [53].
The computational burden is further compounded in chemical-genetic interaction profiling by the need to compare CGI profiles across hundreds of compounds and reference standards, as demonstrated in Perturbagen Class (PCL) analysis, which matches unknown compounds to known mechanisms of action based on profile similarity [4].
Infrastructure Solutions for NGS Data Management
Cloud Computing Platforms
Cloud computing has emerged as a fundamental solution for handling NGS data volumes, providing scalable infrastructure that can dynamically accommodate fluctuating computational demands. Major cloud platforms like Amazon Web Services (AWS), Google Cloud Genomics, and Microsoft Azure offer specialized genomic services that provide several critical advantages [54] [53]:
- Elastic Scalability: Cloud resources can be rapidly scaled up or down based on project requirements, allowing researchers to handle peak computational loads during intensive analysis phases without maintaining expensive permanent infrastructure.
- Cost-Effectiveness: The pay-as-you-go model eliminates substantial upfront capital investment in computing hardware, making large-scale genomic analysis accessible to smaller laboratories and research groups [54].
- Collaborative Capabilities: Cloud platforms enable global collaboration by allowing researchers from different institutions to access and analyze the same datasets simultaneously while maintaining data security and integrity [54].
- Managed Services: Specialized genomic processing services (e.g., DRAGEN-based platforms) offer optimized, accelerated analysis pipelines that can significantly reduce processing time and computational overhead [53].
High-Performance Computing (HPC) and Accelerated Processing
For specialized applications requiring real-time processing or dealing with exceptionally large datasets, traditional High-Performance Computing clusters and hardware-accelerated processing offer alternative solutions:
- GPU Acceleration: Graphics Processing Units (GPUs) can dramatically accelerate computationally intensive NGS tasks. Platforms like NVIDIA Parabricks have demonstrated speed improvements of up to 80x for processes like variant calling, reducing analysis that traditionally required hours to mere minutes [55].
- Integrated Analytics Platforms: Commercial solutions such as the DRAGEN (Dynamic Read Analysis for GENomics) platform provide field-programmable gate array (FPGA)-based accelerated algorithms for secondary analysis, delivering both speed improvements and enhanced accuracy for variant calling [53].
The following table summarizes the quantitative performance improvements offered by advanced computational solutions:
Table 1: Computational Acceleration Solutions for NGS Data Analysis
| Solution Type | Speed Improvement | Key Applications | Implementation Examples |
|---|---|---|---|
| GPU Acceleration | Up to 80x faster [55] | Variant calling, alignment | NVIDIA Parabricks, NVScoreVariants [55] |
| FPGA-Based Platforms | 30-50x faster than conventional processing [53] | Secondary analysis, compression | DRAGEN platform [53] |
| Cloud-Optimized Pipelines | Variable (hours vs. days) [54] | Multi-omics integration, population-scale analysis | AWS Batch, Google Genomics API [54] |
| In-Memory Computing | 5-10x faster I/O operations [49] | Real-time visualization, interactive exploration | Spark-based genomics tools [49] |
Data Compression and Storage Optimization
Given the massive storage requirements of NGS data, sophisticated compression strategies are essential for sustainable data management:
- Reference-Based Compression: Algorithms like CRAM achieve 50-60% compression compared to BAM files by storing only differences from a reference genome rather than complete sequence data [53].
- Selective Archiving: Implementing tiered storage policies where raw data is compressed and moved to cheaper storage tiers after primary analysis, while keeping only essential processed files readily accessible [49].
- Data Lifecycle Management: Establishing clear protocols for data retention, prioritizing storage of processed results and analysis-ready data rather than maintaining all intermediate files indefinitely.
Methodological and Analytical Approaches
Artificial Intelligence and Machine Learning Solutions
Artificial intelligence (AI) and machine learning (ML) have transformed NGS data analysis, enabling researchers to extract meaningful patterns from massive datasets that would be impossible to process manually. In chemical-genetic interaction profiling, these approaches are particularly valuable for identifying subtle patterns in chemical-genetic interaction profiles that predict mechanism of action [4]. Key applications include:
- Pattern Recognition: Deep learning models, particularly convolutional neural networks (CNNs) and recurrent neural networks (RNNs), can identify complex patterns in multidimensional chemical-genetic interaction data. For example, Google's DeepVariant framework reframes variant calling as an image classification problem, using deep neural networks to distinguish true genetic variants from sequencing artifacts with remarkable precision [55].
- Dimensionality Reduction: AI algorithms can reduce the complexity of high-dimensional chemical-genetic interaction profiles, enabling visualization and interpretation of compound clustering based on mechanism of action similarity, as demonstrated in PROSPECT's PCL analysis [4].
- Predictive Modeling: Machine learning models can predict compound mechanism of action based on chemical-genetic interaction signatures. In validation studies, this approach achieved 69% sensitivity and 87% precision when applied to a test set of antitubercular compounds with known mechanisms [4].
Multi-Omics Data Integration Frameworks
The integration of multiple data types compounds storage and computational challenges but provides more comprehensive biological insights. Effective multi-omics integration requires specialized approaches:
- Federated Learning: This privacy-preserving approach enables model training across decentralized data sources without transferring sensitive genomic data, allowing institutions to collaborate while maintaining data security [49].
- Knowledge Graphs: Graph-based databases can efficiently represent and query complex relationships between compounds, genetic perturbations, and pathway interactions identified in chemical-genetic interaction screens [49].
- Containerized Workflows: Technologies like Docker and Singularity package complete analysis environments, ensuring computational reproducibility and simplifying deployment across different computing infrastructures [53].
The following diagram illustrates the AI-powered analytical framework for processing chemical-genetic interaction data:
Experimental Design for Computational Efficiency
Strategic experimental design can significantly reduce computational burdens without sacrificing scientific value:
- Multiplexing Strategies: Efficient sample barcoding and multiplexing allow sequencing of multiple samples in a single lane, maximizing data generation while minimizing per-sample computational overhead [52].
- Targeted Sequencing Approaches: Focusing sequencing efforts on specific genomic regions of interest (e.g., using hybrid capture or amplicon-based methods) dramatically reduces data generation compared to whole-genome sequencing while maintaining analytical power for predefined targets [56] [52].
- Sequencing Depth Optimization: Balancing sequencing depth with experimental requirements prevents unnecessary data generation. Chemical-genetic interaction profiling typically requires sufficient depth to accurately quantify hypomorph abundance changes but does not necessarily require ultra-deep sequencing [4].
Essential Research Reagents and Computational Tools
Successful management of NGS data deluge requires both wet-laboratory reagents and sophisticated computational tools. The following table outlines key resources specifically relevant to chemical-genetic interaction profiling studies:
Table 2: Research Reagent Solutions for Chemical-Genetic Interaction Profiling
| Reagent/Tool Category | Specific Examples | Function in CGI Profiling | Computational Considerations |
|---|---|---|---|
| Hypomorphic Strain Pools | Proteolytically depleted M. tuberculosis essential gene mutants [4] | Creates sensitized background for detecting compound-gene interactions | Requires specialized barcode alignment pipelines |
| DNA Barcodes | Strain-specific oligonucleotide identifiers [4] | Enables multiplexed quantification of strain abundance | Barcode demultiplexing and quality control |
| Reference Compound Sets | Curated libraries with known mechanisms (e.g., 437 compounds in PROSPECT) [4] | Provides ground truth for mechanism prediction | Reference profile storage and similarity computation |
| Sequence Capture Reagents | Hybridization capture probes or PCR primers [56] | Enables targeted sequencing of barcode regions | Reduces data volume compared to WGS |
| Adapter Sequences | Platform-specific sequencing adapters [52] [51] | Facilitates NGS library preparation and multiplexing | Demultiplexing and quality filtering requirements |
| Quality Control Kits | Bioanalyzer, qPCR, fluorometric quantification [52] | Ensures library quality before sequencing | Impacts sequencing efficiency and data yield |
Future Directions and Emerging Solutions
The field of genomic data management continues to evolve rapidly, with several promising technologies poised to address current limitations:
- Quantum Computing: Early exploration of quantum algorithms for genomic analysis suggests potential for exponential speedups for specific computational challenges, such as complex optimization problems in multi-omics data integration [49].
- Edge Computing: For real-time analytical applications, edge computing brings computational capacity closer to sequencing instruments, reducing latency for time-sensitive analyses [14].
- Blockchain for Data Integrity: Emerging applications of blockchain technology offer potential solutions for ensuring data provenance, integrity, and controlled access in collaborative genomic research [49].
- Synthetic Data Generation: Generative AI models, particularly Generative Adversarial Networks (GANs) and Variational Autoencoders (VAEs), can create realistic synthetic genomic datasets for method development and training without compromising patient privacy [55] [49].
- Explainable AI (XAI): As AI models become more complex, XAI methodologies are critical for interpreting model decisions and building trust in automated mechanism-of-action predictions [49].
The computational and storage challenges presented by NGS data deluge are significant but not insurmountable. Through strategic implementation of cloud infrastructure, AI-augmented analytical pipelines, and computationally efficient experimental designs, researchers can effectively manage these massive datasets while extracting meaningful biological insights. For chemical-genetic interaction profiling specifically, the integration of robust computational frameworks with experimental methodology enables high-throughput mechanism of action elucidation, accelerating antimicrobial discovery and drug development. As sequencing technologies continue to evolve and data volumes grow, the development of increasingly sophisticated computational strategies will remain essential for leveraging the full potential of genomic science in therapeutic development.
In the context of chemical-genetic interaction profiling research, the accuracy of next-generation sequencing (NGS) data is not merely a technical concern but a fundamental determinant of experimental validity. These sophisticated experiments, which aim to unravel how small molecules modulate gene function and network behavior, produce complex datasets where signal can be easily obscured by noise. Quality control (QC) and preprocessing constitute the essential first barrier against misinterpretation, ensuring that observed genetic interactions genuinely reflect biological mechanisms rather than technical artifacts. In drug development pipelines, where decisions advance based on these findings, rigorous QC prevents costly missteps and ensures that resources are invested in pursuing genuine biological insights.
The unique challenge in chemical-genetic interaction studies lies in the multi-layered nature of the data. Unlike standard transcriptomic or genomic analyses, these experiments must disentangle the combined effects of genetic perturbations and chemical treatments, where poor sequencing quality can create false interactions or mask true synthetic lethal relationships. This guide establishes a comprehensive framework for QC and preprocessing, translating general NGS principles into condition-specific guidelines tailored to the exacting requirements of chemical-genetic research. By adopting the practices outlined herein, researchers can establish a robust foundation for discovering and validating novel chemical-genetic interactions with high confidence.
Understanding NGS Data Types and QC-Relevant Features
The NGS Data Ecosystem from Raw Sequences to Analysis
NGS workflows transform biological samples into interpretable data through a series of computational steps, each generating specialized file formats with distinct quality implications [57]. Understanding this ecosystem is prerequisite for effective QC:
- Raw Sequencing Data: Direct instrument output, typically in FASTQ format, contains nucleotide sequences and per-base quality scores encoded in ASCII [57]. This represents the starting point for quality assessment before any preprocessing.
- Alignment Data: Processed reads mapped to reference genomes are stored in SAM (human-readable), BAM (compressed binary), or CRAM (reference-compressed) formats [57]. Mapping statistics derived from these files provide crucial quality metrics.
- Quantification Data: Processed expression matrices or variant calls in tab-separated values (TSV) or specialized formats ready for biological interpretation [57].
The following table summarizes the primary NGS data formats and their roles in QC workflows:
Table 1: Essential NGS File Formats and Their Quality Control Applications
| Format Type | Primary Formats | Key Quality Metrics | QC Applications |
|---|---|---|---|
| Raw Sequencing | FASTQ, BCL, FAST5 | Per-base quality scores, sequence length, adapter contamination, GC content | Initial quality assessment, identification of systematic errors, read trimming decisions |
| Alignment | SAM, BAM, CRAM | Mapping rates, uniquely mapped reads, properly paired reads, insert sizes | Evaluation of library preparation and sequencing success, identification of potential contaminants |
| Processed Data | TSV, VCF, BED | Gene body coverage, 5'/3' bias, variant quality scores, peak distributions | Downstream analysis suitability, experimental condition-specific quality |
Condition-Specific Quality Guidelines
Traditional QC approaches often apply universal thresholds across diverse experimental conditions, but evidence from large-scale analyses demonstrates this inadequacy. Data-driven studies using thousands of reference files from the ENCODE project reveal that quality feature relevance varies significantly across experimental conditions, including organism, assay type, and biological target [58]. For chemical-genetic interaction profiling, this implies that QC standards must be adapted to the specific experimental context:
- Assay-Specific Variation: QC thresholds that work for RNA-seq in one cell type may be inappropriate for ChIP-seq targeting specific histone modifications in the same system [58].
- Antibody-Specific Considerations: In ChIP-seq experiments common in epigenetic chemical-genetic studies, quality metrics show substantial variation between different protein targets and antibodies [58].
- Statistical Guidelines: Condition-specific classification trees derived from machine learning analysis of large datasets provide more accurate quality assessment than fixed thresholds [58].
Key Quality Metrics and Their Statistical Interpretation
Raw Read Quality Assessment
The initial QC phase focuses on raw sequencing data, where early detection of issues prevents propagation of errors through downstream analyses. The Phred quality score (Q) represents the fundamental metric, calculated as Q = -10log₁₀(P), where P is the probability of an incorrect base call [59]. The following table interprets Phred scores and their implications for data reliability:
Table 2: Phred Quality Score Interpretation and Accuracy Benchmarks
| Phred Quality Score | Probability of Incorrect Base Call | Base Call Accuracy | Typical ASCII Representation (Sanger) | Interpretation in Chemical-Genetic Context |
|---|---|---|---|---|
| 10 | 1 in 10 | 90% | + | Unacceptable for variant calling in resistance mutations |
| 20 | 1 in 100 | 99% | 5 | Marginal quality requiring careful interpretation |
| 30 | 1 in 1,000 | 99.9% | ? | Standard minimum for reliable variant detection |
| 40 | 1 in 10,000 | 99.99% | I | Excellent quality for detecting subtle interaction effects |
Modern Illumina platforms (1.8+) use Phred+33 encoding, where quality scores range from 0-42 [59]. The ASCII character '!' represents the lowest quality (0), while 'J' represents the highest (41). FASTQ files should be examined for position-dependent quality degradation, which is common at the 3' ends of reads and can impact variant calling accuracy in genetic variant identification under chemical treatment.
Mapping Statistics and Genomic Features
After alignment to reference genomes, mapping statistics provide powerful indicators of library quality and experimental success. Research demonstrates that genome mapping statistics hold high relevance for assessing functional genomics data quality [58]. The following workflow diagram illustrates the relationship between key quality metrics and their interpretation in the context of chemical-genetic interaction studies:
Quality Assessment Workflow for Chemical-Genetic Interaction Studies
Critical mapping statistics and their interpretation include:
- Uniquely Mapped Reads: Percentage of reads mapping to a single genomic location. Low values suggest contamination, excessive PCR duplicates, or poor library quality that can obscure true chemical-genetic interactions [58].
- PCR Bottleneck Coefficient (PBC): Measures library complexity based on the distribution of mapped reads. PBC1 (unique locations/total mapped) < 0.5 indicates severe bottlenecks that limit detection of rare genetic interactions [58].
- Fraction of Reads in Peaks (FRiP): For ChIP-seq experiments, the proportion of reads falling within identified peak regions. ENCODE recommends FRiP ≥ 0.01 for broad marks and ≥ 0.01 for narrow marks, though condition-specific thresholds are preferable [58].
Experimental Protocols for Quality Assessment
Comprehensive QC Pipeline for Chemical-Genetic Studies
Implementing a robust QC protocol requires multiple tools applied at successive stages of data processing. The following workflow provides a comprehensive assessment strategy suitable for chemical-genetic interaction profiling:
Comprehensive NGS Quality Control Pipeline
Hands-On Quality Assessment with FASTQC
Protocol: Initial Quality Assessment of Raw Sequencing Data
Data Inspection: Begin by visually examining the FASTQ file structure to understand read length and formatting:
Each read is encoded in four lines: identifier (
@prefix), nucleotide sequence, separator (+), and quality scores [59].Quality Assessment with FastQC:
FastQC generates comprehensive reports on per-base sequence quality, adapter contamination, and other key metrics [59].
Interpretation of FastQC Results:
- Per-base sequence quality: Check for degradation at 3' ends, which may require trimming.
- Adapter content: Identify contamination requiring removal before alignment.
- GC content: Compare with expected distribution for your organism.
- Sequence duplication levels: High duplication may indicate low complexity or PCR artifacts.
Alternative: FASTQE for Rapid Assessment: FASTQE provides a simplified, emoji-based quality summary for a quick overview before detailed analysis [59].
Mapping-Based Quality Assessment
Protocol: Post-Alignment Quality Metrics
Alignment Processing:
Mapping Statistics Extraction:
This provides the percentage of properly mapped reads, with values below 70-80% often indicating issues [58].
Condition-Specific Quality Evaluation: Utilize data-driven guidelines from resources like the CBDM guidelines portal (https://cbdm.uni-mainz.de/ngs-guidelines) to assess whether mapping statistics meet standards for your specific experimental condition (e.g., RNA-seq in your cell type of interest) [58].
Advanced QC for Chemical-Genetic Studies: For ChIP-seq experiments assessing epigenetic drug effects, calculate the Fraction of Reads in Peaks (FRiP):
The Scientist's Toolkit: Essential Research Reagents and Computational Tools
Successful quality control in chemical-genetic interaction studies requires both wet-lab reagents and computational resources. The following table details essential components of the QC toolkit:
Table 3: Essential Research Reagent Solutions for NGS Quality Control
| Category | Item/Reagent | Function in QC | Quality Implications |
|---|---|---|---|
| Library Preparation | High-Fidelity DNA Polymerases | Amplification with minimal bias | Reduces PCR duplicates, maintains sequence diversity |
| Size Selection Beads | Fragment size optimization | Controls insert size distribution, improves mapping | |
| Molecular Barcodes/UMIs | Unique molecular identifiers | Enables accurate duplicate removal, quantitation | |
| Sequencing Controls | Spike-in DNAs/RNAs | External reference standards | Normalization across samples, technical variation assessment |
| Phix Control Library | Sequencing run monitoring | Assesses cluster density, base calling accuracy | |
| Computational Tools | FastQC | Raw data quality assessment | Identifies position-specific quality issues, adapters [59] |
| Cutadapt/Trimmomatic | Read trimming and filtering | Removes adapter contamination, low-quality bases [59] | |
| SAMtools/BEDTools | Alignment processing and metrics | Calculates mapping statistics, coverage profiles [57] | |
| MultiQC | Consolidated QC reporting | Aggregates metrics from multiple tools for comparative analysis [59] | |
| Reference Resources | Condition-Specific Guidelines | Data-driven quality thresholds | Provides biological context-specific pass/fail criteria [58] |
Special Considerations for Chemical-Genetic Interaction Studies
Chemical-genetic interaction profiling introduces unique QC challenges that extend beyond standard NGS applications. The combined treatment conditions (genetic perturbation + chemical exposure) can produce distinctive quality signatures that require specialized interpretation:
- Compound-Dependent Artifacts: Certain small molecules can directly affect library preparation efficiency or sequencing chemistry, creating systematic biases that mimic genetic interactions. Include solvent-only controls in experimental design to distinguish technical from biological effects.
- Complexity Requirements: Double-perturbation studies (chemical + genetic) typically show more variable expression patterns than single perturbations, requiring higher sequencing depth to capture rare interaction states. Increase target sequencing depth by 30-50% compared to standard RNA-seq experiments.
- Batch Effect Management: When screening compound libraries across multiple plates or dates, incorporate technical controls in each batch to enable normalization of plate-position and day effects that could obscure true chemical-genetic interactions.
- Validation Strategies: Allocate a portion of the budget for orthogonal validation (e.g., qPCR, targeted sequencing) of the most significant interactions identified, particularly those approaching quality thresholds.
Statistical guidelines derived from large-scale projects like ENCODE provide a foundation, but the unique nature of chemical-genetic interaction studies necessitates developing internal, condition-specific benchmarks over time [58]. Document all QC decisions and thresholds to ensure reproducibility across screening campaigns and facilitate meta-analysis of interaction networks.
Next-generation sequencing (NGS) has fundamentally transformed biological research, enabling the parallel sequencing of millions to billions of DNA fragments and providing comprehensive insights into genome structure, genetic variations, and gene expression profiles [2]. However, the accuracy of this powerful technology is compromised by various sequencing artifacts and variant calling pitfalls that can significantly impact data interpretation, particularly in sensitive applications like chemical-genetic interaction profiling. In these studies, where researchers systematically measure how genetic perturbations affect susceptibility to chemical compounds, artifactual variants can lead to false conclusions about gene-compound relationships, misdirecting research efforts and therapeutic development [60].
Sequencing artifacts—errors introduced during library preparation, sequencing, or data analysis—are ubiquitous in NGS data and manifest as false-positive variant calls that obfuscate true biological signals. The challenges are particularly pronounced in targeted sequencing approaches commonly used in functional genomics, where artifacts arising from DNA fragmentation methods, PCR amplification, and sequence-specific biases can mimic genuine genetic variants [61] [62]. Understanding the origins, characteristics, and mitigation strategies for these artifacts is therefore essential for producing reliable, reproducible genomic data, especially in chemical-genetic studies where accurate variant identification forms the foundation for connecting genetic elements to chemical response phenotypes.
This technical guide provides a comprehensive overview of major sequencing artifact sources, detailed methodologies for their identification, and strategic approaches for mitigation, with special emphasis on applications within chemical-genetic interaction profiling research. By implementing the rigorous practices outlined herein, researchers can significantly enhance the reliability of their NGS data and strengthen the validity of their scientific conclusions.
Library Preparation-Derived Artifacts
Library preparation represents a primary source of artifacts in NGS data, with DNA fragmentation methods contributing significantly to this error burden. Recent research has characterized two distinct types of artifacts stemming from different fragmentation approaches: sonication-induced and enzyme-induced artifacts [61].
Sonication fragmentation, which shears genomic DNA using focused ultrasonic acoustic waves, typically produces near-random fragmentation with minimal bias. However, it can generate chimeric artifact reads containing both cis- and trans-inverted repeat sequences (IVSs) of the genomic DNA. These artifacts arise when double-stranded DNA templates are cleaved by sonication, creating partial single-stranded DNA molecules that can randomly invert and complement with other parts of the same IVS on different molecules, forming new chimeric DNA sequences during subsequent library preparation steps [61].
Enzymatic fragmentation, which digests DNA using endonucleases, offers advantages of ease of use and minimal DNA loss but introduces different artifacts. Libraries prepared with enzymatic fragmentation demonstrate a significantly greater number of artifact variants compared to sonication-based methods (median of 115 vs. 61 variants in one study) [61]. These artifacts frequently manifest as chimeric reads containing palindromic sequences (PS) with mismatched bases, resulting from cleavage at specific sequence sites within PS regions that then undergo aberrant repair and ligation processes [61].
The underlying mechanism for both artifact types has been formalized as the Pairing of Partial Single Strands Derived from a Similar Molecule (PDSM) model, which explains how these sequencing errors derive from structure-specific sequences in the human genome during library preparation [61].
Sequencing-Process Artifacts
The sequencing process itself introduces distinctive artifacts, particularly in sequencing-by-synthesis platforms. One characterized phenomenon involves "noise spike artefacts" that occur at specific positions within a sequencing run and affect reads across the entire run, regardless of locus or sample [62]. These artifacts manifest as sudden increases in substitution and indel errors when sequences are aligned to reference positions, resulting in high-coverage noise sequences that can be challenging to distinguish from genuine alleles.
The positional nature of these errors suggests they originate during the sequencing process rather than during PCR amplification, with specific sequencing cycles being particularly error-prone [62]. Unlike random errors, these systematic artifacts demonstrate consistent patterns across entire sequencing runs, creating false variant calls that cluster at specific cycle positions and can bypass standard noise filters due to their high read coverage, potentially complicating downstream genotyping and analysis [62].
PCR Amplification Artifacts
PCR amplification during library preparation introduces PCR duplicates—redundant reads originating from the same DNA fragment—which can falsely increase allele frequency or introduce erroneous mutation calls [63]. These artifacts are particularly problematic in applications requiring accurate quantification of variant frequency, such as detecting subclonal populations in cancer or identifying mosaic variants in genetic disorders.
While computational methods can mark reads with shared mapping coordinates as potential duplicates, this approach may overcorrect in duplicated genomic regions or miss duplicates in repetitive regions [63]. Approaches utilizing unique molecular identifiers (UMIs)—random oligonucleotide barcodes ligated to individual molecules before amplification—provide a more robust solution, enabling precise identification and removal of PCR duplicates even after amplification [63].
Characterization and Detection of Sequencing Artifacts
Effective artifact mitigation begins with comprehensive characterization of artifact signatures in NGS data. Systematic analysis reveals distinctive features that differentiate artifacts from genuine biological variants.
Table 1: Characteristics of Major Sequencing Artifact Types
| Artifact Type | Primary Origins | Key Identifying Features | Commonly Affected Variant Types |
|---|---|---|---|
| Fragmentation Chimeras | Library preparation (sonication/enzymatic fragmentation) | Misalignments at read ends; inverted repeat sequences; palindromic sequences with mismatches | SNVs, indels at specific genomic structures |
| Noise Spike Artefacts | Sequencing process (specific cycles) | Substitution/indel spikes at consistent cycle positions across entire run | SNVs, indels at specific cycle positions |
| PCR Duplicates | Library amplification | Identical mapping coordinates; can be precisely identified with UMIs | All variant types (frequency distortion) |
| Base Quality Issues | Sequencing chemistry | Systematic errors in base calling; low quality scores | All variant types |
| Mapping Artifacts | Reference alignment | Misalignment around indels; low-complexity regions | Indels, structural variants |
Analysis of artifact-containing reads typically reveals misalignments at the 5'-end or 3'-end (soft-clipped regions) of sequencing reads [61]. Upon further investigation, these soft-clipped reads often contain nearly perfect or overlapped perfect inverted repeat sequences in sonication-derived artifacts or palindromic sequences in enzymatic fragmentation-derived artifacts [61]. The sequence between these structures frequently shows inverted complementarity to reference sequences, providing a diagnostic signature for identifying such artifacts.
In chemical-genetic interaction profiling, where precise variant identification is crucial for connecting genotypes to chemical susceptibility, these artifacts can create false-positive variant calls that potentially misrepresent gene-compound relationships. Implementing rigorous artifact detection protocols is therefore essential for maintaining data integrity in these studies [60].
Bioinformatics Strategies for Artifact Mitigation
Specialized Algorithms for Artifact Detection
Bioinformatics approaches represent the first line of defense against sequencing artifacts, with several specialized algorithms developed specifically for artifact identification and removal. The ArtifactsFinder algorithm employs a dual-workflow approach to identify potential artifact SNVs and indels induced by inverted repeat sequences (IVSs) and palindromic sequences (PSs) in reference sequences [61].
The ArtifactsFinderIVS module identifies artifacts stemming from inverted repeat sequences by extending BED regions by +50 bp on each side to generate calibrated reference sequences, then creating k-mers for analysis. This systematic approach allows for comprehensive screening of regions susceptible to IVS-derived artifacts [61]. Meanwhile, the ArtifactsFinderPS module specifically targets palindromic sequence-induced artifacts, which frequently manifest at the center and other positions of palindromic sequences consisting of nearly perfect reverse complementary bases [61].
Additional bioinformatic strategies include:
- Local realignment around indels: Reduces false-positive variant calls caused by alignment artifacts, though evaluations suggest improvements may be marginal relative to computational cost [64].
- Base quality score recalibration (BQSR): Adjusts base quality scores of sequencing reads using an empirical error model to correct for systematic biases introduced during library preparation and sequencing [63] [64].
- Clustering-based artifact removal: Implements clustering methods (100% identity, traditional clonotyping, or unsupervised clustering) to distinguish authentic biological sequences from artificial diversity caused by sequencing and PCR artifacts [65].
Best Practices for Variant Calling
Implementing robust variant calling practices is essential for distinguishing true biological variants from sequencing artifacts. The Genome Analysis ToolKit (GATK) Best Practices workflow provides a standardized approach for variant discovery that includes BWA-MEM for read alignment, marking of PCR duplicates, base quality score recalibration, and local realignment around indels [63] [64].
For germline variant calling, tools such as GATK HaplotypeCaller, BCFtools, and FreeBayes have demonstrated high accuracy (F-scores > 0.99) in benchmark datasets [64]. Combining results from two orthogonal SNV/indel callers may offer slight sensitivity advantages, though care must be taken to properly handle complex variants and differences in variant representation when merging variant call sets [64].
In chemical-genetic interaction studies, where accurately identifying genetic determinants of chemical susceptibility is paramount, joint variant calling—which processes all samples simultaneously rather than individually—offers significant advantages. This approach produces called genotypes for every sample at all variant positions, enabling clear differentiation between positions that truly match the reference sequence and positions with insufficient coverage for variant calling [64].
Experimental Strategies for Artifact Reduction
Library Preparation Improvements
Strategic choices during library preparation can significantly reduce the introduction of sequencing artifacts. The selection between sonication and enzymatic fragmentation involves trade-offs between artifact profiles and practical considerations. While enzymatic fragmentation offers advantages in workflow simplicity and minimal DNA loss, sonication fragmentation produces fewer artifact variants (median of 61 vs. 115 in comparative studies) and may be preferable for applications requiring maximum variant accuracy [61].
Incorporating unique molecular identifiers (UMIs) during library preparation provides powerful artifact mitigation by tagging individual molecules before PCR amplification. This approach enables precise identification and removal of PCR duplicates, preventing false allele frequency inflation and erroneous mutation calls that could otherwise distort variant quantification [63]. For samples with limited input material where PCR-free library preparation is not feasible, UMIs offer particularly valuable protection against amplification artifacts.
Table 2: Research Reagent Solutions for Artifact Mitigation
| Reagent/Kit | Primary Function | Role in Artifact Mitigation | Considerations for Use |
|---|---|---|---|
| Unique Molecular Identifiers (UMIs) | Molecular barcoding | Tags individual molecules pre-amplification; enables precise duplicate removal | Essential for low-input samples; requires specialized analysis |
| Rapid MaxDNA Lib Prep Kit | Sonication-based library prep | Reduces enzymatic fragmentation artifacts; fewer artifactual variants | Higher DNA quality requirements; more complex workflow |
| 5 × WGS Fragmentation Mix | Enzymatic fragmentation | Simplified workflow; minimal DNA loss | Higher artifact variant rate; requires robust bioinformatic filtering |
| Hybridization Capture Reagents | Target enrichment | Enables focused sequencing; reduces off-target artifacts | Optimization required for uniform coverage |
| High-Fidelity Polymerases | PCR amplification | Reduces nucleotide incorporation errors; lower error rates | Critical for minimizing amplification artifacts |
Quality Control and Validation
Implementing rigorous quality control protocols at multiple stages of the NGS workflow is essential for identifying potential artifact sources before they compromise data integrity. Key QC measures include:
- Pre-sequencing QC: Verification of DNA quality and quantity, library concentration, and fragment size distribution to ensure optimal sequencing performance [12].
- Post-sequencing QC: Assessment of sequencing metrics including coverage uniformity, base quality scores, GC content distribution, and contamination checks using tools like Picard and Sambamba [64].
- Sample relationship verification: Confirmation of expected sample relationships in family studies and paired samples using algorithms like KING, which is particularly important in chemical-genetic studies comparing treated and untreated samples [64].
Benchmarking against reference datasets provides critical validation for variant calling performance. Resources such as the Genome in a Bottle (GIAB) and Platinum Genome datasets provide "ground truth" variant calls for reference samples, enabling objective assessment of variant calling accuracy within high-confidence genomic regions [64]. For chemical-genetic interaction studies, establishing internal benchmark samples processed alongside experimental samples can provide ongoing performance monitoring and facilitate cross-study comparisons.
Special Considerations for Chemical-Genetic Interaction Profiling
Chemical-genetic interaction profiling presents unique challenges for artifact mitigation due to the critical importance of accurately connecting genetic variants to chemical susceptibility phenotypes. In these studies, artifactual variants can create spurious gene-compound relationships or obscure genuine chemical-genetic interactions, potentially misdirecting research efforts and therapeutic development [60].
Comprehensive chemical-genetic mapping requires particular vigilance against artifacts that might systematically correlate with specific experimental conditions. Batch effects introduced during library preparation or sequencing could create false associations between certain genetic backgrounds and chemical susceptibility if not properly controlled. Implementing randomized sample processing across experimental batches and including control samples in each processing batch can help identify and correct for such technical artifacts.
The interpretation of chemical-genetic interaction profiles should also consider that genes influencing susceptibility to different compounds vary considerably in their resistance determinants. Research has demonstrated that cross-resistance is prevalent only between compounds with similar modes of action, while compounds with different physicochemical properties and cellular targets show distinct resistance determinants [60]. This specificity provides valuable validation for identified chemical-genetic interactions—patterns of cross-resistance that align with mechanistic similarities offer stronger evidence of genuine biological relationships rather than technical artifacts.
Effective mitigation of sequencing artifacts and variant calling pitfalls requires an integrated, multi-layered approach spanning experimental design, laboratory procedures, and bioinformatic analysis. No single strategy provides complete protection against all artifact types, but combining prudent library preparation choices, rigorous quality control, specialized bioinformatic tools, and validation against benchmark resources can significantly enhance variant calling accuracy.
For chemical-genetic interaction profiling research, where accurate variant identification forms the foundation for connecting genetic elements to compound sensitivity, implementing these comprehensive artifact mitigation strategies is particularly crucial. The reliability of conclusions about gene-compound relationships depends directly on the accuracy of underlying variant calls, making robust artifact mitigation an essential component of rigorous study design rather than an optional refinement.
As NGS technologies continue to evolve, new artifact sources will undoubtedly emerge, necessitating ongoing vigilance and adaptation of mitigation strategies. Maintaining awareness of technology-specific limitations, implementing appropriate controls, and applying specialized bioinformatic tools will remain essential for maximizing data integrity and producing reliable, reproducible results in chemical-genetic research and beyond.
In next-generation sequencing (NGS) for chemical-genetic interaction profiling, bioinformatics pipelines transform raw sequence data into interpretable biological insights, such as a compound's mechanism of action (MOA). This process involves quantifying the fitness of pooled microbial mutants exposed to chemical perturbations [66] [67]. The complexity of this data, and the consequences of its misinterpretation, make pipeline standardization not merely a technical detail but a foundational requirement for reproducible and reliable science. In the context of drug development, where chemical-genetic profiles inform hit prioritization and target validation, improperly developed or validated pipelines can generate inaccurate results with significant negative consequences for research trajectories and patient care [68] [69].
The core challenge is variability. Variability in pipeline design, tools, parameters, and operating procedures directly translates into variability in chemical-genetic interaction scores, which can obscure true biological signals and hinder cross-study comparisons. A joint recommendation from the Association for Molecular Pathology and the College of American Pathologists emphasizes that a high degree of variability in how laboratories establish and validate bioinformatics pipelines currently exists, creating an urgent need for published guidance and established best practices [68]. This guide addresses this need by outlining a framework for tool selection and standardization, specifically tailored for NGS-based chemical-genetic research.
Core Standards and Validation Requirements for NGS Pipelines
Before delving into specific tools, it is crucial to establish the performance standards that any clinical or research pipeline must meet. These standards are defined by validation requirements that determine the reliability and accuracy of an NGS assay.
Key Performance Metrics for Pipeline Validation
Systematic validation is the most critical requirement for implementing a bioinformatics pipeline [70]. The New York State Department of Health and other bodies have provided guidelines outlining key performance indicators that laboratories must determine for their NGS tests [71] [69]. The table below summarizes these essential validation parameters.
Table 1: Key Performance Metrics for NGS Bioinformatics Pipeline Validation
| Validation Parameter | Description | Typical Benchmark or Requirement |
|---|---|---|
| Accuracy | Concordance of variant calls with a reference method or known truth set. | Recommended minimum of 50 samples composed of different material types [71]. |
| Analytical Sensitivity | The ability of the pipeline to correctly detect true positives (e.g., true chemical-genetic interactions). | Positive percent agreement compared to a gold standard [71]. |
| Analytical Specificity | The ability of the pipeline to correctly avoid false positives. | Negative percent agreement compared to a gold standard [71]. |
| Precision | The reproducibility of results under defined conditions. | Recommended minimum of three positive samples for each variant type [71]. |
| Repeatability | Ability to return identical results under identical conditions (e.g., same run, operator, pipeline). | Determined by sequencing the same reference multiple times [71]. |
| Reproducibility | Ability to return identical results under changed conditions (e.g., different labs, instruments, pipeline versions). | Determined by processing the upstream pipeline in multiple laboratories using different devices [71]. |
| Robustness | The likelihood of assay success under small, deliberate variations in protocol. | Evaluated by testing the impact of minor, controlled changes to input parameters [71]. |
Implementation and Operational Standards
Beyond performance metrics, operational standards ensure the pipeline functions reliably in a production environment. The College of American Pathologists (CAP) has developed laboratory accreditation checklist requirements that provide a robust framework for this [71] [69]. These include:
- Documentation: Comprehensive documentation of each pipeline component, its data dependencies, and input/output constraints [70].
- Version Control: Systematic use of version control systems (e.g., git, mercurial) for all pipeline source code and semantically versioned deployments (e.g., v1.2.2) [70]. This is critical for tracking changes that may affect results.
- Variant Nomenclature: Use of standardized nomenclature, such as the Human Genome Variation Society (HGVS) system, which is the de-facto standard for clinical reporting [70].
- Data Management: Ensuring data storage, transfer, and confidentiality meet regulatory requirements for protected health information (PHI) where applicable [70].
A Practical Framework for Pipeline Implementation
Translating standards into practice requires a structured, team-based approach. Laboratory directors should consider a multidisciplinary strategy involving clinical and laboratory informatics teams, system architects, molecular pathologists, and quality assurance personnel [70].
The Validation and Version Control Lifecycle
A disciplined approach to validation and version control forms the backbone of a reliable bioinformatics operation. The process is cyclical, ensuring continuous quality assurance even as the pipeline evolves.
This lifecycle emphasizes that validation is not a one-time event. Command-line parameters for each component must be documented and locked before validation [70]. Any subsequent update to the production pipeline must be systematically versioned and revalidated. Because pipeline upgrades can significantly change NGS test results—for instance, by enabling the detection of new variant types—it is a best practice to communicate such changes to all clinical teams and clients [70].
Addressing Bioinformatics Challenges in Variant Calling
Laboratories must be aware of specific bioinformatic challenges that can impact the sensitivity and specificity of their pipelines. A significant contributor to false-negative variants is the inability of some variant calling algorithms to identify phased variants or haplotypes [70]. For example, in cancer research, EGFR in-frame mutations in exon 19 can manifest as multiple variants that represent a haplotype—a variable combination of single nucleotide variants and indels present on the same contiguous sequencing read [70]. A limited number of variant calling algorithms are "haplotype-aware," making it essential for laboratories to carefully review and validate their chosen algorithms for this capability. Tools like VarGrouper have been developed to address the limitation of algorithms lacking haplotype-aware features [70].
Application to Chemical-Genetic Interaction Profiling
The principles of standardization are particularly impactful in chemical-genetic interaction studies, where the goal is to accurately quantify a compound's effect on a pool of genetically perturbed cells.
Experimental Protocol for PROSPECT-Based Screening
The PROSPECT (PRimary screening Of Strains to Prioritize Expanded Chemistry and Targets) platform is a prime example of a standardized chemical-genetic workflow. The following protocol outlines its key steps for MOA discovery in Mycobacterium tuberculosis (Mtb) [66]:
- Library Preparation: A pooled library of hypomorphic Mtb mutants is prepared, where each strain is engineered to be proteolytically depleted of a different essential protein. Each mutant carries a unique DNA barcode [66].
- Chemical Perturbation: The pooled mutant library is exposed to a compound at various doses. A no-compound control is always run in parallel [66].
- Growth and Sequencing: After a defined incubation period, the relative abundance of each mutant in the pool is quantified using next-generation sequencing of the barcode regions [66].
- Chemical-Genetic Interaction (CGI) Profile Generation: For each compound-dose condition, a CGI profile is generated. This is a vector representing the quantitative fitness defect or advantage of each hypomorph in the pool due to the compound's presence [66].
- Reference-Based MOA Prediction (PCL Analysis): The CGI profile of an unknown compound is computationally compared to a curated reference set of profiles from compounds with known MOAs. This Perturbagen CLass (PCL) analysis infers the unknown compound's MOA based on similarity to reference profiles [66].
The Scientist's Toolkit: Essential Reagents and Materials
Success in chemical-genetic profiling depends on a suite of specialized biological and computational reagents. The table below details key solutions used in platforms like PROSPECT and related yeast-based systems.
Table 2: Key Research Reagent Solutions for Chemical-Genetic Interaction Profiling
| Research Reagent | Function in the Experiment | Example from Literature |
|---|---|---|
| Pooled Mutant Library | A collection of genetically barcoded mutant strains (e.g., knockdowns, knockouts) used to screen for chemical-genetic interactions in a single pooled assay. | Hypomorphic Mtb mutants depleted of essential proteins [66]; Diagnostic yeast deletion mutant pool in a drug-sensitized background [67]. |
| Curated Reference Set | A collection of compounds with known, annotated mechanisms of action; used as a benchmark to interpret the profiles of unknown compounds. | A set of 437 compounds with published MOA used for PROSPECT PCL analysis [66]. |
| Drug-Sensitized Strain | A host genetic background with engineered mutations (e.g., in multidrug transporters) to increase sensitivity to bioactive compounds and enhance assay signal. | Yeast pdr1∆ pdr3∆ snq2∆ strain shows ~5x increase in compound hit rate [67]. |
| Bioinformatics Pipeline | A defined set of algorithms for processing raw NGS data, aligning sequences, quantifying barcode abundance, and calculating fitness scores/CGI profiles. | Custom pipelines for processing PROSPECT sequencing data to generate CGI profiles [66]. |
| Genetic Interaction Network | A compendium of quantitative genetic interaction profiles used to functionally interpret chemical-genetic interaction profiles via "guilt-by-association" [67]. | A global yeast genetic interaction network used to annotate compound MOA to biological processes [67]. |
Visualization of the Chemical-Genetic Workflow
The entire process, from chemical screening to MOA prediction, can be visualized as an integrated workflow combining wet-lab and computational steps. The following diagram illustrates the pathway from library preparation to the final mechanism of action prediction, highlighting the central role of the standardized bioinformatics pipeline.
The integration of robust, standardized bioinformatics pipelines is what transforms high-volume NGS data into trustworthy biological discovery. For chemical-genetic interaction profiling, this rigor enables the accurate identification of chemical-genetic interactions and reliable prediction of a compound's mechanism of action. By adhering to established validation standards, implementing disciplined version control, and leveraging curated reference sets and reagents, research and clinical laboratories can significantly reduce variability in their analyses. This, in turn, accelerates the drug discovery process, from the initial prioritization of hit compounds in platforms like PROSPECT to the development of novel therapeutics with defined molecular targets. As the field advances towards multiomic integration and AI-powered analytics [14], the foundational practices of tool selection and standardization will only grow in importance, ensuring that the insights gleaned from NGS data are both profound and reliable.
The advent of next-generation sequencing (NGS) has revolutionized genomics research, generating vast amounts of genetic variant data. However, a significant challenge persists in translating these variant lists into meaningful biological mechanisms that can inform drug discovery and therapeutic development. This technical guide explores integrated computational and experimental frameworks for contextualizing genetic variants within biological pathways and functional networks, with particular emphasis on chemical-genetic interaction profiling. By leveraging advanced bioinformatics tools, multi-omics integration, and functional validation strategies, researchers can bridge the gap between genetic observations and mechanistic understanding, ultimately accelerating targeted therapeutic development in precision medicine.
Next-generation sequencing technologies have transformed genomic analysis by enabling rapid, high-throughput sequencing of millions of DNA fragments simultaneously, providing comprehensive insights into genome structure, genetic variations, and gene expression profiles [2]. The versatility of NGS platforms has expanded the scope of genomics research, facilitating studies on rare genetic disorders, cancer genomics, microbiome analysis, and infectious diseases [54]. However, the primary challenge has shifted from data generation to biological interpretation—moving beyond simply identifying genetic variants to understanding their functional consequences in relevant biological contexts.
Variant interpretation represents the critical process of analyzing changes in DNA sequences to determine their potential clinical significance, assessing whether particular genetic alterations are benign, disease-causing, or of uncertain significance [72]. This process forms the foundational bridge between raw genetic data and actionable clinical insights, enabling targeted interventions and personalized care approaches. Within chemical-genetic interaction profiling, variant interpretation takes on additional dimensions, requiring researchers to connect genetic perturbations with compound sensitivity patterns to elucidate mechanisms of drug action and identify novel therapeutic targets.
Foundational Principles of Variant Analysis
Variant Classification Frameworks
Accurate clinical variant analysis relies on established frameworks that guide the interpretation process, ensuring genetic variants are classified correctly to minimize misinterpretation and potential impacts on patient care [72]. The standardized approach involves categorizing variants into five distinct classifications:
- Benign and Likely Benign: Variants with strong evidence supporting no disease association
- Uncertain Significance (VUS): Variants with insufficient or conflicting evidence for classification
- Likely Pathogenic and Pathogenic: Variants with strong evidence supporting disease association
These classifications depend on the strength of evidence supporting the variant's relationship to disease, incorporating population data, computational predictions, functional studies, and genotype-phenotype correlations [72].
Key Analytical Considerations
Several critical factors must be evaluated during variant interpretation to ensure accurate biological contextualization:
Allele Frequency: Data from population databases like gnomAD help determine whether a variant is too common in the general population to be linked to a rare genetic disorder, with variants exceeding 5% frequency in healthy populations typically classified as benign [72].
Inheritance Patterns: Understanding whether a condition follows autosomal dominant, autosomal recessive, or X-linked inheritance patterns helps assess whether a variant aligns with observed family history or clinical features [72].
Functional Impact: Computational tools predict the likelihood of variants causing disruption of protein function, splicing alterations, or other critical biological processes, though these predictions require validation through experimental evidence [72].
Methodologies for Advanced Variant Interpretation
Data Collection and Quality Assessment
Accurate clinical variant interpretation begins with high-quality data collection and robust quality assessment. Without reliable inputs, downstream analysis risks being flawed, leading to incorrect conclusions and potentially harmful clinical decisions [72]. Three critical aspects must be prioritized during this initial phase:
First, comprehensive patient information—including clinical history, genetic reports, and family data—provides essential context for interpreting genetic variants. Clinical history helps correlate observed symptoms with potential genetic causes, while family history can reveal inheritance patterns or segregating mutations. Second, automated quality assurance systems enable real-time monitoring of sequencing data integrity throughout analysis, flagging inconsistencies, detecting sample contamination, or identifying technical artifacts. Third, compliance with recognized standards, such as ISO 13485, governs quality management systems for medical devices, ensuring systematic approaches to quality while aligning processes with international best practices [72].
Database Utilization and Computational Predictions
Genomic databases play an essential role in supporting clinical variant interpretation by providing curated information on genetic variants:
Table 1: Key Genomic Databases for Variant Interpretation
| Database | Primary Function | Application in Variant Interpretation |
|---|---|---|
| ClinVar | Public archive of genetic variants and clinical significance | Cross-reference variants with prior classifications, literature citations, and supporting evidence [72] |
| gnomAD | Aggregates population-level data from large-scale sequencing projects | Assess variant frequency across diverse populations to determine rarity and potential disease association [72] |
| CIViC | Community-driven resource for clinical interpretation of variants in cancer | Provides curated information on cancer-related variants, therapeutic implications, and evidence levels [72] |
Computational prediction tools represent another critical methodology, analyzing how amino acid changes caused by genetic variants might affect protein structure or function. These tools evaluate evolutionary conservation of amino acid residues across species, predicting whether substitutions are likely deleterious. Others integrate structural and sequence-based information to assess variant impact. While not definitive alone, they provide important prioritization for further investigation [72]. Automated platforms can streamline this process by integrating computational predictions with multi-level data filtering strategies, systematically narrowing variant lists to those most likely clinically relevant by combining population databases, disease-specific datasets, and in silico predictions [72].
Functional Validation Approaches
Functional assays provide laboratory-based validation of genetic variant biological impact, offering evidence beyond computational predictions or statistical correlations:
Protein Function Assays: Evaluate processes such as protein stability, enzymatic activity, or cellular signaling pathways to determine whether variants contribute to disease or are benign
Splicing Assays: Reveal whether variants disrupt normal RNA processing, potentially altering gene function
* Cellular Models*: Implement engineered cell systems to assess variant effects in relevant biological contexts
Cross-laboratory standardization through external quality assessment programs ensures consistency and reliability in functional assay results. Participation in programs organized by the European Molecular Genetics Quality Network (EMQN) and Genomics Quality Assessment (GenQA) promotes standardized practices and quality assurance, evaluating laboratory performance to ensure reproducibility and comparability of results across institutions [72].
Chemical-Genetic Interaction Profiling: The PROSPECT Platform
Chemical-genetic interaction profiling represents a powerful approach for elucidating small molecule mechanisms of action by systematically analyzing how genetic perturbations alter compound sensitivity. The PROSPECT (PRimary screening Of Strains to Prioritize Expanded Chemistry and Targets) platform exemplifies this methodology, measuring chemical-genetic interactions between small molecules and pooled Mycobacterium tuberculosis mutants, each depleted of a different essential protein [4].
This platform couples small molecule discovery to mechanism of action (MOA) information by screening compounds against a pool of hypomorphic Mtb strains, each engineered to be proteolytically depleted of a different essential protein. The degree to which each hypomorph in the pool is affected by a compound is measured using next-generation sequencing to quantify changes in abundances of hypomorph-specific DNA barcodes [4]. The impact of chemical perturbation on genetically engineered hypomorphic strains manifests as chemical-genetic interactions (CGIs), with the readout for each compound-dose condition being a vector of hypomorph responses—a CGI profile that serves as a functional fingerprint of compound activity [4].
Perturbagen Class (PCL) Analysis for MOA Prediction
Perturbagen Class (PCL) analysis is a computational method that infers a compound's mechanism of action by comparing its chemical-genetic interaction profile to those of a curated reference set of known molecules [4]. This reference-based approach enables rapid MOA assignment and hit prioritization, streamlining antimicrobial discovery. In practice, PCL analysis demonstrated 70% sensitivity and 75% precision in leave-one-out cross-validation, with comparable results (69% sensitivity, 87% precision) achieved using a test set of 75 antitubercular compounds with known MOA previously reported by GlaxoSmithKline [4].
The significant value of this reference-based approach lies in its ability to rapidly identify: (1) new scaffolds for validated, valuable targets that can circumvent existing resistance; (2) scaffolds that work by known MOAs of low interest, enabling early deprioritization; and (3) scaffolds that work by completely novel MOAs not represented in the reference set [4]. From a set of approximately 5,000 compounds from larger unbiased libraries, this approach identified a novel QcrB-targeting scaffold that initially lacked wild-type activity, experimentally confirming this prediction while enabling chemical optimization of the scaffold [4].
Multi-Omics Integration for Enhanced Biological Context
Beyond Genomics: Comprehensive Molecular Profiling
While genomics provides valuable insights into DNA sequences, it represents only one dimension of biological complexity. Multi-omics approaches combine genomics with additional layers of biological information to provide a comprehensive view of biological systems [54]. This integrative methodology links genetic information with molecular function and phenotypic outcomes through several key domains:
- Transcriptomics: RNA expression levels that reflect active gene expression patterns
- Proteomics: Protein abundance, modifications, and interactions that execute cellular functions
- Metabolomics: Metabolic pathways and compounds that represent functional outputs of cellular processes
- Epigenomics: Epigenetic modifications including DNA methylation that regulate gene expression
The integration of artificial intelligence with multi-omics data has further enhanced predictive capacity for biological outcomes, contributing to significant advancements in precision medicine [54]. AI algorithms, particularly machine learning models, can identify patterns, predict genetic variations, and accelerate discovery of disease associations across these complex datasets.
Applications in Disease Research and Drug Discovery
Multi-omics integration has demonstrated particular value across several research domains:
Cancer Research: Multi-omics helps dissect the tumor microenvironment, revealing interactions between cancer cells and their surroundings while identifying therapeutic vulnerabilities [54]
Cardiovascular Diseases: Combining genomics and metabolomics identifies biomarkers for heart diseases and potential intervention points [54]
Neurodegenerative Diseases: Multi-omics studies unravel complex pathways involved in conditions like Parkinson's and Alzheimer's, identifying novel therapeutic targets [54]
Infectious Disease: Chemical-genetic interaction profiling combined with transcriptomic and proteomic data elucidates compound mechanisms of action against pathogenic organisms [4]
Table 2: Multi-Omics Technologies and Their Applications in Variant Interpretation
| Omics Layer | Technology Platforms | Relevance to Variant Interpretation |
|---|---|---|
| Genomics | Whole Genome Sequencing, Targeted Panels | Identifies sequence variants and structural variations [2] |
| Transcriptomics | RNA-Seq, Single-Cell RNA-Seq | Reveals functional consequences of variants on gene expression [54] |
| Epigenomics | Bisulfite Sequencing, ChIP-Seq | Identifies regulatory mechanisms influenced by genetic variants [54] |
| Proteomics | Mass Spectrometry, Protein Arrays | Determines variant effects on protein structure and function [54] |
| Metabolomics | LC-MS, GC-MS | Captures downstream biochemical consequences of genetic variants [54] |
The Scientist's Toolkit: Essential Research Reagents and Solutions
Successful implementation of chemical-genetic interaction profiling and variant interpretation requires specific research reagents and solutions designed to address technical challenges in genomic analysis and functional validation:
Table 3: Essential Research Reagents for Chemical-Genetic Interaction Studies
| Research Reagent | Function | Application Context |
|---|---|---|
| Hypomorphic Mutant Libraries | Pooled strains with depleted essential proteins | PROSPECT screening platform for identifying chemical-genetic interactions [4] |
| DNA Barcodes | Unique sequence identifiers for individual mutants | Tracking mutant abundance in pooled screens via NGS [4] |
| Curated Reference Compounds | Compounds with annotated mechanisms of action | PCL analysis for MOA prediction through profile comparison [4] |
| Quality Control Standards | Reference materials for assay standardization | Ensuring reproducibility across functional genomic screens [72] |
| Functional Assay Kits | Reagents for validating variant impact | Experimental confirmation of computational predictions [72] |
| Multi-omics Sample Prep Kits | Integrated workflows for parallel molecular profiling | Simultaneous extraction of DNA, RNA, and proteins [54] |
Experimental Protocols for Chemical-Genetic Interaction Studies
PROSPECT Screening Protocol
The PROSPECT platform employs a standardized protocol for chemical-genetic interaction profiling:
Mutant Pool Preparation: Culture pooled hypomorphic Mycobacterium tuberculosis mutants, each depleted of a different essential protein and containing unique DNA barcodes [4]
Compound Screening: Expose the mutant pool to test compounds across a range of concentrations, ensuring appropriate controls and replicates
Barcode Extraction and Sequencing: Harvest cells after compound exposure, extract genomic DNA, and amplify barcode sequences for NGS library preparation [4]
Sequence Analysis and Quantification: Process NGS data to quantify barcode abundances, representing relative fitness of each mutant under compound treatment
Chemical-Genetic Interaction Profile Generation: Calculate fitness scores normalized to untreated controls, generating a vector of interaction strengths across the mutant collection [4]
PCL Analysis and MOA Prediction: Compare CGI profiles to reference database using computational methods to predict compound mechanism of action [4]
Functional Validation Protocol for Predicted Targets
Following computational prediction of compound targets, confirmatory experiments validate these hypotheses:
Resistance Mutant Generation: Isolate or engineer strains with mutations in putative target genes, predicting these will confer resistance to compounds hitting that target [4]
Cytochrome bd Mutant Sensitivity Profiling: Test compounds against mutants lacking cytochrome bd oxidase, as increased sensitivity often indicates targeting of the cytochrome bcc-aa3 complex [4]
Biochemical Binding Assays: Measure direct compound binding to purified target proteins using methods like surface plasmon resonance or thermal shift assays
* Cellular Phenocopy Experiments*: Compare compound-treated wild-type cells to genetic knockdowns of putative targets, assessing similarity of phenotypic responses
The integration of next-generation sequencing with chemical-genetic interaction profiling represents a powerful framework for advancing drug discovery and functional genomics. By moving beyond simple variant lists to mechanistic insights, researchers can prioritize compounds based on biological mechanism rather than potency alone, enabling more informed decisions in early drug development. The PROSPECT platform and PCL analysis methodology demonstrate how systematic mapping of chemical-genetic interactions can elucidate small molecule mechanisms of action, even for compounds initially lacking apparent activity against wild-type strains [4].
As genomic technologies continue evolving, several emerging trends will further enhance biological contextualization of genetic variants. The integration of artificial intelligence with multi-omics datasets will enable more accurate prediction of variant functional impacts [54]. Single-cell sequencing technologies will reveal cellular heterogeneity in variant responses [54], while spatial transcriptomics will map genetic interactions within tissue architecture [14]. Long-read sequencing technologies will improve characterization of complex genomic regions [2], and CRISPR-based functional genomics will enable high-throughput validation of variant effects [54].
These advancing methodologies promise to accelerate the transformation of genomic data into therapeutic insights, ultimately realizing the potential of precision medicine across diverse disease contexts. By continuing to develop and refine approaches for biological contextualization of genetic variants, researchers can systematically bridge the gap between genotype and phenotype, enabling more effective targeting of therapeutic interventions based on comprehensive understanding of disease mechanisms.
Benchmarking Success: Validating NGS Profiling Data and Comparative Analysis with Traditional Methods
Next-Generation Sequencing (NGS) has emerged as a transformative tool in biological research, enabling unprecedented resolution in profiling chemical-genetic interactions (CGIs). Platforms like PROSPECT (PRimary screening Of Strains to Prioritize Expanded Chemistry and Targets) leverage CGI profiles to elucidate the mechanism of action (MOA) of small molecules by screening them against pooled libraries of hypomorphic Mycobacterium tuberculosis mutants [4]. The power of such advanced applications is wholly dependent on the establishment of robust, validated, and regulatory-compliant NGS assays. This guide details the essential protocols for achieving this confidence, ensuring that NGS data is both scientifically reliable and meets stringent quality standards.
The Research Context: NGS in Chemical-Genetic Interaction Profiling
In chemical-genetic interaction profiling, the response of a library of genetically perturbed cells to a compound is measured to infer the compound's target or MOA. The PROSPECT platform, for instance, uses NGS to quantify the change in abundance of DNA-barcoded hypomorphic mutants after chemical exposure. The resulting CGI profile serves as a fingerprint for the compound's biological activity [4].
The transition from a research-grade screening result to a validated, compliant assay is critical for:
- Hit Prioritization: Confidently selecting compounds for development based on validated MOA information.
- Regulatory Submissions: Providing the data required for investigational new drug (IND) applications.
- Clinical Translation: Ensuring the safety and efficacy of therapies derived from basic research.
The following workflow outlines the core process of using NGS for CGI profiling and the parallel validation pathway required for regulatory confidence.
Core Principles of NGS Assay Validation
Assay validation is a systematic process that demonstrates an analytical method is suitable for its intended use by establishing performance characteristics such as accuracy, precision, and sensitivity. For NGS-based assays, this process spans wet-lab procedures and bioinformatics analysis [73] [74].
Key Performance Metrics for NGS Assay Validation
The table below summarizes the core analytical performance metrics that must be established during NGS assay validation, their definitions, and how they are typically evaluated.
Table 1: Essential Performance Metrics for NGS Assay Validation
| Metric | Definition | Validation Approach & Considerations |
|---|---|---|
| Accuracy | The closeness of agreement between a measured value and a known reference value [75]. | Use of validated reference materials (e.g., Genome in a Bottle standards). Comparison of variant calls to known truth sets. Evaluates both base calling and variant calling accuracy [74]. |
| Precision | The closeness of agreement between repeated measurements of the same sample. | Includes repeatability (same conditions, short time) and reproducibility (different conditions, operators, instruments). Measured using percent concordance of variants across replicates [74]. |
| Analytical Sensitivity | The ability of the assay to correctly detect a true positive variant (detection rate). | Determined by the assay's limit of detection (LOD), the lowest variant allele frequency (VAF) that can be reliably detected. Established by diluting positive samples to low VAFs [75] [76]. |
| Analytical Specificity | The ability of the assay to correctly not detect a variant when it is absent (true negative rate). | Evaluated by testing samples known to be negative for the variants of interest. For virus detection, this involves the "breadth of detection" against a panel of viral agents [76]. |
| Reportable Range | The range of genetic variants that can be reliably detected and reported by the assay. | Defined by the types of variants the assay can identify (e.g., SNVs, indels, CNVs, SVs) and the acceptable allelic frequency or coverage depth limits [74]. |
| Robustness | The capacity of the assay to remain unaffected by small, deliberate variations in method parameters. | Tested by varying factors like reagent lots, incubation times, temperature, and personnel to ensure consistent performance [73]. |
The Validation Workflow: From Design to Compliance
A structured, phased approach to validation is critical for success. Guidance from the College of American Pathologists (CAP) and the Clinical and Laboratory Standards Institute (CLSI) provides a framework through a series of worksheets that guide the entire test life cycle [74].
Phase 1: Test Familiarization and Content Design This initial phase involves strategic planning before test development. Key activities include defining the clinical or research question, specifying the target genes or regions, and identifying critical variants. For CGI profiling, this means defining the mutant library and the required sequencing coverage for each barcode [74].
Phase 2: Assay Design and Optimization This phase translates design requirements into a functional assay. It involves selecting the sequencing methodology (e.g., whole-genome, targeted), library preparation protocol, and platform. For targeted approaches like hybrid-capture or amplicon-based sequencing, this step ensures uniform coverage over all critical regions [30] [74].
Phase 3: Analytical Validation This is the experimental core of the process, where the performance metrics in Table 1 are formally established. A validation plan is executed using appropriate reference materials, and data is analyzed to prove the assay meets pre-defined acceptance criteria [74].
Phase 4: Quality Management This phase establishes procedures for ongoing quality control (QC) during routine operation. This includes monitoring pre-analytical (sample quality), analytical (library concentration, cluster density), and post-analytical (coverage uniformity, variant call quality) metrics to ensure the assay continues to perform as validated [73] [74].
Phase 5: Bioinformatics Validation The NGS computational pipeline must be rigorously validated. This includes ensuring the accuracy and reproducibility of data analysis steps, from base calling and read alignment to variant calling and annotation. Pipelines must be locked down after validation [73] [74].
Phase 6: Regulatory Compliance and Documentation Comprehensive documentation of all previous phases is assembled. This includes the validation plan, standard operating procedures (SOPs), and the final validation report, creating an auditable trail for regulatory bodies [73] [76].
Navigating the Regulatory and Quality Landscape
Adherence to regulatory guidelines and quality standards is non-negotiable for assays used in drug development and clinical applications.
Key Regulatory Guidelines and Quality Initiatives
- ICH Q5A(R2): This recent revision encourages the use of NGS technologies to supplement or replace in-vivo assays for viral safety evaluation of biological products, emphasizing the need for a comprehensive validation package [76].
- FDA & EMA Guidelines: Both agencies have issued guidelines for the design, development, and validation of NGS-based tests, providing a framework for the premarket review process [76].
- The NGS Quality Initiative (NGS QI): A CDC-led initiative that provides publicly available tools and resources to help laboratories build a robust Quality Management System (QMS), including documents for method validation plans and SOPs [73].
- CLSI Guideline MM09: This guideline, in conjunction with instructional worksheets, provides step-by-step recommendations for designing, validating, reporting, and quality management of clinical NGS tests [74].
Computerized System Validation (CSV)
For GMP-compliant NGS workflows, the software used for data analysis must undergo CSV. This ensures the computerized system consistently and reliably performs its intended functions. Key steps include:
- Installation Qualification (IQ): Verifying software is installed correctly.
- Operational Qualification (OQ): Testing system functionalities to confirm they operate as specified.
- Performance Qualification (PQ): Demonstrating the system works for its intended purpose in a production environment [76].
The Scientist's Toolkit: Essential Reagents and Materials
A successful and validated NGS assay depends on high-quality, well-characterized reagents and materials throughout the workflow.
Table 2: Essential Research Reagent Solutions for NGS Assay Validation
| Item | Function in Validation | Specific Examples & Considerations |
|---|---|---|
| Reference Standards | Provide a ground truth for establishing accuracy, sensitivity, and precision. | Genome in a Bottle (GIAB) standards: For human genomics. Spiked-in viral RNAs/DNAs: For establishing LOD in virus safety assays [76]. Characterized mutant pools: For CGI assay validation [74]. |
| Library Prep Kits | Convert nucleic acid samples into sequencer-ready libraries. | Select kits with demonstrated low bias and high reproducibility. Validation must account for kit lot-to-lot variability [30] [2]. |
| Control Materials | Monitor assay performance in each run (positive, negative, internal controls). | Positive Control: A known sample with expected variants. Negative Control: A sample without target variants (e.g., water, well-characterized negative sample). Internal Controls: Spike-in synthetic sequences to monitor capture efficiency and sequencing depth [74]. |
| Sequencing Platforms | Generate the raw data; platform choice affects read length, error profile, and throughput. | Illumina: Short-read, high accuracy for variant calling [2]. PacBio/Oxford Nanopore: Long-read for resolving complex regions [75]. The platform must be validated for its intended application. |
| Bioinformatics Tools | Transform raw data into actionable biological information. | Read alignment (BWA), variant calling (GATK), annotation (ANNOVAR). Tools must be version-controlled and validated as part of the bioinformatics pipeline [74] [2]. |
The integration of NGS into high-stakes research and development, such as chemical-genetic interaction profiling, demands a rigorous commitment to assay validation and regulatory compliance. By adhering to a structured framework—encompassing strategic assay design, thorough analytical characterization, robust quality management, and comprehensive documentation—researchers and drug developers can establish the necessary confidence in their data. This foundation of trust is paramount for effectively prioritizing therapeutic hits, streamlining development pathways, and ultimately delivering safe and effective treatments to patients. As regulatory guidance continues to evolve, a proactive and meticulous approach to validation will remain the cornerstone of reliable and compliant NGS applications.
Next-generation sequencing (NGS) has revolutionized the field of genomics and pathogen detection, offering a powerful alternative to traditional microbiological methods. In the context of chemical-genetic interaction profiling for drug discovery, understanding the performance characteristics of these technologies is paramount for researchers aiming to identify novel antimicrobial compounds and their mechanisms of action (MOA). This technical guide provides a comprehensive comparison of NGS and traditional methods, focusing on their respective sensitivities, specificities, and applications in modern research settings. The transition from traditional culture-based techniques and targeted molecular assays to NGS-based approaches represents a paradigm shift in how researchers approach pathogen identification and resistance profiling, enabling unprecedented insights into complex biological systems at a scale previously unimaginable [2]. For drug development professionals working on antimicrobial discovery, these technological advances are particularly transformative, allowing for the rapid elucidation of compound MOA through sophisticated chemical-genetic interaction profiling.
Performance Comparison: Quantitative Data Analysis
Multiple clinical studies have directly compared the diagnostic performance of NGS technologies against traditional microbial detection methods across various sample types and clinical scenarios. The table below summarizes key performance metrics from recent investigations:
Table 1: Comparative Performance Metrics of NGS vs. Traditional Methods
| Study & Sample Type | Method | Sensitivity (%) | Specificity (%) | Detection Rate (%) | Pathogens Identified |
|---|---|---|---|---|---|
| Lower Respiratory Tract Infections (BALF, n=71) [77] | mNGS | 84.5 (detection rate) | - | 84.5 | Mycobacterium, Streptococcus pneumoniae, Klebsiella pneumoniae, Aspergillus, viruses |
| Traditional Culture/NAAT | 26.8 (detection rate) | - | 26.8 | Invasive Aspergillus, Pseudomonas aeruginosa, Candida albicans | |
| Central Nervous System Infections (CSF, n=4,828) [78] | mNGS | 63.1 | 99.6 | 14.4 | DNA/RNA viruses, bacteria, fungi, parasites |
| Serologic Testing | 28.8 | - | - | - | |
| Direct Detection Testing | 45.9 | - | - | - | |
| Pediatric Pneumonia (BALF, n=206) [79] | tNGS | 96.4 | 66.7 | 97.0 | Broad spectrum of respiratory pathogens |
| Conventional Tests | - | - | 52.9 | Limited to target pathogens | |
| Periprosthetic Joint Infection (Meta-analysis) [80] | mNGS | 89 | 92 | - | Broad pathogen detection |
| tNGS | 84 | 97 | - | Targeted pathogen detection |
The consistent theme across these studies is the superior detection capability of NGS platforms compared to traditional methods. In lower respiratory tract infections, mNGS demonstrated a 3.2-fold higher detection rate (84.5% vs. 26.8%) compared to traditional culture and nucleic acid amplification techniques [77]. Similarly, in pediatric pneumonia, tNGS detected pathogens in 97.0% of cases versus 52.9% with conventional methods [79]. The exceptional specificity of NGS (99.6% for CNS infections) confirms its reliability for confirming infections when positive results are obtained [78].
Table 2: Advantages and Limitations of NGS vs. Traditional Methods
| Parameter | NGS Methods | Traditional Methods |
|---|---|---|
| Detection Range | Comprehensive, unbiased detection of bacteria, viruses, fungi, parasites [77] [78] | Limited to pre-specified targets |
| Turnaround Time | 1-3 days (sequencing), faster than some traditional methods [77] [78] | 2-7 days (culture), faster for some NAAT |
| Sensitivity | Significantly higher for most pathogens [77] [81] [79] | Lower, especially for fastidious organisms |
| Specificity | High (92-99.6%) [80] [78] | Generally high for targeted pathogens |
| Quantitative Capability | Limited, semi-quantitative at best | Excellent for culture (CFU/mL) |
| Antimicrobial Resistance | Genotypic prediction only, cannot reliably predict phenotype [81] | Direct phenotypic testing available |
| Cost Considerations | Higher per-test cost | Lower per-test cost but may require multiple tests |
NGS Methodologies and Experimental Protocols
Metagenomic NGS (mNGS) Workflow
The mNGS protocol represents a hypothesis-free approach that sequences all nucleic acids in a sample without predetermined targets. The standard workflow begins with sample collection from relevant sources such as bronchoalveolar lavage fluid (BALF) or cerebrospinal fluid (CSF), followed by nucleic acid extraction that typically includes steps to reduce host background contamination [78]. For DNA libraries, this involves antibody-based methylated DNA removal, while RNA libraries undergo DNase treatment. Library preparation utilizes fragmentation, end-repair, adapter ligation, and amplification steps to create sequencing-ready libraries [77].
Sequencing is performed using platforms such as the Illumina NextSeq system, generating approximately 20 million single-end 75-bp reads per library. Bioinformatic analysis follows, beginning with the removal of human sequence data (GRCh38.p13) followed by alignment of remaining sequences to comprehensive microbial databases such as NCBI GenBank and curated in-house databases [77]. Interpretation includes establishing thresholds for pathogen detection while accounting for potential contaminants through the use of negative controls.
Targeted NGS (tNGS) Workflow
Targeted NGS employs a more focused approach that enriches for specific pathogens of interest prior to sequencing. The protocol begins with sample collection similar to mNGS, followed by nucleic acid extraction. The key distinction emerges during library preparation, where tNGS utilizes pathogen-specific primers to amplify target sequences through multiplex PCR reactions [79]. For respiratory pathogen detection, one implementation uses a set of 153 microorganism-specific primers covering bacteria, viruses, fungi, mycoplasma, and chlamydia, accounting for >95% of common respiratory infections.
The amplified products undergo purification and a second round of PCR to add sequencing adapters and barcodes. Quality control assessments ensure library fragments range between 250-350 bp with concentrations ≥0.5 ng/μL before pooling and sequencing [79]. This targeted enrichment allows for greater sequencing depth for pathogens of interest while reducing background noise and host contamination.
PROSPECT Platform for Chemical-Genetic Interaction Profiling
The PROSPECT (PRimary screening Of Strains to Prioritize Expanded Chemistry and Targets) platform represents a specialized application of NGS technology for antimicrobial discovery and mechanism of action studies. This innovative approach screens chemical compounds against a pooled collection of hypomorphic Mycobacterium tuberculosis mutants, each depleted of a different essential protein [4] [82].
The methodology involves cultivating the mutant pool in the presence of test compounds, followed by extraction of genomic DNA and amplification of strain-specific barcodes. NGS quantifies barcode abundance changes, generating chemical-genetic interaction (CGI) profiles that reveal which hypomorphic strains show heightened sensitivity to each compound [4]. The Perturbagen CLass (PCL) computational method then compares these profiles to a reference set of compounds with known mechanisms of action, enabling MOA prediction for novel compounds with high accuracy (70% sensitivity, 75% precision in leave-one-out validation) [4].
The Scientist's Toolkit: Research Reagent Solutions
Table 3: Essential Research Reagents for NGS-based Pathogen Detection and Chemical-Genetic Interaction Studies
| Reagent/Category | Function | Examples/Specifications |
|---|---|---|
| Nucleic Acid Extraction Kits | Isolation of high-quality DNA/RNA from diverse sample types | Proteinase K lyophilized powder (R6672B-F-96/48/24, Magen) [79] |
| Library Preparation Kits | Preparation of sequencing-ready libraries from nucleic acids | Respiratory Pathogen Detection Kit (KS608-100HXD96, KingCreate) [79] |
| Enzymes for Molecular Biology | Nucleic acid modification and amplification | DNA ligase, polymerases, DNase for host depletion [2] [78] |
| Pathogen-Specific Primers | Targeted amplification of microbial sequences | 153 microorganism-specific primer sets for respiratory pathogens [79] |
| Sequencing Platforms | High-throughput nucleic acid sequencing | Illumina NextSeq, NovaSeq X; Oxford Nanopore; PacBio SMRT [2] [12] |
| Bioinformatic Databases | Reference databases for pathogen identification | NCBI GenBank, curated microbial genomes, in-house databases [77] [2] |
| Hypomorphic Mutant Libraries | Chemical-genetic interaction profiling | Pooled M. tuberculosis mutants with depleted essential genes [4] [82] |
Technological Advances and Future Directions
NGS technology continues to evolve rapidly, with recent breakthroughs including Illumina's XLEAP-SBS chemistry that delivers increased speed and sequencing fidelity, and the NovaSeq X Series providing extraordinary throughput of up to 16 Tb per run [12]. The emergence of third-generation sequencing technologies such as Pacific Biosciences' single-molecule real-time (SMRT) sequencing and Oxford Nanopore's nanopore-based sequencing offers additional capabilities for long-read sequencing, enabling real-time analysis and improved detection of structural variations [2].
The integration of artificial intelligence and machine learning with NGS data analysis represents another significant advancement. Tools such as Google's DeepVariant utilize deep learning to identify genetic variants with greater accuracy than traditional methods, while AI models help analyze polygenic risk scores and identify novel drug targets by extracting patterns from complex genomic datasets [54]. For chemical-genetic interaction profiling, computational methods like PCL analysis demonstrate how reference-based approaches can leverage growing compound databases to predict mechanisms of action with increasing precision [4].
Multi-omics approaches that combine genomics with transcriptomics, proteomics, and epigenomics are expanding the applications of NGS in drug discovery research. These integrated methods provide comprehensive views of biological responses to chemical perturbagens, enabling researchers to connect compound-induced changes across multiple molecular layers [54]. For tuberculosis drug discovery specifically, the PROSPECT platform with PCL analysis has identified novel scaffolds targeting QcrB, a subunit of the cytochrome bcc-aa3 complex, including compounds that initially lacked wild-type activity but were optimized through subsequent chemistry efforts [4].
The comparative analysis of NGS versus traditional methods reveals a clear trajectory toward the adoption of sequencing-based approaches for pathogen detection and chemical-genetic interaction profiling in drug discovery research. The significantly higher sensitivity of NGS technologies, combined with their comprehensive detection range and rapidly decreasing costs, positions them as indispensable tools for modern antimicrobial development. While traditional methods retain value for specific applications such as phenotypic drug susceptibility testing, the integration of NGS into research pipelines enables unprecedented insights into compound mechanisms of action, accelerating the identification and optimization of novel therapeutic agents against challenging targets such as Mycobacterium tuberculosis.
For researchers and drug development professionals, the implementation of NGS-based strategies like the PROSPECT platform with PCL analysis represents a transformative approach to overcoming historical bottlenecks in antibiotic discovery. These methods provide both greater sensitivity in compound screening and crucial mechanistic insights early in the development process, facilitating more informed prioritization of lead compounds. As NGS technologies continue to advance, with improvements in sequencing chemistry, bioinformatic analysis, and multi-omics integration, their role in elucidating the complex interactions between chemical compounds and biological systems will undoubtedly expand, driving innovation in therapeutic development for infectious diseases.
In the field of chemical-genetic interaction profiling using next-generation sequencing (NGS), the reliability of biological conclusions depends entirely on the rigorous quantification of analytical performance. Techniques such as PROSPECT (PRimary screening Of Strains to Prioritize Expanded Chemistry and Targets) leverage NGS to decode how chemical perturbations affect pools of genetically engineered hypomorphic strains, generating chemical-genetic interaction (CGI) profiles that inform on a compound's mechanism of action (MOA) [4]. The transition of these powerful screening methods from research tools to decision-making platforms in drug discovery necessitates robust, standardized metrics to characterize their limits. This guide provides an in-depth technical framework for quantifying the three cornerstone metrics of analytical performance—Limit of Detection (LOD), Reproducibility, and Linearity—specifically within the context of NGS-based chemical-genetic interaction profiling.
Core Performance Metrics: Definitions and Quantitative Benchmarks
For NGS assays, particularly those measuring allele frequencies or transcript abundances in pooled screens, specific performance characteristics must be established. The following metrics are non-negotiable for validating a method's suitability for purpose.
Table 1: Core Performance Metrics for NGS-Based Chemical-Genetic Interaction Profiling
| Metric | Definition | Typical Target in NGS Studies | Key Influencing Factors |
|---|---|---|---|
| Limit of Detection (LOD) | The lowest allele frequency or abundance change that can be reliably distinguished from background [83]. | Often between 0.1% to 10% for allele frequency, depending on sequencing depth and design [83] [84] [85]. | Sequencing depth, background error rate, library preparation uniformity, bioinformatics pipeline [83] [56]. |
| Reproducibility | The ability of an assay to yield consistent results across technical and inter-laboratory replicates [86] [87]. | High intra- and inter-laboratory concordance (>95%) for targeted NGS [86] [88]. | Sequencing platform, library prep protocol, bioinformatics tools, data normalization methods [86] [87]. |
| Linearity | The ability of an assay to provide results that are directly proportional to the true analyte concentration or frequency across a specified range [84]. | A strong correlation (R > 0.99) between expected and observed frequencies in dilution series [84]. | Assay dynamic range, sample quality, accuracy of the reference material [84] [89]. |
Experimental Quantification of Limit of Detection (LOD)
The LOD establishes the sensitivity threshold for detecting rare events, such as a hypomorphic strain dropping out of a pool or a low-frequency somatic mutation.
Detailed Protocol for LOD Determination:
- Reference Material Preparation: Obtain or create a reference standard with known, pre-validated allele frequencies. This can be genomic DNA with mutations validated by droplet digital PCR (ddPCR) [83] or serial dilutions of a specific strain in a background of wild-type cells.
- Replicate Sequencing: Process the reference material in multiple technical replicates (e.g., quadruplicate) including the entire workflow from library preparation [83].
- Data Analysis and LOD Calculation:
- For each known variant or strain, calculate the mean observed allele frequency and the % relative standard deviation (%RSD) from the technical replicates.
- Plot the %RSD values against their corresponding mean observed allele frequencies.
- To smooth data variability and identify the overall trend, calculate a moving average of the %RSD values (e.g., using 3, 5, or 7 adjacent data points) [83].
- Define the LOD based on a precision threshold. A common approach is to define LOD as the allele frequency at which the %RSD is 30%, indicating a just-acceptable level of precision where the signal is 3.3 times greater than its own standard deviation [83].
Illustrative Data: A study using whole-exome sequencing estimated an LOD for allele frequency between 5% and 10% with a sequencing data size of 15 Gbp or more, while targeted NGS panels with error-correction have demonstrated sensitivities of 0.25% for single-nucleotide variants and even 0.1% for specific fusion genes [83] [84] [85].
Experimental Quantification of Reproducibility
Reproducibility, or precision, ensures that results are reliable and repeatable, which is critical for multi-laboratory studies and longitudinal projects.
Detailed Protocol for Reproducibility Assessment:
- Experimental Design:
- Intra-laboratory Precision: Use the same biological sample, reagent lots, and operator to prepare multiple technical replicate libraries sequenced on the same run (within-run) and across different runs (between-run).
- Inter-laboratory Precision: Distribute identical aliquots of the same sample to different laboratories for independent processing and sequencing [86].
- Data Analysis:
- For a set of target alleles or transcripts, calculate the variant allele fraction (VAF) or normalized count for each replicate.
- Assess concordance by calculating the percentage agreement between results from different replicates or laboratories [88].
- For quantitative data, perform a correlation analysis (e.g., Pearson's correlation coefficient, R²) between the VAFs or counts observed in different replicate sets [88].
- Monitor key NGS run metrics (e.g., on-target percentage, mean depth, duplicate rate) across all replicates to ensure consistent technical performance [87].
Illustrative Data: A study on targeted NGS for GMO detection found that different laboratories delivered "highly reproducible high-quality targeted NGS data with little variation," demonstrating the robustness of a well-standardized targeted approach [86]. Another multi-institutional study on NSCLC testing showed 100% sequencing success and a 95.2% inter-laboratory concordance [88].
Experimental Quantification of Linearity
Linearity defines the quantitative dynamic range of an assay, confirming that measurements accurately reflect true changes in analyte abundance.
Detailed Protocol for Linearity Validation:
- Dilution Series Creation: Prepare a linear dilution series of the analyte of interest. A common approach is to serially dilute a positive sample (e.g., a specific mutant strain or a transcribed sequence) into a wild-type background at known ratios (e.g., 50%, 10%, 1%, 0.1%, 0.01%) [84].
- Sequencing and Measurement: Sequence each dilution point in the series.
- Data Analysis:
- For each dilution point, plot the expected allele frequency or relative abundance against the mean observed frequency obtained from sequencing.
- Use statistical methods like Passing-Bablok regression or simple linear regression to evaluate the relationship [84].
- The assay is considered linear if the correlation coefficient (R) is >0.99 and the regression line shows a slope close to 1 and an intercept close to 0 [84].
Illustrative Data: In the validation of an NGS-based minimal residual disease (MRD) panel, dilution tests for multiple mutations "showed excellent linearity and a strong correlation between expected and observed clonal frequencies (R>0.99)" across a range of dilutions [84].
The Scientist's Toolkit: Essential Reagents and Materials
The reliability of the metrics above is contingent on using high-quality, well-characterized materials. The following table outlines essential research reagents for these validation experiments.
Table 2: Research Reagent Solutions for NGS Assay Validation
| Reagent/Material | Function in Validation | Specific Examples / Notes |
|---|---|---|
| Reference Standard with Known AF | Serves as a ground truth for LOD, linearity, and reproducibility studies [83] [84]. | Commercially available cell lines (e.g., Horizon Discovery Tru-Q), or in-house standards pre-validated by ddPCR [83] [84]. |
| Digital Droplet PCR (ddPCR) | An orthogonal method for absolute quantification to validate the accuracy of NGS-derived allele frequencies [83] [84]. | Used to pre-validate the allele frequencies in a reference material before NGS-based LOD estimation [83]. |
| Targeted NGS Panels (Hybrid Capture or Amplicon) | Enables high-depth sequencing of specific regions of interest, which is crucial for achieving a low LOD [86] [84] [56]. | Can be designed to target specific genes, as in a 24-gene MRD panel [84] or custom panels for specific organisms [4]. |
| UDG Enzyme | Reduces false-positive variants caused by cytosine deamination, a common issue in formalin-fixed paraffin-embedded (FFPE) and ancient samples, thus improving specificity and LOD [84]. | Treatment of genomic DNA with uracil-DNA-glycosylase (UDG) before library preparation [84]. |
| Validated Bioinformatics Pipelines | Critical for reproducible data processing, variant calling, and generating accurate CGI profiles. Tools must be selected and benchmarked for consistency [4] [87]. | Pipelines must account for and minimize technical variation. Consistency should be checked even with shuffled read inputs [87]. |
Integrated Workflow for Assay Validation
The following diagram illustrates the logical progression and key decision points in a comprehensive NGS assay validation workflow, integrating the metrics and methods described above.
Workflow for Determining the Limit of Detection
The process of determining the LOD is a detailed, iterative experimental procedure. The workflow below outlines the key steps from initial preparation to final calculation.
The rigorous application of the metrics and methodologies outlined in this guide—LOD, Reproducibility, and Linearity—is fundamental to generating trustworthy data from NGS-based chemical-genetic interaction profiling. By establishing a known sensitivity threshold, ensuring consistent results across replicates and laboratories, and confirming the quantitative accuracy across a dynamic range, researchers can confidently use platforms like PROSPECT for critical decision-making in drug discovery and development, such as MOA prediction and hit prioritization [4]. This analytical rigor transforms high-throughput NGS data from mere observations into reliable, actionable scientific insights.
Next-generation sequencing (NGS) has revolutionized chemical-genetic interaction profiling, enabling comprehensive mapping of how genetic perturbations influence susceptibility to chemical compounds, including antimicrobial peptides and small molecule therapeutics [60] [66]. As this field advances, researchers increasingly leverage both short-read and long-read sequencing technologies to uncover complex biological relationships. Short-read platforms, exemplified by Illumina's sequencing-by-synthesis technology, provide high base-level accuracy (exceeding 99.99%) and are well-established for variant calling and quantitative profiling [75] [90]. Conversely, long-read technologies from Pacific Biosciences (PacBio) and Oxford Nanopore Technologies (ONT) generate reads spanning thousands to tens of thousands of bases, resolving structural variants, repetitive regions, and complex genomic architectures that often confound short-read approaches [91] [90].
The integration of these complementary technologies creates a critical need for rigorous cross-platform validation protocols. Chemical-genetic interaction studies, such as the PROSPECT platform for antitubercular compound screening, rely on sensitive detection of genetic perturbations and their phenotypic consequences through barcode sequencing [66]. Discrepancies between platforms can lead to conflicting interpretations of mechanism of action (MOA), potentially misdirecting drug development efforts. This technical guide provides a structured framework for correlating data from short-read and long-read technologies, ensuring robust and reproducible results for researchers and drug development professionals engaged in chemical-genetic interaction research.
Technological Foundations: Platform Comparisons and Performance Characteristics
Understanding the fundamental technical differences between sequencing platforms is prerequisite to designing effective validation strategies. Each technology exhibits distinct strengths and limitations that systematically influence data interpretation in chemical-genetic profiling applications.
Short-read technologies (e.g., Illumina) utilize sequencing-by-synthesis chemistry with reversible dye-terminators, enabling massively parallel sequencing of DNA fragments typically ranging from 50-300 base pairs [75] [50]. This approach achieves exceptional base-level accuracy (>99.99%) through high coverage depth, making it ideal for detecting single nucleotide variants (SNVs) and small insertions/deletions (indels) in chemical-genetic screens [90]. However, their limited read length struggles to resolve complex genomic regions, including repetitive sequences, structural variants, and gene families with high homology – precisely the regions often implicated in antibiotic resistance and compensatory mutations [90].
Long-read technologies address these limitations through fundamentally different approaches. PacBio's Single Molecule Real-Time (SMRT) sequencing employs zero-mode waveguides to monitor DNA polymerase activity in real-time, generating HiFi reads of 10-25 kilobases with >99.9% accuracy through circular consensus sequencing [91]. Oxford Nanopore technologies measure changes in electrical current as DNA strands pass through protein nanopores, enabling read lengths that can exceed 100 kilobases, though with slightly lower raw accuracy (approximately Q20-Q30 with latest chemistries) [91] [90]. Both platforms excel at detecting structural variations, resolving complex haplotypes, and characterizing repetitive elements without PCR amplification biases [90].
Table 1: Performance Characteristics of Major Sequencing Platforms
| Platform | Technology | Read Length | Accuracy | Strengths | Common Applications in Chemical-Genetics |
|---|---|---|---|---|---|
| Illumina | Sequencing-by-Synthesis | 50-300 bp | >99.99% (Q30+) | High throughput, low cost per base, excellent for SNV detection | Chemical-genetic interaction profiling, variant calling, hypersensitive strain identification [75] [90] |
| PacBio HiFi | Single Molecule Real-Time (SMRT) | 10-25 kb | >99.9% (Q30) | Long reads with high accuracy, minimal bias | Structural variant detection in resistant strains, haplotype phasing, resolving complex genomic regions [91] |
| Oxford Nanopore | Nanopore sensing | 1 kb - 100+ kb | ~99% (Q20) with latest chemistry | Ultra-long reads, real-time analysis, direct RNA/epigenetic detection | Real-time resistance monitoring, mobile genetic element tracking, metagenomic profiling [91] [90] |
Table 2: Error Profiles and Systematic Biases Across Platforms
| Platform | Primary Error Type | Coverage Uniformity | GC Bias | Recommended Applications in Validation |
|---|---|---|---|---|
| Illumina | Substitution errors | High uniformity across targets | Moderate GC bias | Ground truth for SNVs, quantitative abundance measurements (e.g., barcode counting) [90] |
| PacBio HiFi | Random errors (corrected via CCS) | Even genome coverage | Minimal GC bias | Validation of structural variants, complex indel regions, assembly gaps [91] |
| Oxford Nanopore | Insertion-deletion errors | Slightly variable coverage | Minimal GC bias | Resolving repetitive regions, large structural variations, epigenetic modifications [90] |
Methodological Framework for Cross-Platform Validation
Experimental Design Considerations
Effective cross-platform validation requires strategic experimental design to maximize complementary data while controlling for technical variability. For chemical-genetic interaction studies, where detecting subtle growth differences in mutant libraries is essential, the following design principles apply:
Sample Preparation Protocols: Utilize common starting material for all sequencing platforms to eliminate biological variability. For pooled mutant screens (e.g., PROSPECT platform), extract high-molecular-weight DNA as a single batch, then aliquot for library preparation specific to each platform [66]. Ensure DNA quality metrics are consistent across aliquots (A260/280 ≈ 1.8-2.0, A260/230 > 2.0, minimal fragmentation for long-read libraries).
Coverage Requirements: Establish platform-specific sequencing depths based on application needs. For variant detection in mutant pools, short-read platforms typically require 100-500x coverage per sample, while long-read platforms may achieve comparable sensitivity with 20-30x coverage due to longer contiguous reads [90]. In a recent colorectal cancer study comparing Illumina and Nanopore, mean coverage depths of 105.88X and 21.20X respectively successfully identified clinically relevant mutations in key genes like KRAS, BRAF, and TP53 [90].
Control Implementation: Incorporate reference standards with known variants at predetermined allele frequencies. Commercially available cell lines or synthetic DNA controls with characterized mutations enable quantification of platform-specific sensitivity and specificity [92]. For chemical-genetic interaction profiling, include control compounds with established mechanisms of action (e.g., antimicrobial peptides with known membrane vs. intracellular targeting) to benchmark platform performance [60].
Wet-Lab Protocols for Parallel Library Preparation
Simultaneous Library Preparation from Common DNA Source:
- DNA Extraction: Isolate high-molecular-weight genomic DNA using magnetic bead-based purification (e.g., AMPure XP beads) to maintain fragment integrity. Assess quality via fluorometry and pulsed-field gel electrophoresis.
- Short-Red Library Preparation (Illumina-compatible):
- Fragment DNA to target size of 350-550 bp using acoustic shearing (Covaris)
- Perform end-repair, A-tailing, and adapter ligation using commercial kits (Illumina DNA Prep)
- PCR-amplify with index primers (8 cycles) for multiplexing
- Validate library quality via Bioanalyzer/TapeStation (peak: 400-600 bp)
- Long-Red Library Preparation (PacBio HiFi compatible):
- Size-select DNA fragments >10 kb using BluePippin or SageELF systems
- Repair DNA damage and ligate SMRTbell adapters without fragmentation
- Remove failed ligation products with exonuclease treatment
- Quantity library using Qubit fluorometer and qualify with FemtoPulse
- Long-Red Library Preparation (Nanopore compatible):
- Repair DNA damage using NEBNext FFPE DNA Repair mix
- Ligate native barcode adapters using Ligation Sequencing Kit
- Purify with Solid Phase Reversible Immobilization (SPRI) beads
- Load library onto appropriate flow cell (Flongle, MinION, or PromethION)
Bioinformatic Processing and Correlation Analysis
Platform-Specific Data Processing:
- Short-Read Processing Pipeline:
- Demultiplex with bcl2fastq (Illumina) or vendor-specific tools
- Quality control with FastQC/MultiQC
- Adapter trimming with Trimmomatic or Cutadapt
- Alignment to reference genome using BWA-MEM or Bowtie2
- Variant calling with GATK or specialized chemical-genetic tools
- Barcode counting for pooled screens [66]
- Long-Read Processing Pipeline:
- Basecalling with Dorado (Nanopore) or SMRT Link (PacBio)
- Quality assessment with NanoPlot (Nanopore) or SMRT Link Quality Assessment
- Adapter trimming with Porechop (Nanopore) or SMRT Link Adapter Trimming
- Alignment with minimap2 (both platforms) or NGMLR
- Variant calling with Clair3 (Nanopore) or DeepVariant (PacBio)
- Structural variant detection with Sniffles or PBSV
Cross-Platform Correlation Methodology:
- Variant-Level Concordance: Identify overlapping variant calls between platforms, calculating sensitivity, specificity, and precision metrics. For chemical-genetic applications, focus on variants in essential genes and pathways relevant to compound mechanism of action [60].
- Coverage Normalization: Account for coverage differences using downsampling approaches or statistical normalization. Compare coverage in exonic regions and chemical-genetic target regions using BEDTools coverage [90].
- Allele Frequency Correlation: Calculate Pearson correlation coefficients for variant allele frequencies (VAFs) across platforms, particularly for variants identified in chemical-genetic screens where VAF changes indicate selection [66].
- Functional Concordance Assessment: Determine whether platform-specific variants affect similar biological pathways using enrichment tools (GO, KEGG), especially pathways implicated in compound resistance or sensitivity [60].
Application to Chemical-Genetic Interaction Profiling
Cross-platform validation provides particular value in chemical-genetic interaction studies, where accurate detection of genetic determinants of compound sensitivity is essential for understanding mechanism of action and resistance pathways.
In antimicrobial peptide research, chemical-genetic profiling has revealed that cross-resistance occurs primarily between AMPs with similar modes of action rather than all AMPs broadly [60]. This finding emerged from systematic overexpression of ~4,400 E. coli genes and assessing susceptibility to 15 different AMPs – an approach requiring highly accurate variant detection and quantification [60]. Similarly, the PROSPECT platform for antitubercular discovery screens compounds against a pool of Mycobacterium tuberculosis hypomorphs (strains with depleted essential proteins), quantifying strain sensitivity through DNA barcode sequencing [66]. In both cases, cross-platform validation ensures that identified chemical-genetic interactions reflect true biology rather than technical artifacts.
Table 3: Validation Metrics from Comparative Sequencing Studies
| Study Focus | Platforms Compared | Key Concordance Metrics | Implications for Chemical-Genetics |
|---|---|---|---|
| Colorectal Cancer Genomics [90] | Illumina vs. Nanopore | SNV concordance: 94.6% in coding regions | High confidence in detecting resistance mutations in targeted genes |
| Indel concordance: 88.3% in coding regions | Moderate confidence for frameshift mutations affecting gene function | ||
| Structural variants: Nanopore detected 2.3x more SVs | Long-reads essential for complex resistance mechanisms | ||
| Liquid Biopsy Validation [92] | Orthogonal methods for NGS validation | SNV/Indel sensitivity: 96.92% at 0.5% AF | Reliable detection of low-frequency resistance variants in heterogeneous samples |
| Specificity: 99.67% | Minimal false positives in candidate gene identification | ||
| Chemical-Genetic Interaction Profiling [60] | Overexpression library screening | ~63% overlap in sensitivity-enhancing genes | Substantial platform-specific effects requiring validation |
For chemical-genetic interaction studies, implement the following validation framework:
Essential Gene Detection Concordance: Compare identification of essential genes across platforms, as these often show heightened chemical sensitivity. In PROSPECT screening, hypomorphs of essential genes provide sensitive detection of compounds targeting corresponding pathways [66].
Pathway-Level Enrichment Consistency: Assess whether chemical-genetic hits from different platforms implicate the same biological pathways. Studies of antimicrobial peptide resistance revealed that membrane-targeting versus intracellular-targeting AMPs clustered separately based on their chemical-genetic profiles [60].
Resistance Mechanism Resolution: Utilize long-read data to resolve complex resistance mechanisms (gene amplifications, chromosomal rearrangements) that may be missed by short-read approaches alone, then validate findings with orthogonal methods.
Essential Research Reagents and Computational Tools
Successful cross-platform validation requires carefully selected reagents and computational resources. The following toolkit represents essential components for implementing the described validation framework.
Table 4: Research Reagent Solutions for Cross-Platform Validation
| Category | Specific Product/Resource | Application in Validation | Technical Notes |
|---|---|---|---|
| Reference Standards | Genome in a Bottle (GIAB) reference materials | Benchmarking variant calling accuracy | Use well-characterized cell lines (NA12878, NA24385) for platform comparison |
| Seraseq ctDNA Mutation Mix | Liquid biopsy validation | Contains predefined mutations at specific allele frequencies for sensitivity assessment [92] | |
| Library Prep Kits | Illumina DNA Prep | Short-read library preparation | Optimized for 100-1000 bp insert sizes; compatible with multiplexing |
| PacBio SMRTbell Prep Kit 3.0 | HiFi long-read library preparation | Designed for >10 kb inserts; requires high molecular weight DNA | |
| Oxford Nanopore Ligation Sequencing Kit | Nanopore long-read library preparation | Supports native barcoding for multiplexing; compatible with various DNA input amounts | |
| Quality Control Tools | Agilent Bioanalyzer/TapeStation | Library fragment size distribution | Essential for quantifying library size and detecting adapter dimers |
| Qubit Fluorometer | Accurate DNA quantification | More accurate than spectrophotometry for library quantification | |
| Nanodrop/Thermo Scientific | Nucleic acid purity assessment | Rapid assessment of protein/salt contamination (A260/280, A260/230) | |
| Computational Tools | FastQC/MultiQC | Quality control visualization | Identifies sequencing quality issues across platforms |
| BWA-MEM/minimap2 | Sequence alignment | Platform-specific optimal aligners for short and long reads | |
| GATK/DeepVariant | Variant calling | High-accuracy variant detection optimized for respective technologies | |
| Sniffles/PBSV | Structural variant calling | Specialized tools for detecting large variants from long-read data | |
| BEDTools | Coverage analysis | Critical for comparing coverage across target regions [90] |
Cross-platform validation represents an essential methodology in chemical-genetic interaction research, where accurate genetic profiling directly impacts understanding of compound mechanism of action and resistance development. The structured approach outlined here – incorporating coordinated experimental design, platform-specific optimization, and rigorous bioinformatic correlation – enables researchers to leverage the complementary strengths of short-read and long-read technologies.
As sequencing technologies continue evolving, several trends will further enhance cross-platform validation. The convergence of short-read and long-read approaches through technologies like PacBio's Onso system (which applies sequencing-by-binding chemistry for short reads) and Illumina's emerging long-read capabilities promises to blur traditional platform boundaries [91]. Simultaneously, algorithmic improvements in variant calling, particularly through deep learning approaches like Google's DeepVariant, are increasing base-level accuracy across all platforms [54]. For chemical-genetic interaction profiling specifically, these advances will enable more comprehensive mapping of resistance pathways and compound mechanisms, accelerating therapeutic discovery while mitigating resistance development.
The integration of multi-omics data streams – including direct epigenetic detection via Nanopore and protein-binding information through PacBio's SPRQ chemistry – will further enrich chemical-genetic datasets, providing unprecedented resolution of compound effects on cellular systems [91]. By implementing robust cross-validation frameworks today, researchers establish foundations to capitalize on these emerging technologies, ensuring that future chemical-genetic insights rest on data of the highest possible reliability and reproducibility.
The field of chemical-genomics is undergoing a transformative revolution through the integration of Next-Generation Sequencing (NGS) and Artificial Intelligence (AI). This powerful synergy is creating unprecedented capabilities for predictive modeling of chemical-genetic interactions, fundamentally accelerating drug discovery and functional genomics. Chemical-genetic interaction profiling enables researchers to systematically identify mechanisms of action (MOA) for small molecules by observing how genetic perturbations alter compound sensitivity [4]. The massive, complex datasets generated by NGS platforms provide the foundational data layer, while AI algorithms offer the computational framework to detect subtle, multivariate patterns within these datasets that elude conventional statistical methods [93] [55].
This integration represents a paradigm shift from traditional, hypothesis-driven research to a data-driven discovery model. The ability to conduct large-scale chemical-genetic screens, such as the PRimary screening Of Strains to Prioritize Expanded Chemistry and Targets (PROSPECT) platform, generates rich chemical-genetic interaction (CGI) profiles [4]. These profiles serve as high-dimensional fingerprints for small molecules, enabling reference-based MOA prediction through computational methods like Perturbagen CLass (PCL) analysis [4]. The resulting AI-powered predictive models are streamlining antimicrobial discovery, de-risking drug development pipelines, and illuminating novel biological pathways for therapeutic intervention.
The Technological Synergy: How NGS and AI Interact
Foundational NGS Technologies in Chemical-Genomics
The application of NGS in chemical-genomics relies on several key sequencing technologies, each selected based on the specific requirements of the experimental design.
Table 1: Key NGS Technologies for Chemical-Genomic Applications
| Technology | Primary Use Case in Chemical-Genomics | Key Advantage |
|---|---|---|
| Whole Genome Sequencing (WGS) | Discovery of novel resistance mutations and off-target effects [94]. | Provides an unbiased view of the entire genome [54]. |
| Targeted Sequencing | Focused analysis of specific gene panels or pathways [94]. | Cost-effective, high-depth coverage for specific genomic regions [94]. |
| Whole Exome Sequencing (WES) | Identifying coding variants that influence drug response [94]. | Balances comprehensive coverage of coding regions with cost efficiency. |
| Chip-Sequencing (ChIP-Seq) | Mapping protein-DNA interactions altered by compound treatment [94]. | Reveals epigenetic mechanisms and transcription factor binding. |
| RNA Sequencing | Profiling transcriptomic responses to chemical perturbations [14]. | Captures genome-wide expression changes and splicing alterations. |
AI and Machine Learning Architectures
AI, particularly machine learning (ML) and deep learning (DL), provides the analytical engine to interpret NGS-derived chemical-genomic data. Different AI architectures are suited to specific data types and biological questions [93] [55].
- Convolutional Neural Networks (CNNs): Excel at identifying spatial and motif-based patterns in genomic sequences. They are used for tasks such as predicting transcription factor binding sites and identifying sequence motifs enriched in sensitive strains [93] [55].
- Recurrent Neural Networks (RNNs) and Transformers: These models are designed for sequential data, making them ideal for analyzing genomic sequences (A, T, C, G) and temporal gene expression patterns. Transformer models, with their "attention" mechanisms, are particularly powerful for understanding long-range dependencies in the data [55].
- Supervised Learning Models: Used for classification and regression tasks, such as predicting a compound's MOA based on its CGI profile or forecasting drug resistance [4] [55].
- Unsupervised Learning Models: Applied for exploratory data analysis, including clustering compounds with similar CGI profiles to identify novel MOA classes or stratifying patient populations based on molecular signatures [55].
Figure 1: AI Modeling Workflow for NGS Data. This diagram illustrates how raw NGS data, such as Chemical-Genetic Interaction (CGI) profiles, are processed by different deep learning architectures to generate predictive models.
Quantitative Data and Market Analysis
The integration of NGS and AI is not only a scientific advancement but also a rapidly growing sector with significant economic and operational impacts.
Table 2: NGS in Drug Discovery Market Analysis and Performance Metrics (2024-2034)
| Category | Specific Data / Metric | Value / Trend |
|---|---|---|
| Market Size & Growth | Global Market Size (2024) | USD 1.45 Billion [94] |
| Projected Market Size (2034) | USD 4.27 Billion [94] | |
| Compound Annual Growth Rate (CAGR) | 18.3% [94] | |
| Technology Adoption | Leading Product Type (2024) | Consumables (48.5% revenue share) [94] |
| Leading Sequencing Technology | Targeted Sequencing (39.6% revenue share) [94] | |
| Primary Application | Drug Target Identification (37.2% revenue share) [94] | |
| AI Performance Gains | Variant Calling Acceleration (GPU vs. CPU) | Up to 80x faster analysis [55] |
| MOA Prediction Performance (PCL Analysis) | 69-70% Sensitivity, 75-87% Precision [4] |
Experimental Protocols for AI-Driven Chemical-Genomic Profiling
Implementing a robust pipeline for predictive modeling requires a meticulous, multi-stage experimental and computational protocol. The following methodology is adapted from state-of-the-art platforms like PROSPECT [4].
Stage 1: Library Preparation and NGS Sequencing
Objective: To generate high-quality, barcoded sequencing libraries from a pooled mutant screen treated with chemical perturbagens.
- Strain Pool Construction: A pooled library of hypomorphic Mycobacterium tuberculosis mutants is cultivated, with each strain possessing a unique DNA barcode for identification [4].
- Chemical Treatment: The pooled library is exposed to the compound of interest across a range of concentrations, alongside a DMSO control. This is performed in biological replicates to ensure statistical power.
- Genomic DNA Extraction and Shearing: After a defined incubation period, genomic DNA is extracted from all conditions. The DNA is mechanically or enzymatically sheared to an appropriate size for sequencing (e.g., 300-500 bp).
- Library Preparation for NGS: Sheared DNA is used to construct sequencing libraries. This process involves:
- End-Repair and A-Tailing: Creates blunt-ended, 5'-phosphorylated fragments with a single 3'A-overhang.
- Adapter Ligation: Ligation of platform-specific adapters containing sequencing primer binding sites.
- PCR Amplification: Limited-cycle PCR to enrich for adapter-ligated fragments and incorporate unique dual indices (UDIs) to multiplex samples.
- Sequencing: Libraries are quantified, normalized, pooled, and sequenced on a high-throughput platform (e.g., Illumina NovaSeq) to achieve sufficient depth for barcode quantification.
Stage 2: Bioinformatic Processing of Raw NGS Data
Objective: To convert raw sequencing reads into a normalized matrix of chemical-genetic interaction profiles.
- Demultiplexing: Raw base call (BCL) files are demultiplexed based on their unique indices, generating FASTQ files for each sample.
- Quality Control (QC): FASTQ files are processed with tools like FastQC to assess read quality, adapter contamination, and overall sequencing performance.
- Barcode Alignment and Quantification: A custom alignment pipeline is used to map reads to a reference file of known barcode sequences. The output is a count table detailing the abundance of each mutant barcode in every sample (treated and control).
- Fitness Score Calculation: The relative fitness of each hypomorph under treatment is calculated by comparing its abundance in the treated sample to the control, often normalized to pre-treatment abundances. This generates a single fitness score for each mutant-compound combination.
Stage 3: AI-Based Predictive Modeling with PCL Analysis
Objective: To infer the Mechanism of Action (MOA) of a test compound by comparing its CGI profile to a curated reference database.
- Reference Set Curation: A database of CGI profiles for compounds with known, annotated MOAs is established. This reference set must be diverse and high-quality [4].
- Profile Comparison and Similarity Scoring: The CGI profile of the unknown test compound is compared against every profile in the reference set using a similarity metric (e.g., Pearson correlation, cosine similarity).
- MOA Inference and Prediction: The test compound is assigned the MOA of the reference compound(s) with the most similar CGI profile. Statistical confidence is assessed through methods like leave-one-out cross-validation, which has demonstrated high sensitivity and precision in real-world applications [4].
Figure 2: End-to-End Workflow for AI-Driven MOA Prediction. This diagram outlines the complete experimental and computational pipeline, from the initial pooled library to the final MOA prediction.
The Scientist's Toolkit: Essential Research Reagents and Materials
Successful execution of integrated NGS and AI projects requires a suite of specialized reagents, platforms, and computational tools.
Table 3: Essential Research Reagents and Platforms for NGS-AI Chemical-Genomics
| Category | Item / Solution | Function / Application |
|---|---|---|
| Wet-Lab Reagents | Hypomorphic Mutant Library | Essential for generating chemical-genetic interactions; each mutant is depleted of a specific essential gene [4]. |
| NGS Library Prep Kit | Facilitates the conversion of genomic DNA into sequencer-compatible libraries (e.g., Illumina Nextera XT). | |
| Unique Dual Index (UDI) Adapters | Enables multiplexing of hundreds of samples in a single sequencing run while minimizing index hopping. | |
| Sequencing & Automation | High-Throughput Sequencer | Platforms like Illumina NovaSeq X provide the scale and throughput required for large-scale screens [54]. |
| Liquid Handling Robot | Automates repetitive pipetting steps in library preparation, enhancing reproducibility and throughput (e.g., Tecan Fluent, Opentrons OT-2) [93] [95]. | |
| Computational Tools | AI/ML Frameworks | Software libraries like TensorFlow and PyTorch are used to build and train custom deep learning models for profile analysis [96]. |
| Cloud Computing Platform | Scalable infrastructure (e.g., AWS, Google Cloud) for storing and processing terabytes of NGS data [54] [94]. | |
| Bioinformatics Tools | Specialized software for variant calling (DeepVariant) [93] [54] [55] and sequence alignment (BWA-MEM) [55]. | |
| Reference Databases | Curated MOA Reference Set | A collection of CGI profiles from compounds with validated mechanisms of action, crucial for PCL analysis [4]. |
| Genomic Databases | Public resources (e.g., TCGA, gnomAD) provide context for interpreting identified genetic variants [96]. |
Conclusion
Next-generation sequencing has firmly established itself as the cornerstone of modern chemical-genetic interaction profiling, transforming a traditionally low-throughput process into a dynamic, data-rich discovery engine. By mastering the foundational principles, implementing robust methodological workflows, proactively navigating data analysis challenges, and rigorously validating findings, researchers can fully harness NGS to deconvolve complex mechanisms of drug action and toxicity. The future points toward the deeper integration of long-read and ultra-rapid technologies like SBX, the application of AI to extract deeper insights from multi-omic datasets, and the continued translation of these powerful profiles into clinically actionable therapeutic strategies, ultimately paving the way for a new era of precision medicine.
References
- 1. Using BEAN-counter to quantify genetic from multiplexed... interactions [https://pmc.ncbi.nlm.nih.gov/articles/PMC6818255/]
- 2. Next-Generation Sequencing Technology: Current Trends ... [https://pmc.ncbi.nlm.nih.gov/articles/PMC10376292/]
- 3. Sanger Sequencing: Introduction, Principle, and Protocol [https://www.cd-genomics.com/blog/sanger-sequencing-introduction-principle-and-protocol/]
- 4. Reference-based chemical-genetic interaction profiling to ... [https://www.nature.com/articles/s41467-025-64662-x]
- 5. The Best of NGS: Instrument Companies to Watch in 2025 [https://www.genengnews.com/topics/omics/the-best-of-ngs-instrument-companies-to-watch-in-2025/]
- 6. Inventing SBX, a DNA sequencing breakthrough [https://www.roche.com/stories/sbx-next-generation-sequencing-technology]
- 7. Roche unveils a new class of next-generation sequencing with its novel sequencing by expansion technology [https://www.roche.com/media/releases/med-cor-2025-02-20]
- 8. Sanger sequencing: Principles, process and applications [https://www.abcam.com/en-us/knowledge-center/dna-and-rna/sanger-sequencing]
- 9. Will Roche's new SBX technology revolutionise sequencing? [https://www.ddw-online.com/will-roches-new-sbx-technology-revolutionise-sequencing-33747-202502/]
- 10. Chemical Genetic Interaction Profiling Reveals ... [https://pmc.ncbi.nlm.nih.gov/articles/PMC5700314/]
- 11. Deep learning-driven prediction of drug mechanism of action ... [https://jcheminf.biomedcentral.com/articles/10.1186/s13321-022-00596-6]
- 12. Next-Generation Sequencing (NGS) | Explore the technology [https://www.illumina.com/science/technology/next-generation-sequencing.html]
- 13. NGS vs Sanger Sequencing [https://www.illumina.com/science/technology/next-generation-sequencing/beginners/advantages/ngs-vs-sanger.html]
- 14. 2025 Trends: NGS [https://www.genengnews.com/topics/genome-editing/2025-trends-ngs/]
- 15. Assessing the Cost-Effectiveness of Next-Generation ... [https://www.sciencedirect.com/science/article/pii/S109830152402357X]
- 16. Next-Generation Sequencing (NGS) in Drug Discovery & ... [https://www.corning.com/worldwide/en/products/life-sciences/resources/stories/the-cutting-edge/integrating-next-generation-sequencing-into-drug-discovery.html]
- 17. Antimicrobial Resistance | Detection with NGS [https://www.illumina.com/areas-of-interest/microbiology/public-health-surveillance/antimicrobial-resistance-detection.html]
- 18. Next-generation sequencing identifies potential ... [https://pmc.ncbi.nlm.nih.gov/articles/PMC12427459/]
- 19. An NGS Workflow Blueprint for DNA Sequencing Data and Its ... [https://pmc.ncbi.nlm.nih.gov/articles/PMC4827795/]
- 20. Color Balance in Illumina Sequencing: Why It Still Matters [https://www.revvity.com/blog/color-balance-illumina-sequencing-why-it-still-matters]
- 21. NGS for Drug Development [https://www.illumina.com/areas-of-interest/genomics-in-drug-development/ngs-for-drug-development.html]
- 22. Panels, WES, or WGS: Which is Best for Rare Disease ... [https://3billion.io/blog/which-is-the-best-ngs-approach-for-rare-disease-diagnosis-panels-wes-or-wgs]
- 23. WGS vs. WES vs. Targeted Sequencing Panels [https://www.cd-genomics.com/resource-wgs-vs-wes-vs-targeted-panels.html]
- 24. WGS vs WES: Which Genetic Sequencing Method is Right ... [https://www.novogene.com/us-en/resources/blog/wgs-vs-wes-which-genetic-sequencing-method-is-right-for-you/]
- 25. WES vs WGS vs Custom Panels [https://sequencing.roche.com/us/en/article-listing/wes-wgs-custom.html]
- 26. The application of next-generation sequencing ... [https://www.sciencedirect.com/science/article/abs/pii/S1359644611000948]
- 27. Applications of NGS in Drug Research [https://www.psomagen.com/blog/next-generation-sequencing-revolutionizes-drug-discovery-and-development]
- 28. The Use of Next-Generation Sequencing in Drug ... [https://www.ddw-online.com/the-use-of-next-generation-sequencing-in-drug-development-1506-201712/]
- 29. Next-Generation Sequencing Illumina Workflow–4 Key Steps [https://www.thermofisher.com/us/en/home/life-science/cloning/cloning-learning-center/invitrogen-school-of-molecular-biology/next-generation-sequencing/illumina-workflow.html]
- 30. Next Generation Sequence Testing: Essential 2025 Guide [https://lifebit.ai/blog/next-generation-sequence-testing/]
- 31. Quantitative and multiplexed chemical-genetic ... [https://pmc.ncbi.nlm.nih.gov/articles/PMC7661543/]
- 32. DNA Sequencing: How to Choose the Right Technology [https://frontlinegenomics.com/dna-sequencing-how-to-choose-the-right-technology/]
- 33. Comparative evaluation of sequencing platforms [https://pmc.ncbi.nlm.nih.gov/articles/PMC12365774/]
- 34. Sequencing by expansion (SBX) technology [https://sequencing.roche.com/us/en/article-listing/sequencing-platform-technologies.html]
- 35. Roche announces new collaboration with ... [https://broadclinicallabs.org/roche-announces-new-collaboration-with-broad-clinical-labs-to-accelerate-adoption-of-cutting-edge-sbx-sequencing-technology/]
- 36. Cost-effectiveness of Targeted Next Generation ... [https://pubmed.ncbi.nlm.nih.gov/40920587/]
- 37. Comparative analysis of Illumina, PacBio, and nanopore ... [https://www.frontiersin.org/journals/microbiomes/articles/10.3389/frmbi.2025.1587712/full]
- 38. Pricing - Center for Genetic Medicine [https://www.cgm.northwestern.edu/cores/nuseq/pricing.html]
- 39. Next-Generation Sequencing of Plasmid DNA for Stable ... [https://www.bioprocessintl.com/cell-line-development/a-strategy-for-sequence-variant-control-leveraging-next-generation-sequencing-of-plasmid-dna-used-for-stable-cell-line-transfection]
- 40. Case Study: Ensuring Plasmid Sequence Fidelity and ... [https://www.avancebio.com/ensuring-plasmid-sequence-fidelity-and-purity-by-ngs-for-ind-enabling-drug-substance-release/]
- 41. Methods to improve the accuracy of next-generation sequencing [https://pmc.ncbi.nlm.nih.gov/articles/PMC9895957/]
- 42. Sequences and Cell-free DNA Technologies [https://www.aldevron.com/blog/fidelity-cell-free-dna-01]
- 43. NGS-Based Assays in Cell and Gene Therapy [https://www.genedata.com/resources/learn/details/blog/ngs-based-assays-for-cgt-product-development]
- 44. Case Study: Quantifying In Vivo Gene Editing in Preclinical ... [https://www.avancebio.com/case-study-quantifying-in-vivo-gene-editing-in-preclinical-tissues-via-ngs-amplicon-seq-news/]
- 45. Amplicon Sequencing vs. Other NGS Techniques [https://www.paragongenomics.com/amplicon-sequencing-vs-other-ngs-techniques-choosing-the-right-approach-for-your-research/]
- 46. Solution For Targeted Amplicon Sequencing [https://www.paragongenomics.com/targeted-sequencing/amplicon-sequencing/]
- 47. CRISPR off-target detection with NGS | IDT [https://www.idtdna.com/pages/technology/crispr/crispr-genome-editing/crispr-detection/next-generation-sequencing]
- 48. Precise measurement of CRISPR genome editing ... [https://pmc.ncbi.nlm.nih.gov/articles/PMC11987616/]
- 49. Molecular biology in the exabyte era: Taming the data ... [https://www.sciencedirect.com/science/article/abs/pii/S1476927125001951]
- 50. Next-generation sequencing: 2025 Revolution [https://lifebit.ai/blog/next-generation-sequencing/]
- 51. NGS for Beginners | Learn the basics of NGS [https://www.illumina.com/science/technology/next-generation-sequencing/beginners.html]
- 52. Sample Preparation for NGS – A Comprehensive Guide [https://frontlinegenomics.com/sample-preparation-for-ngs-a-comprehensive-guide/]
- 53. Next generation DNA Sequencing data analysis and its ... [https://www.sciencedirect.com/science/article/abs/pii/S034403382500473X]
- 54. 2025 and Beyond: The Future of Genomic Data Analysis ... [https://blog.crownbio.com/2025-and-beyond-the-future-of-genomic-data-analysis-and-innovations-in-genomics-services]
- 55. AI for Genomics: The 2025 Revolution [https://lifebit.ai/blog/ai-for-genomics/]
- 56. Guidelines for Validation of Next-Generation Sequencing– ... [https://pmc.ncbi.nlm.nih.gov/articles/PMC6941185/]
- 57. The Complete Guide to NGS Data Types and Formats [https://ngs101.com/the-complete-guide-to-ngs-data-types-and-formats-from-raw-reads-to-analysis-ready-files/]
- 58. Statistical guidelines for quality control of next-generation ... [https://pmc.ncbi.nlm.nih.gov/articles/PMC8408346/]
- 59. Sequence analysis / Quality Control / Hands-on [https://training.galaxyproject.org/training-material/topics/sequence-analysis/tutorials/quality-control/tutorial.html]
- 60. Chemical-genetic profiling reveals limited cross-resistance ... [https://www.nature.com/articles/s41467-019-13618-z]
- 61. Characterization and mitigation of artifacts derived from NGS ... [https://bmcgenomics.biomedcentral.com/articles/10.1186/s12864-024-10157-w]
- 62. Sequencing-induced artefacts in NGS STR data [https://www.sciencedirect.com/science/article/abs/pii/S1872497324000826]
- 63. Variant calling: Considerations, practices, and developments [https://pmc.ncbi.nlm.nih.gov/articles/PMC9545713/]
- 64. Best practices for variant calling in clinical sequencing [https://genomemedicine.biomedcentral.com/articles/10.1186/s13073-020-00791-w]
- 65. Insights into next generation sequencing guided antibody ... [https://www.nature.com/articles/s41598-023-45538-w]
- 66. Reference-based chemical-genetic interaction profiling to ... [https://pmc.ncbi.nlm.nih.gov/articles/PMC12583738/]
- 67. Functional Annotation of Chemical Libraries across ... [https://pmc.ncbi.nlm.nih.gov/articles/PMC6056180/]
- 68. Standards and Guidelines for Validating Next-Generation ... [https://www.sciencedirect.com/science/article/pii/S1525157817303732]
- 69. Additional NGS Quality Materials [https://www.cdc.gov/lab-quality/php/ngs-quality-initiative/additional-materials.html]
- 70. Next-Generation Sequencing Bioinformatics Pipelines [https://myadlm.org/cln/articles/2020/march/next-generation-sequencing-bioinformatics-pipelines]
- 71. Standardization and quality management in next-generation ... [https://pmc.ncbi.nlm.nih.gov/articles/PMC5025460/]
- 72. A Practical Guide to Clinical Variant Interpretation [https://www.euformatics.com/blog-post/a-practical-guide-to-clinical-variant-interpretation]
- 73. The Next-Generation Sequencing Quality Initiative and ... [https://wwwnc.cdc.gov/eid/article/31/13/24-1175_article]
- 74. Next Generation Sequencing (NGS) Worksheets [https://www.cap.org/member-resources/precision-medicine/next-generation-sequencing-ngs-worksheets]
- 75. Next-Generation Sequencing: A Review of Its Transformative ... [https://pmc.ncbi.nlm.nih.gov/articles/PMC12523276/]
- 76. Validating NGS-Based Assays In-House for Virus Safety ... [https://www.pda.org/pda-letter-portal/home/full-article/validating-ngs-based-assays-in-house-for-virus-safety-assessment]
- 77. Comparison of next-generation sequencing with traditional ... [https://pmc.ncbi.nlm.nih.gov/articles/PMC9794229/]
- 78. Seven-year performance of a clinical metagenomic next- ... [https://www.nature.com/articles/s41591-024-03275-1]
- 79. Comparative and clinical impact of targeted next ... [https://www.frontiersin.org/journals/microbiology/articles/10.3389/fmicb.2025.1590792/full]
- 80. Comparative Diagnostic Accuracy of Metagenomic Next ... [https://www.sciencedirect.com/science/article/pii/S0163445325002610]
- 81. Comparison of targeted next-generation sequencing and ... [https://www.sciencedirect.com/science/article/pii/S0732889324003596]
- 82. Reference-based chemical-genetic interaction profiling to ... [https://pubmed.ncbi.nlm.nih.gov/41184262/?utm_source=FeedFetcher&utm_medium=rss&utm_campaign=None&utm_content=1Pg-IFpMAV26fVAm9s5WInsfg2giwvKMoizEuBGefrIinVuMvY&fc=None&ff=20251104065651&v=2.18.0.post22+67771e2]
- 83. A simple method to estimate the in-house limit of detection ... [https://pmc.ncbi.nlm.nih.gov/articles/PMC7893872/]
- 84. Development of a Next-generation Sequencing-based Gene ... [https://pmc.ncbi.nlm.nih.gov/articles/PMC9989530/]
- 85. Fusion Gene Detection and Quantification by Asymmetric ... [https://www.sciencedirect.com/science/article/pii/S1525157822002185]
- 86. Reproducibility of next-generation-sequencing-based ... [https://pmc.ncbi.nlm.nih.gov/articles/PMC10562171/]
- 87. Genomic reproducibility in the bioinformatics era [https://genomebiology.biomedcentral.com/articles/10.1186/s13059-024-03343-2]
- 88. Impact and Reproducibility of In-House Targeted Next ... [https://www.sciencedirect.com/science/article/pii/S152515782500042X]
- 89. Analytical Validation of a Next-Generation Sequencing ... [https://www.sciencedirect.com/science/article/pii/S152515781730363X]
- 90. Methodological Comparison of Short-Read and Long ... [https://www.mdpi.com/1422-0067/26/18/9254]
- 91. A Primer on NGS Technologies and Their Specs (2025) [https://blog.latch.bio/p/a-primer-on-ngs-technologies-and]
- 92. Analytical Validation of a Pan-Cancer NGS Assay for In- ... [https://www.sciencedirect.com/science/article/pii/S152515782500220X]
- 93. Integrating Artificial Intelligence in Next-Generation Sequencing [https://pmc.ncbi.nlm.nih.gov/articles/PMC12191491/]
- 94. Next-Generation Sequencing in Drug Discovery Market ... [https://www.cervicornconsulting.com/next-generation-sequencing-in-drug-discovery-market]
- 95. Inside ELRIG's Drug Discovery 2025 [https://www.drugtargetreview.com/article/190237/inside-elrigs-drug-discovery-2025/]
- 96. AI in Genomic Data Processing 2025 [https://www.rapidinnovation.io/post/ai-agents-for-genomic-data-processing]