A Beginner's Guide to the NGS Workflow: From Sample to Insight in Chemogenomics
This article provides a comprehensive introduction to Next-Generation Sequencing (NGS) workflows, tailored for researchers and professionals entering the field of chemogenomics and drug development.
A Beginner's Guide to the NGS Workflow: From Sample to Insight in Chemogenomics
Abstract
This article provides a comprehensive introduction to Next-Generation Sequencing (NGS) workflows, tailored for researchers and professionals entering the field of chemogenomics and drug development. It covers the foundational principles of NGS technology, details each critical step in the methodological workflow from nucleic acid extraction to data analysis, and offers practical strategies for troubleshooting and optimization. Furthermore, it addresses the essential practices for analytical validation and compares different NGS approaches, empowering beginners to implement robust, reliable sequencing strategies in their research.
Demystifying NGS: Core Principles for the Chemogenomics Researcher
What is NGS? Understanding Massively Parallel Sequencing
Next-Generation Sequencing (NGS), also known as massively parallel sequencing, is a high-throughput technology that enables the determination of the order of nucleotides in entire genomes or targeted regions of DNA or RNA by sequencing millions to billions of short fragments simultaneously [1] [2]. This represents a fundamental shift from the traditional Sanger sequencing method, which sequences a single DNA fragment at a time. NGS has revolutionized biological sciences, allowing labs to perform a wide variety of applications and study biological systems at an unprecedented level [1].
For researchers in chemogenomics—a field focused on the interaction of chemical compounds with biological systems to accelerate drug discovery—understanding NGS is crucial. It provides the powerful, scalable genomic data needed to elucidate mechanisms of action, identify novel drug targets, and understand cellular responses to chemical libraries.
Core Principle of Massively Parallel Sequencing
The defining feature of NGS is its massively parallel nature. Instead of analyzing a single DNA fragment, NGS platforms miniaturize and parallelize the sequencing process.
- Traditional Sanger Sequencing: This first-generation technology is based on the chain-termination method and uses capillary electrophoresis to separate DNA fragments. It is limited in throughput, expensive for large-scale projects, and was used to complete the Human Genome Project over a decade at a cost of nearly $3 billion [1] [3].
- Massively Parallel NGS: NGS technologies break the genome into millions of small fragments. Each fragment is sequenced at the same time in a massively parallel fashion, generating a vast number of short "reads." These reads are then computationally reassembled by aligning them to a reference genome or by piecing them together de novo [4] [2]. This approach allows an entire human genome to be sequenced within a single day, a task that took Sanger sequencing over a decade [2].
The NGS Workflow: A Step-by-Step Guide
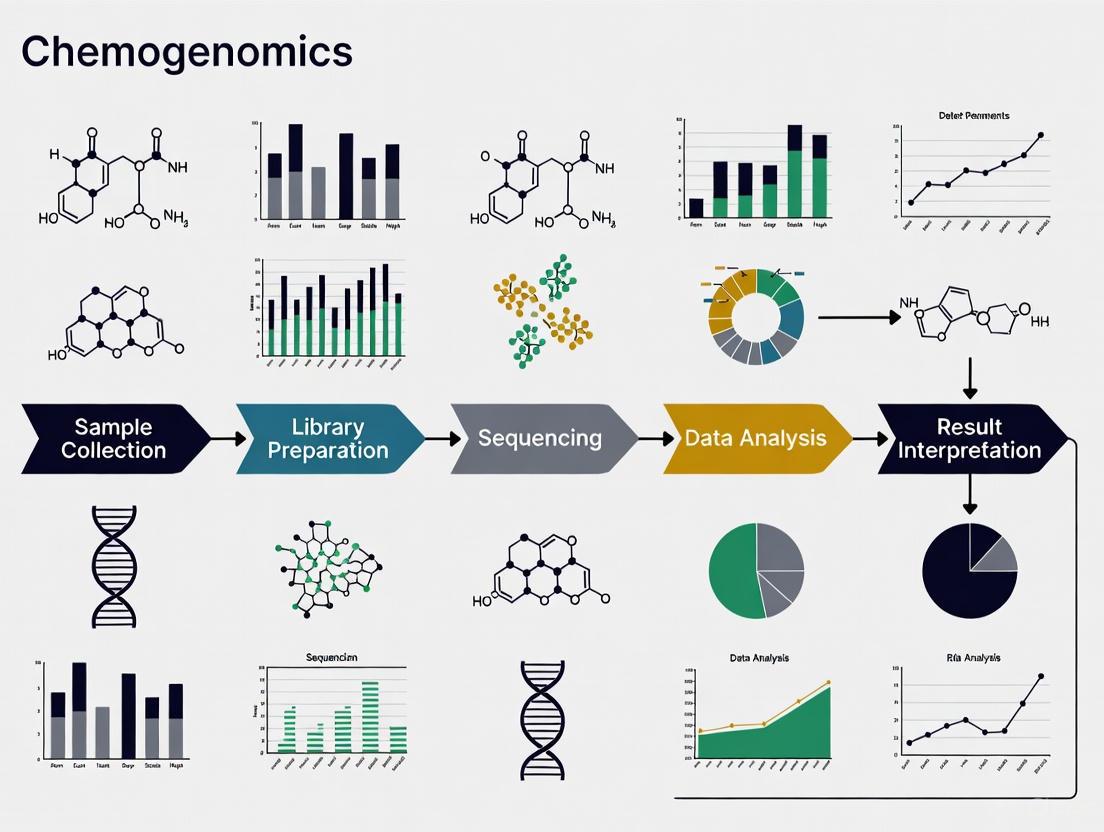
A standard NGS workflow consists of four key steps. For chemogenomics research, where reproducibility and precision are paramount, each step must be meticulously optimized. The workflow is visually summarized in the diagram below.
Step 1: Nucleic Acid Extraction
The process begins with the isolation of pure DNA or RNA from a sample of interest, such as cells treated with a chemical compound [5] [6]. This involves lysing cells and purifying the genetic material from other cellular components. The quality and quantity of the extracted nucleic acid are critical for all subsequent steps.
Step 2: Library Preparation
This is a crucial preparatory step where the purified DNA or RNA is converted into a format compatible with the sequencing instrument.
- Fragmentation: The genomic DNA or cDNA (complementary DNA synthesized from RNA) is randomly fragmented into smaller sizes [4] [6].
- Adapter Ligation: Specialized adapters are ligated (attached) to the ends of these fragments [5] [6]. These adapters serve multiple functions: they contain sequences that allow the fragments to bind to the flow cell (the surface where sequencing occurs), and they include index sequences (barcodes) that enable sample multiplexing—pooling multiple samples into a single sequencing run [6].
- Amplification (Optional): The adapter-ligated fragments, now called the "library," are often amplified using PCR to generate sufficient copies for detection [4]. However, excessive amplification can introduce bias and distort sequence heterogeneity, which is a critical consideration when studying the effects of small molecules on rare transcripts or variants [7].
Quantification of the final library is a sensitive and essential sub-step. Accurate quantification ensures optimal loading onto the sequencer. Methods include:
- Fluorometry (e.g., Qubit): Uses fluorescent dyes that bind specifically to nucleic acids [7].
- qPCR: Quantifies only library fragments that contain intact adapters and are capable of being sequenced, providing a more accurate measure of functional library concentration [7].
- Digital PCR (dPCR/ddPCR): Provides an absolute count of DNA molecules without the need for a standard curve, offering high sensitivity and accuracy, and is particularly useful for quantifying low-abundance libraries or avoiding amplification bias [7].
Step 3: Sequencing
The prepared library is loaded into a sequencer, where the actual determination of the base sequence occurs. The most common chemistry, used by Illumina platforms, is Sequencing by Synthesis (SBS) [1] [4].
- Cluster Amplification: Library fragments are bound to a flow cell and amplified in situ through a process called "bridge amplification" to create tight, clonal clusters of each unique fragment [1] [4].
- Cyclic Reversible Termination (SBS): The flow cell is flooded with fluorescently labeled, reversibly terminated nucleotides. As DNA polymerase incorporates a complementary nucleotide into the growing DNA strand, a fluorescent signal is emitted. After imaging, the terminator and fluorophore are cleaved, and the cycle repeats hundreds of times to determine the sequence base-by-base [1]. Recent innovations like XLEAP-SBS chemistry have further increased the speed and fidelity of this process [1].
Step 4: Data Analysis
The massive number of short sequence reads generated (often tens to hundreds of gigabytes of data) must be processed computationally [1] [5].
- Primary Analysis: Involves base calling, which assigns a quality score (Q-score) to each base, indicating the probability of an incorrect call [7].
- Secondary Analysis: Reads are aligned to a reference genome (alignment), and genetic variants (e.g., single nucleotide polymorphisms, insertions, deletions) are identified (variant calling) [2] [6].
- Tertiary Analysis: This is the interpretive stage, where the biological significance of the data is unlocked. For chemogenomics, this could involve pathway analysis, identifying differentially expressed genes in response to a compound, or correlating genetic mutations with drug sensitivity [1] [5].
NGS Chemistry and Platform Comparison
Different NGS platforms have been developed, each with unique engineering configurations and sequencing chemistries [4]. The table below summarizes the historical and technical context of major NGS platforms.
| Platform (Examples) | Sequencing Chemistry | Key Features | Common Applications |
|---|---|---|---|
| Illumina (HiSeq, MiSeq, NovaSeq) [4] [3] | Sequencing by Synthesis (SBS) with reversible dye-terminators [1] [4] | High throughput, high accuracy, short reads (50-300 bp). Dominates the market [4]. | WGS, WES, RNA-Seq, targeted sequencing [1] |
| Roche 454 [4] [3] | Pyrosequencing | Longer reads (400-700 bp), but higher cost and error rates in homopolymer regions [4] [3]. | Historically significant; technology discontinued [4] |
| Ion Torrent (PGM, Proton) [4] [3] | Semiconductor sequencing (detection of pH change) [4] | Fast run times, but struggled with homopolymer accuracy [4]. | Targeted sequencing, bacterial sequencing [3] |
| SOLiD [4] [3] | Sequencing by oligonucleotide ligation | High raw read accuracy, but complex data analysis and short reads [4] [3]. | Historically significant; technology discontinued [4] |
Table: Comparison of key NGS platforms and their chemistries. Illumina's SBS technology is currently the most widely adopted [4].
The core principle of Illumina's SBS chemistry, which dominates the current market, is illustrated in the following diagram.
Key NGS Applications in Chemogenomics and Drug Discovery
The unbiased discovery power of NGS makes it an indispensable tool in the modern drug development pipeline.
- Target Identification and Validation: NGS can be used to discover novel disease-associated genes by sequencing patients with specific disorders (e.g., rare developmental disorders) or by identifying somatically acquired mutations in cancer genomes, thereby revealing new potential drug targets [2].
- Transcriptomics (RNA-Seq): This application quantifies gene expression across the entire transcriptome. For chemogenomics, RNA-Seq is used to profile the cellular response to chemical compounds, identify novel RNA variants and splice sites, and understand drug mechanisms of action. It offers a broader dynamic range for quantification compared to older technologies like microarrays [1] [5].
- Cancer Genomics and Personalized Medicine: Sequencing cancer samples allows researchers and clinicians to study rare somatic variants, tumor subclones, drug resistance, and metastasis. This enables more precise diagnosis, prognosis, and the identification of "druggable" mutations for targeted therapy [1] [2].
- Microbiome Research: NGS-based whole-genome shotgun sequencing and 16S rRNA sequencing are used to study the human microbiome. This can refine drug discovery by understanding how the microbiome influences drug metabolism, efficacy, and toxicity [1].
- Epigenetics: NGS can analyze epigenetic factors such as genome-wide DNA methylation (Bis-Seq) and DNA-protein interactions (ChIP-Seq). This helps in understanding how chemical compounds alter the epigenetic landscape, which can influence gene expression without changing the underlying DNA sequence [1] [7].
The Scientist's Toolkit: Essential Reagents and Materials
Successful NGS experiments rely on a suite of specialized reagents and tools. The following table details key items for library preparation and sequencing.
| Item / Reagent | Function | Considerations for Chemogenomics |
|---|---|---|
| Nucleic Acid Extraction Kits | Isolate high-quality DNA/RNA from diverse sample types (e.g., cell cultures, tissues). | Consistency in extraction is critical when comparing compound-treated vs. control samples. |
| Fragmentation Enzymes/Systems | Randomly shear DNA into uniform fragments of desired size. | Shearing bias can affect coverage uniformity; method should be consistent across all samples in a screen. |
| Adapter Oligos & Ligation Kits | Attach platform-specific sequences to DNA fragments for binding and indexing. | Unique dual indexing is essential to prevent cross-talk when multiplexing many compound treatment samples. |
| PCR Enzymes for Library Amp | Amplify the adapter-ligated library to generate sufficient mass for sequencing. | Use high-fidelity polymerases and minimize PCR cycles to reduce duplicates and maintain representation of rare transcripts. |
| Quantification Kits (Qubit, qPCR, ddPCR) | Precisely measure library concentration. | Digital PCR (ddPCR) offers high accuracy for low-input samples, crucial for precious chemogenomics samples [7]. |
| Sequenceing Flow Cells & Chemistry (e.g., Illumina SBS kits) | The consumable surface where cluster generation and sequencing occur. | Choice of flow cell (e.g., high-output vs. mid-output) depends on the required scale and depth of the chemogenomic screen. |
Next-Generation Sequencing is more than just a sequencing technology; it is a foundational pillar of modern molecular biology and drug discovery. Its ability to provide massive amounts of genetic information quickly and cost-effectively has transformed how researchers approach biological questions. For the chemogenomics researcher, a deep understanding of the NGS workflow, chemistries, and applications is no longer optional but essential. Mastering this powerful tool enables the systematic deconvolution of compound mechanisms, accelerates target identification, and ultimately paves the way for the development of novel therapeutics.
For researchers entering the field of chemogenomics, understanding the fundamental tools of genomic analysis is paramount. The choice between Next-Generation Sequencing (NGS) and Sanger sequencing represents a critical early decision that can define the scale, scope, and success of a research program. While Sanger sequencing has served as the gold standard for accuracy for decades, NGS technologies have unleashed a revolution in speed, scale, and cost-efficiency, enabling research questions that were previously impossible to address [8] [9]. This guide provides an in-depth technical comparison of these technologies, specifically framed within the context of chemogenomics workflows for beginners, to empower researchers, scientists, and drug development professionals in selecting the optimal sequencing approach for their projects.
The evolution of DNA sequencing from the Sanger method to NGS mirrors the needs of modern biology. Chemogenomics—the study of the interaction of functional biomolecules with chemical libraries—increasingly relies on the ability to generate massive amounts of genomic data to understand compound mechanisms, identify novel drug targets, and elucidate resistance mechanisms. This guide will explore the technical foundations, comparative performance, and practical implementation of both sequencing paradigms to inform these crucial experimental decisions.
Fundamental Technical Differences
The core distinction between Sanger sequencing and NGS lies not in the basic biochemistry of DNA synthesis, but in the scale and parallelism of the sequencing process.
Sanger Sequencing: The Chain Termination Method
Sanger sequencing, also known as dideoxy or capillary electrophoresis sequencing, relies on the selective incorporation of chain-terminating dideoxynucleotides (ddNTPs) during in vitro DNA replication [10] [8]. In this method, DNA polymerase synthesizes a new DNA strand from a single-stranded template, but the inclusion of fluorescently labeled ddNTPs—which lack the 3'-hydroxyl group necessary for chain elongation—causes random termination at specific base positions [9]. The resulting DNA fragments are separated by capillary electrophoresis based on size, and the sequence is determined by detecting the fluorescent signal of the terminal ddNTP at each position [10]. This process generates a single, long contiguous read per reaction, typically ranging from 500 to 1000 base pairs, with exceptionally high accuracy (exceeding 99.99%) [10] [11].
Next-Generation Sequencing: Massively Parallel Sequencing
NGS, or massively parallel sequencing, represents a fundamentally different approach. While it also uses DNA polymerase to synthesize new strands, NGS simultaneously sequences millions to billions of DNA fragments in a single run [12] [5]. One prominent NGS method is Sequencing by Synthesis (SBS), which utilizes fluorescently labeled, reversible terminators that are incorporated one base at a time across millions of clustered DNA fragments immobilized on a solid surface [10]. After each incorporation cycle, a high-resolution imaging system captures the fluorescent signal, the terminator is cleaved, and the process repeats [10]. Other NGS chemistries rely on principles such as ion detection or ligation, but all leverage massive parallelism to achieve unprecedented data output [10].
Diagram 1: Fundamental workflow differences between Sanger and NGS technologies.
Performance and Cost Comparison
The technological differences between Sanger sequencing and NGS translate directly into distinct performance characteristics and economic profiles, which must be carefully evaluated when designing chemogenomics experiments.
Throughput and Scalability
The throughput disparity between these technologies is the single most defining difference. Sanger sequencing processes one DNA fragment per reaction, making it suitable for targeted analysis of small genomic regions but impractical for large-scale projects [8]. In contrast, NGS can sequence millions to billions of fragments simultaneously per run, enabling comprehensive genomic analyses like whole-genome sequencing (WGS), whole-exome sequencing (WES), and transcriptome sequencing (RNA-Seq) [10] [12]. This massive parallelism allows NGS to sequence hundreds to thousands of genes at once, providing unprecedented discovery power for identifying novel variants, structural variations, and rare mutations [12].
Sensitivity and Detection Limits
NGS offers superior sensitivity for detecting low-frequency variants, a critical consideration in chemogenomics applications such as characterizing heterogeneous cell populations or identifying rare resistance mutations. While Sanger sequencing has a detection limit typically around 15-20% allele frequency, NGS can reliably identify variants present at frequencies as low as 1% through deep sequencing [12] [8]. This enhanced sensitivity makes NGS indispensable for applications like cancer genomics, where detecting somatic mutations in mixed cell populations is essential for understanding drug response and resistance mechanisms.
Sequencing Costs and Economic Considerations
The economic landscape of DNA sequencing has transformed dramatically, with NGS costs decreasing at a rate that far outpaces Moore's Law [13] [14]. While the initial capital investment for an NGS platform is substantial, the cost per base is dramatically lower than Sanger sequencing, making NGS significantly more cost-effective for large-scale projects [10] [15].
Table 1: Comprehensive Performance and Cost Comparison
| Feature | Sanger Sequencing | Next-Generation Sequencing |
|---|---|---|
| Fundamental Method | Chain termination with ddNTPs and capillary electrophoresis [10] [9] | Massively parallel sequencing (e.g., Sequencing by Synthesis) [10] [5] |
| Throughput | Low to medium (single fragment per reaction) [8] | Extremely high (millions to billions of fragments per run) [12] |
| Read Length | Long (500-1000 bp) [10] | Short to medium (50-300 bp for short-read platforms) [10] |
| Accuracy | Very high (~99.99%), considered the "gold standard" [11] [9] | High (<0.1% error rate), with accuracy improved by high coverage depth [10] [8] |
| Cost per Base | High [10] | Very low [10] |
| Detection Limit | ~15-20% allele frequency [12] [8] | ~1% allele frequency (with sufficient coverage) [12] [8] |
| Time per Run | Fast for single reactions (1-2 hours) [11] | Longer run times (hours to days) but massive parallelism [12] |
| Best For | Targeted confirmation, single-gene studies, validation [10] [12] | Whole genomes, exomes, transcriptomes, novel discovery [10] [12] |
The National Human Genome Research Institute (NHGRI) has documented a 96% decrease in the average cost-per-genome since 2013 [13]. This trend has continued, with recent announcements of the sub-$100 genome from companies like Complete Genomics and Ultima Genomics [15] [14]. However, researchers should note that these figures typically represent only the sequencing reagent costs, and total project expenses must include library preparation, labor, data analysis, and storage [13] [15].
Table 2: Economic Considerations for Sequencing Technologies
| Economic Factor | Sanger Sequencing | Next-Generation Sequencing |
|---|---|---|
| Initial Instrument Cost | Lower [10] | Higher capital investment [10] |
| Cost per Run | Lower for small projects [12] | Higher per run, but massively more data [12] |
| Cost per Base/Mb | High [10] | Very low [10] |
| Cost per Genome | Prohibitively expensive for large genomes | $80-$200 (reagent cost only for WGS) [15] [14] |
| Data Analysis Costs | Low (minimal bioinformatics required) [10] | Significant (requires sophisticated bioinformatics) [10] |
| Total Cost of Ownership | Lower for small-scale applications | Must factor in ancillary equipment, computing resources, and specialized staff [13] |
Applications in Chemogenomics Research
The choice between Sanger and NGS technologies should be driven by the specific research question, scale, and objectives of the chemogenomics project.
Ideal Applications for Sanger Sequencing
Sanger sequencing remains the method of choice for applications requiring high accuracy for defined targets [8]. In chemogenomics, this includes:
- Validation of NGS findings: Confirming specific variants, mutations, or single nucleotide polymorphisms (SNPs) identified through NGS screening [10] [12].
- Quality control of DNA constructs: Verifying plasmid sequences, inserts, and gene editing outcomes (e.g., CRISPR-Cas9 modifications) [10] [11].
- Focused mutation screening: Interrogating known disease-associated loci or specific genetic variants in response to compound treatment [10].
- Low-throughput genotyping: Analyzing a small number of samples for a limited set of targets where NGS would be economically inefficient [12] [8].
Sanger sequencing is particularly well-suited for chemogenomics beginners starting with targeted, hypothesis-driven research, as it requires minimal bioinformatics expertise and offers a straightforward, reliable workflow [9].
Ideal Applications for Next-Generation Sequencing
NGS excels in discovery-oriented research that requires a comprehensive, unbiased view of the genome [12]. Key chemogenomics applications include:
- Whole-genome sequencing (WGS): Identifying novel genetic variants, structural variations, and copy number alterations across the entire genome in response to compound treatment [10].
- Whole-exome sequencing (WES): Focusing on protein-coding regions to identify causative mutations in functional genomic elements affected by chemical perturbations [10].
- Transcriptomics (RNA-Seq): Profiling gene expression changes, alternative splicing, and novel transcript isoforms induced by compound libraries [10] [12].
- Epigenetics: Mapping genome-wide DNA methylation patterns (methyl-seq) or protein-DNA interactions (ChIP-seq) to understand epigenetic mechanisms of drug action [10].
- High-throughput compound screening: Multiplexing hundreds to thousands of samples in a single run to profile genomic responses across diverse chemical libraries [12].
- Target deconvolution: Identifying novel drug targets and resistance mechanisms through comprehensive genomic analysis of compound-treated cell populations [16].
For chemogenomics researchers, NGS provides the hypothesis-generating power to uncover novel mechanisms and relationships that would remain invisible with targeted approaches.
Experimental Design and Workflow Considerations
Implementing sequencing technologies in a chemogenomics research program requires careful planning of experimental workflows and resource allocation.
NGS Workflow Steps for Beginners
A standard NGS workflow consists of four main steps [5]:
- Nucleic Acid Extraction: Isolation of high-quality DNA or RNA from biological samples, ensuring purity and integrity appropriate for downstream library preparation.
- Library Preparation: Fragmenting the DNA or RNA, followed by the addition of platform-specific adapters. This critical step may include target enrichment (e.g., using hybrid capture or amplicon approaches for focused studies) [16].
- Sequencing: Loading the prepared libraries onto the sequencing platform for massively parallel sequencing. The choice of instrument (e.g., benchtop vs. production-scale) depends on the required throughput and budget [13].
- Data Analysis: The most complex aspect of NGS, involving primary analysis (base calling), secondary analysis (alignment, variant calling), and tertiary analysis (biological interpretation) [10]. Beginners should leverage user-friendly bioinformatics platforms and collaborate with experienced bioinformaticians.
Diagram 2: Complete NGS workflow from sample to biological insight, highlighting key steps for beginners.
The Scientist's Toolkit: Essential Research Reagents and Materials
Successful implementation of sequencing technologies requires careful selection of reagents and materials at each workflow stage.
Table 3: Essential Research Reagent Solutions for Sequencing Workflows
| Reagent/Material | Function | Application Notes |
|---|---|---|
| Nucleic Acid Extraction Kits | Isolation of high-quality DNA/RNA from various sample types | Select kits optimized for your source material (e.g., cells, tissue, blood) [5] |
| Library Preparation Kits | Fragmenting DNA/RNA and adding platform-specific adapters | Choice depends on sequencing application (WGS, WES, RNA-Seq) and sample input [5] |
| Target Enrichment Panels | Enriching specific genomic regions of interest | Critical for targeted NGS; custom panels available for chemogenomics applications [12] |
| Quality Control Instruments | Assessing nucleic acid quality, quantity, and library size distribution | Includes fluorometers, spectrophotometers, and fragment analyzers [13] |
| Sequencing Flow Cells/Chips | Platform-specific consumables where sequencing occurs | Choice affects total data output and cost-efficiency [13] |
| Sequenceing Chemistry Kits | Reagents for the sequencing reactions themselves | Platform-specific (e.g., Illumina SBS, Ion Torrent semiconductor) [16] |
| Bioinformatics Software | Data analysis, from base calling to variant calling and interpretation | Range from vendor-supplied to open-source tools; consider usability for beginners [10] [5] |
Total Cost of Ownership Considerations
When evaluating sequencing technologies, beginners must look beyond the initial instrument price or cost per gigabase. A comprehensive total cost of ownership assessment should include [13]:
- Ancillary equipment (e.g., nucleic acid quantitation instruments, quality analyzers, thermocyclers, centrifuges)
- Laboratory space and facility requirements
- Data storage and analysis infrastructure (computing resources, software licenses, IT support)
- Personnel costs for specialized staff (technical and bioinformatics expertise)
- Training and support services
- Reagent costs and supply chain stability
- Instrument service plans and maintenance
Illumina notes that economies of scale can significantly reduce costs for higher-output applications, but the initial investment in infrastructure and expertise should not be underestimated [13].
The revolution in DNA sequencing from Sanger to NGS technologies has fundamentally transformed the scale and scope of biological research, offering unprecedented capabilities for chemogenomics investigations. For beginners in the field, understanding the complementary strengths of these technologies is essential for designing efficient and informative research programs.
Sanger sequencing remains the gold standard for targeted applications, offering unparalleled accuracy for validating variants, checking engineered constructs, and analyzing small numbers of genes [11] [9]. Its simplicity, reliability, and minimal bioinformatics requirements make it an excellent starting point for focused chemogenomics projects.
In contrast, NGS provides unmatched discovery power for comprehensive genomic analyses, enabling researchers to profile whole genomes, transcriptomes, and epigenomes in response to chemical perturbations [12] [8]. While requiring greater infrastructure investment and bioinformatics expertise, NGS offers tremendous cost-efficiencies for large-scale projects and can reveal novel biological insights that would remain hidden with targeted approaches.
For chemogenomics beginners, the optimal strategy often involves leveraging both technologies—using NGS for broad discovery and Sanger sequencing for targeted validation. As sequencing costs continue to decline and technologies evolve, the accessibility of these powerful tools will continue to expand, opening new frontiers in chemical biology and drug development research.
Key NGS Applications in Chemogenomics and Drug Discovery
Next-Generation Sequencing (NGS) has become a cornerstone of modern chemogenomics and drug discovery, enabling researchers to understand the complex interactions between chemical compounds and biological systems at an unprecedented scale and resolution. By providing high-throughput genomic data, NGS accelerates target identification, biomarker discovery, and the development of personalized medicines, fundamentally reshaping pharmaceutical research and development [17] [18].
Core NGS Workflow in Drug Discovery
A typical NGS experiment follows a standardized workflow to convert a biological sample into interpretable genomic data. Understanding these steps is crucial for designing robust chemogenomics studies.
Library Preparation and Sequencing
The process begins with extracting DNA or RNA from a biological sample. This genetic material is then fragmented into smaller pieces, and specialized adapters (short, known DNA sequences) are ligated to both ends. These adapters often contain unique molecular barcodes that allow multiple samples to be pooled and sequenced simultaneously in a process called multiplexing [19] [20]. The prepared "library" is then loaded onto a sequencer. Most modern platforms use a form of sequencing by synthesis (SBS), where fluorescently-labeled nucleotides are incorporated one at a time into growing DNA strands, with a camera capturing the signal after each cycle [19].
Data Analysis
The massive amount of data generated by the sequencer undergoes a multi-stage analysis pipeline [21] [20]:
- Primary Analysis: The raw signal data from the instrument is converted into sequence reads with corresponding quality scores (Phred scores), resulting in FASTQ files.
- Secondary Analysis: Sequencing reads are cleaned (e.g., adapter trimming, quality filtering) and aligned to a reference genome. This step produces BAM files containing the aligned reads, which are then processed to identify genetic variants, generating VCF files, or to quantify gene expression [21].
- Tertiary Analysis: This stage involves the biological interpretation of the results, such as linking identified genetic variants to disease mechanisms or drug response [21].
Key NGS Applications and Methodologies in Chemogenomics
NGS technologies are applied across the drug discovery pipeline, from initial target identification to clinical trial optimization.
Drug Target Identification and Validation
NGS enables the discovery of novel drug targets by uncovering genetic variants linked to diseases through large-scale genomic studies [18].
- Methodology: Researchers conduct whole-genome sequencing (WGS) or whole-exome sequencing (WES) on cohorts of patients and healthy controls. By comparing the sequences, they can identify genes harboring significant mutations (e.g., loss-of-function mutations) associated with the disease. Studying individuals with naturally occurring loss-of-function mutations can help validate the safety and therapeutic potential of inhibiting a target [18].
- Experimental Protocol:
- Sample Collection: Obtain tissue or blood samples from case and control cohorts.
- NGS Library Preparation: Prepare WGS or WES libraries using multiplexed barcodes.
- Sequencing: Sequence on an appropriate high-throughput platform (e.g., Illumina NovaSeq).
- Bioinformatic Analysis:
- Align sequences to a reference genome (e.g., GRCh38).
- Call variants (SNVs, indels) and perform association analysis.
- Annotate variants and prioritize genes based on functional impact.
- Validation: Confirm key genetic findings using orthogonal methods like Sanger sequencing.
Pharmacogenomics and Toxicogenomics
This application focuses on understanding how genetic variations influence an individual's response to a drug, including efficacy and adverse effects [17] [18].
- Methodology: Targeted sequencing panels or WGS are used to profile genes involved in drug metabolism (e.g., CYP450 family), transport, and mechanism of action. In toxicogenomics, NGS is applied to study how chemicals cause toxicity by altering gene expression [17].
- Experimental Protocol:
- Study Design: Recruit patients showing differential response to a drug (e.g., responders vs. non-responders).
- Sequencing: Perform targeted sequencing of pharmacogenes or whole transcriptome profiling (RNA-Seq) from relevant tissues.
- Data Integration: Correlate genetic variants or gene expression changes with pharmacokinetic/pharmacodynamic (PK/PD) data and clinical outcomes.
- Biomarker Development: Identify genetic biomarkers that can predict drug response for clinical application.
Clinical Trial Stratification and Companion Diagnostics
NGS is used to stratify patients in clinical trials based on their genetic profiles, enriching for those most likely to respond to therapy [17] [18].
- Methodology: Using targeted sequencing of specific biomarkers (e.g., specific oncogenic mutations), patients are selected for trial enrollment. This approach increases trial success rates and facilitates the development of companion diagnostics [17].
- Experimental Protocol:
- Assay Development: Design an NGS-based assay targeting known predictive biomarkers for the disease and drug.
- Patient Screening: Sequence the biomarker panel for potential trial participants.
- Cohort Assignment: Assign patients to treatment arms based on their molecular profile.
- Real-Time Monitoring (Optional): Use newer platforms like Oxford Nanopore for real-time sequencing to monitor treatment response or resistance via circulating tumor DNA (ctDNA) [18].
DNA-Encoded Library Screening
This is a powerful chemogenomics application that accelerates the discovery of small molecules that bind to disease targets [18].
- Methodology: Vast libraries of small molecules, each tagged with a unique DNA barcode, are screened against a protein target of interest. The bound molecules are recovered, and the associated DNA barcodes are amplified and sequenced via NGS to identify the "hit" compounds.
- Experimental Protocol:
- Library Synthesis: Create a DNA-encoded chemical library (DEL).
- Affinity Selection: Incubate the DEL with the purified target protein.
- Wash and Elution: Remove unbound compounds and elute the specifically bound molecules.
- PCR Amplification: Amplify the DNA barcodes from the eluted fraction.
- NGS and Deconvolution: Sequence the barcodes and map them back to the corresponding chemical structures for hit identification.
The table below summarizes the primary NGS technologies and their roles in drug discovery.
Table 1: NGS Technologies and Their Key Applications in Drug Discovery
| Technology | Primary Application in Drug Discovery | Key Advantage | Typical Data Output |
|---|---|---|---|
| Whole Genome Sequencing (WGS) [17] | Comprehensive discovery of novel disease-associated variants and targets. | Unbiased, genome-wide view. | Very High (Gb – Tb) |
| Whole Exome Sequencing (WES) [17] [18] | Cost-effective discovery of coding variants linked to disease and drug response. | Focuses on protein-coding regions; more cost-effective than WGS. | Medium to High (Gb) |
| Targeted Sequencing / Gene Panels [17] | High-depth sequencing of specific genes for biomarker validation, pharmacogenomics, and companion diagnostics. | Cost-effective, allows for high sequencing depth on specific regions. | Low to Medium (Mb – Gb) |
| RNA Sequencing (RNA-Seq) [19] [18] | Profiling gene expression to understand drug mechanism of action, identify biomarkers, and study toxicogenomics. | Measures expression levels across the entire transcriptome. | Medium to High (Gb) |
| ChIP-Sequencing (ChIP-Seq) [17] [22] | Identifying binding sites of transcription factors or histone modifications to understand gene regulation by drugs. | Provides genome-wide map of protein-DNA interactions. | Medium to High (Gb) |
The Scientist's Toolkit: Essential Reagents and Materials
Successful implementation of NGS in chemogenomics relies on a suite of specialized reagents and tools.
Table 2: Essential Research Reagent Solutions for NGS in Drug Discovery
| Item | Function | Application Context |
|---|---|---|
| Unique Dual Index (UDI) Kits [23] | Allows multiplexing of many samples by labeling each with unique barcodes on both ends of the fragment, minimizing index hopping. | Essential for any large-scale study pooling multiple patient or compound treatment samples. |
| NGS Library Prep Kits [19] | Kits tailored for specific applications (e.g., WGS, RNA-Seq, targeted panels) containing enzymes and buffers for fragmentation, end-repair, adapter ligation, and amplification. | The foundational starting point for preparing genetic material for sequencing. |
| Targeted Panels [17] | Pre-designed sets of probes to capture and enrich specific genes or genomic regions of interest (e.g., for pharmacogenetics or cancer biomarkers). | Used in companion diagnostic development and clinical trial stratification. |
| PhiX Control [24] | A well-characterized control library spiked into runs to monitor sequencing accuracy and, critically, to assist with color balance on Illumina platforms. | Vital for quality control, especially on modern two-channel sequencers (NextSeq, NovaSeq) to prevent data loss. |
| Cloud-Based Analysis Platforms [17] | Scalable computing resources to manage, store, and analyze the terabyte-scale datasets generated by NGS. | Crucial for tertiary analysis and integrating multi-omic datasets without local IT infrastructure. |
Data Visualization and Mining in Chemogenomics
Interpreting the vast datasets from NGS experiments requires specialized visualization tools that go beyond genome browsers. Programs like ngs.plot are designed to quickly mine and visualize enrichment patterns across functionally important genomic regions [22].
- Functionality: ngs.plot integrates NGS data (e.g., from ChIP-Seq or RNA-Seq) with genomic annotations (e.g., transcriptional start sites, enhancers) to generate average enrichment profiles and heatmaps. This allows researchers to see, for example, how a histone modification changes across a gene set after drug treatment [22].
- Workflow: The tool takes aligned reads (BAM files) and a set of genomic regions, calculates the coverage, normalizes it, and produces publication-ready figures showing aggregate patterns [22].
Quantitative Impact and Market Growth
The adoption of NGS in drug discovery is driven by clear quantitative benefits and significant market growth, reflecting its transformative impact.
Table 3: Market and Impact Metrics of NGS in Drug Discovery
| Metric | Value / Statistic | Context / Significance |
|---|---|---|
| Market Size (2024) [17] | USD 1.45 Billion | Demonstrates the substantial current investment and adoption of NGS technologies in the pharmaceutical industry. |
| Projected Market Size (2034) [17] | USD 4.27 Billion | Reflects the expected continued growth and integration of NGS into R&D pipelines. |
| Compound Annual Growth Rate (CAGR) [17] | 18.3% | Highlights the rapid pace of adoption and expansion of NGS applications in drug discovery. |
| Leading Application Segment [17] | Drug Target Identification (~37.2% revenue share) | Underscores the critical role of NGS in the foundational stage of discovering new therapeutic targets. |
| Leading Technology Segment [17] | Targeted Sequencing (~39.6% revenue share) | Indicates the prevalence of focused, cost-effective sequencing for biomarker and diagnostic development. |
| Cost Reduction [18] | From ~$100M (2001) to under $1,000 per genome | This drastic cost reduction has made large-scale genomic studies feasible, directly enabling precision medicine. |
The integration of NGS into chemogenomics represents a paradigm shift in drug discovery. As sequencing technologies continue to evolve, becoming faster, more accurate, and more affordable, their role in enabling the development of precise and effective personalized therapies will only become more central [19] [17] [18].
Next-generation sequencing (NGS) represents a collection of high-throughput DNA sequencing technologies that enable the rapid parallel sequencing of millions to billions of DNA fragments [5] [6]. For researchers in chemogenomics and drug development, understanding the core NGS approaches—targeted panels, whole exome sequencing (WES), and whole genome sequencing (WGS)—is fundamental to selecting the appropriate methodology for specific research questions. These technologies have revolutionized genetic research by dramatically reducing sequencing costs and analysis times while expanding the scale of genomic investigations [25] [5]. The selection between these approaches involves careful consideration of multiple factors including research objectives, target genomic regions, required coverage depth, and available resources [25].
Each methodological approach offers distinct advantages and limitations for specific applications in drug discovery and development. Targeted sequencing panels provide deep coverage of select gene sets, WES offers a cost-effective survey of protein-coding regions, and WGS delivers the most comprehensive genomic analysis by covering both coding and non-coding regions [25] [26]. This technical guide examines these three major NGS approaches within the context of chemogenomics research, providing detailed methodologies, comparative analyses, and practical implementation guidelines to inform researchers and drug development professionals.
Technical Specifications of Major NGS Approaches
Targeted Sequencing Panels
Targeted sequencing panels utilize probes or primers to isolate and analyze specific subsets of genes associated with particular diseases or biological pathways [25] [27]. This approach focuses on predetermined genomic regions of interest, making it highly efficient for investigating well-characterized genetic conditions. Targeted panels deliver greater coverage depth per base of targeted genes, which facilitates easier interpretation of results and is particularly valuable for detecting low-frequency variants [25]. The method is considered the most economical and effective diagnostic approach when the genes associated with suspected diseases have already been identified [25].
A significant limitation of targeted panels is their restricted scope, which may miss molecular diagnoses outside the predetermined gene set. A 2021 study demonstrated that targeted panels missed diagnoses in 64% of rare disease cases compared to exome sequencing, with metabolic abnormality disorders showing the highest rate of missed diagnoses at 86% [27]. Additionally, targeted sequencing typically allows only for one-time analysis, making it impossible to re-analyze data for other genes if the initial results are negative [25]. This constraint is particularly problematic in research settings where new gene-disease associations are continuously being discovered, with approximately 250 gene-disease associations and over 9,000 variant-disease associations reported annually [25].
Whole Exome Sequencing (WES)
Whole exome sequencing focuses specifically on the exon regions of the genome, which comprise approximately 2% of the entire genome but harbor an estimated 85% of known pathogenic variants [25]. WES represents a balanced approach between the narrow focus of targeted panels and the comprehensive scope of WGS, providing more extensive information than targeted sequencing while remaining more cost-effective than WGS [25]. This methodology is particularly valuable as a first-tier test for cases involving severe, nonspecific symptoms or conditions such as chromosomal imbalances, microdeletions, or microduplications [25].
The primary limitation of WES stems from its selective targeting of exonic regions. Not all exonic regions can be effectively evaluated due to variations in capture efficiency, and noncoding regions are not sequenced, making it impossible to detect functional variants outside exonic areas [25]. WES also demonstrates limited sensitivity for detecting structural variants (SVs), with the exception of certain copy number variations (CNVs) such as indels and duplications [25]. Additionally, data quality and specific genomic regions covered can vary depending on the capture kit utilized, as different kits employ distinct targeted regions and probe manufacturing methods [25]. On average, approximately 100,000 mutations can be identified in an individual's WES data, requiring sophisticated filtering and interpretation according to established guidelines such as those from the American College of Medical Genetics and Genomics (ACMG) [25].
Whole Genome Sequencing (WGS)
Whole genome sequencing represents the most comprehensive NGS approach by analyzing the entire genome, including both coding and non-coding regions [25]. This extensive coverage provides WGS with the highest diagnostic rate among genetic testing methods and enables the detection of variation types that cannot be identified through WES, including structural variants and mitochondrial DNA variations [25]. By extending gene analysis coverage to non-coding regions, WGS can reduce unnecessary repetitive testing and provide a more complete genomic profile [25].
The comprehensive nature of WGS presents significant challenges in data management and interpretation. WGS generates extensive datasets, with costs for storing and analyzing this data typically two to three times higher than those for WES, despite constant technological advances steadily decreasing these expenses [25]. The interpretation of non-coding variants presents another substantial challenge, as there is insufficient research on non-coding regions compared to exonic regions, resulting in inadequate information for variant analysis [25]. This insufficient evidence regarding pathogenicity of non-coding variants can create confusion among researchers and clinical geneticists. On average, WGS detects around 3 million mutations per individual, making comprehensive assessment of each variant's pathogenicity nearly impossible without advanced computational approaches [25].
Comparative Analysis of NGS Approaches
Technical and Performance Specifications
Table 1: Comparative technical specifications of major NGS approaches
| Parameter | Targeted Panels | Whole Exome Sequencing (WES) | Whole Genome Sequencing (WGS) |
|---|---|---|---|
| Genomic Coverage | 10s - 100s of specific genes | ~2% of genome (exonic regions) | ~100% of genome (coding & non-coding) |
| Known Pathogenic Variant Coverage | Limited to panel content | ~85% of known pathogenic variants [25] | Nearly 100% |
| Average Diagnostic Yield | Varies by panel (avg. 36% sensitivity vs. ES for rare diseases) [27] | ~31.6% (rare diseases) [27] | Highest among methods [25] |
| Variant Types Detected | SNVs, small indels in targeted regions | SNVs, small indels, some CNVs [25] | SNVs, indels, CNVs, SVs, mitochondrial variants [25] |
| Typical Coverage Depth | High (>500x) | Moderate (100-200x) | Lower (30-60x) |
| Data Volume per Sample | Lowest (MB-GB range) | Moderate (GB range) | Highest (100+ GB range) |
Table 2: Practical considerations for NGS approach selection
| Consideration | Targeted Panels | Whole Exome Sequencing (WES) | Whole Genome Sequencing (WGS) |
|---|---|---|---|
| Cost Considerations | Most economical [25] | Cost-effective intermediate [25] | Highest cost (2-3x WES for data analysis) [25] |
| Ideal Use Cases | Well-characterized genetic conditions; known gene sets [25] | Non-specific symptoms; heterogeneous conditions; first-tier testing [25] | Unexplained rare diseases; negative WES/panel results; comprehensive variant detection [25] |
| Data Analysis Complexity | Lowest | Moderate | Highest (∼3 million variants/sample) [25] |
| Reanalysis Potential | Limited (one-time analysis) [25] | High (as new genes discovered) | Highest (complete genomic record) |
| ACMG Recommendation | - | Primary/secondary test for CA/DD/ID [25] | Primary/secondary test for CA/DD/ID [25] |
Decision Framework for NGS Approach Selection
Selecting the appropriate NGS methodology requires careful consideration of the research context and constraints. The American College of Medical Genetics and Genomics (ACMG) has recommended both WES and WGS as primary or secondary testing options for patients with rare genetic diseases, such as congenital abnormalities, developmental delays, or intellectual disabilities (CA/DD/ID) [25]. Numerous studies have demonstrated that WES and WGS can significantly increase diagnostic rates and provide greater clinical utility in such cases [25].
For research applications with clearly defined genetic targets, targeted panels offer the advantages of greater coverage depth and more straightforward data interpretation [25]. When investigating conditions with extensive locus heterogeneity or nonspecific presentations, WES provides a balanced approach that captures most known pathogenic variants while remaining cost-effective [25]. For the most comprehensive analysis, particularly when previous testing has been negative or when structural variants are suspected, WGS offers the highest diagnostic yield despite its greater computational demands [25].
Experimental Workflow and Methodologies
Universal NGS Wet-Lab Protocol
The basic NGS workflow consists of four fundamental steps that apply across different sequencing approaches, though with specific modifications for each method [5] [6]:
Nucleic Acid Extraction: DNA (or RNA for transcriptome studies) is isolated from the biological sample through cell lysis and purification to remove cellular contaminants. Sample quality and quantity are assessed through spectrophotometry or fluorometry [5] [6].
Library Preparation: This critical step fragments the DNA and ligates platform-specific adapters to the fragments. For targeted approaches, this step includes enrichment through hybridization-based capture or amplicon-based methods using probes or primers designed for specific genomic regions [5] [6]. WES uses exome capture kits (e.g., Agilent Clinical Research Exome) to enrich for exonic regions, while WGS processes the entire genome without enrichment [27].
Sequencing: Libraries are loaded onto sequencing platforms (e.g., Illumina NextSeq) where sequencing-by-synthesis occurs. The platform generates short reads (100-300 bp) that represent the sequences of the DNA fragments [5] [27].
Data Analysis: Raw sequencing data undergoes quality control, alignment to a reference genome (e.g., GRCh37/hg19), variant calling, and annotation using specialized bioinformatics tools [5] [27].
Bioinformatics Analysis Pipeline
The computational analysis of NGS data follows a structured pipeline to transform raw sequencing data into biologically meaningful results:
Quality Control and Read Filtering: Raw sequencing reads in FASTQ format are assessed for quality using tools like FastQC. Low-quality bases and adapter sequences are trimmed to ensure data integrity [28] [27].
Alignment to Reference Genome: Processed reads are aligned to a reference genome (e.g., GRCh37/hg19 or GRCh38) using aligners such as Burrows-Wheeler Aligner (BWA). This step produces SAM/BAM format files containing mapping information [28] [27].
Variant Calling: Genomic variants (SNVs and indels) are identified using tools like the Genome Analysis ToolKit (GATK). The resulting variants are stored in VCF format with quality metrics and filtering flags [27].
Variant Annotation and Prioritization: Detected variants are annotated with functional predictions, population frequencies, and disease associations using tools such as Variant Effect Predictor (VEP). Variants are then prioritized based on frequency, predicted impact, and phenotypic relevance [27].
Table 3: Essential research reagents and solutions for NGS workflows
| Research Reagent/Solution | Function in NGS Workflow | Application Notes |
|---|---|---|
| Agilent Clinical Research Exome | Exome capture kit for WES | Used for targeting protein-coding regions; v1 captures ~2% of genome [27] |
| Illumina NextSeq Platform | Sequencing instrument | Mid-output sequencer for WES and panels; uses sequencing-by-synthesis chemistry [27] |
| Burrows-Wheeler Aligner (BWA) | Alignment software | Aligns sequencing reads to reference genome (GRCh37/hg19) [27] |
| Genome Analysis ToolKit (GATK) | Variant discovery toolkit | Best practices for SNV and indel calling; version 3.8-0-ge9d806836 [27] |
| Variant Effect Predictor (VEP) | Variant annotation tool | Annotates functional consequences of variants; version 88.14 [27] |
| DNA Extraction Kits | Nucleic acid purification | Isolate high-quality DNA from blood or saliva samples [27] |
| Library Preparation Kits | Fragment DNA and add adapters | Platform-specific kits for Illumina, PacBio, or Oxford Nanopore systems [6] |
Applications in Drug Discovery and Development
NGS technologies have become indispensable tools throughout the drug development pipeline, from target identification to companion diagnostic development [26] [29]. Each NGS approach offers distinct advantages for specific applications in pharmaceutical research:
Target Identification and Validation: WGS and WES enable comprehensive genomic analyses to identify novel therapeutic targets by comparing genomes between affected and unaffected individuals. For example, researchers have identified 42 new risk indicators for rheumatoid arthritis through analysis of 10 million single nucleotide polymorphisms (SNPs) in over 100,000 subjects [29].
Drug Repurposing: SNP analysis through WGS can identify existing therapies that could be effective for other medical conditions. The same rheumatoid arthritis study revealed three drugs used in cancer treatment that could be potentially repurposed for RA treatment [29].
Combating Drug Resistance: NGS approaches help identify mechanisms of drug resistance and predict patient response to therapies. This application is particularly valuable in infectious disease research for understanding antimicrobial resistance and in oncology for addressing chemotherapy failures, which were estimated at 90% in 2017, largely due to drug resistance [29].
Precision Cancer Medicine: Targeted NGS panels enable the identification of biomarkers that predict treatment response. In bladder cancer, for example, tumors with a specific TSC1 mutation showed significantly better response to everolimus, illustrating how genetic stratification can identify patient subgroups that benefit from specific therapies [29].
Pharmacogenomics: WES provides cost-effective genotyping of pharmacogenetically relevant variants, helping to predict drug metabolism and adverse event risk, thereby supporting personalized treatment approaches [25] [26].
The selection of appropriate NGS methodologies represents a critical decision point in chemogenomics research and drug development. Targeted panels, whole exome sequencing, and whole genome sequencing each offer distinct advantages that make them suitable for specific research contexts and questions. Targeted panels provide cost-effective, deep coverage for well-characterized gene sets; WES offers a balanced approach for investigating coding regions with reasonable cost; while WGS delivers the most comprehensive genomic profile at higher computational expense. Understanding the technical specifications, performance characteristics, and practical implementation requirements of each approach enables researchers to align methodological choices with specific research objectives, ultimately accelerating drug discovery and development through more effective genomic analysis.
Next-generation sequencing (NGS) has revolutionized genomic research and clinical diagnostics by enabling the rapid sequencing of millions of DNA fragments simultaneously [5]. For researchers in chemogenomics and drug development, a precise understanding of core NGS metrics—read depth, coverage, and variant allele frequency (VAF)—is fundamental to designing robust experiments and accurately interpreting genomic data. This technical guide delineates these critical parameters, their interrelationships, and their practical implications within the NGS workflow, providing a foundation for effective application in targeted therapeutic discovery and development.
Core Terminology and Definitions
Read Depth (Sequencing Depth)
Read depth, also termed sequencing depth or depth of coverage, refers to the number of times a specific nucleotide in the genome is sequenced [30] [31]. It is a measure of data redundancy at a given base position.
- Calculation: Expressed as an average multiple (e.g., 100x), meaning each base in the target region was sequenced, on average, 100 times [31].
- Primary Function: Higher read depth increases confidence in base calling and is critical for detecting low-frequency variants, such as somatic mutations in heterogeneous tumor samples or minor subclones in microbial populations [32] [31].
Coverage
Coverage describes the proportion or percentage of the target genome or region that has been sequenced at least once [31]. It reflects the completeness of the sequencing effort.
- Calculation: Typically expressed as a percentage (e.g., 95% coverage at 10x depth means 95% of the target bases were sequenced at least 10 times) [33].
- Primary Function: Ensures that the entirety of the genomic region of interest has been sampled, thereby minimizing gaps in the data that could lead to missed variants [31].
Variant Allele Frequency (VAF)
Variant Allele Frequency (VAF) is the percentage of sequence reads at a genomic position that carry a specific variant [32] [30].
- Calculation:
VAF = (Number of reads containing the variant / Total number of reads covering that position) * 100[30]. For instance, if 50 out of 1,000 reads at a position show a mutation, the VAF is 5% [30]. - Primary Function: VAF helps infer the prevalence of a mutation within a sample, which has critical implications in oncology for understanding tumor heterogeneity, clonal evolution, and measurable residual disease (MRD) [32] [30].
The Interplay of Depth, Coverage, and VAF in Assay Sensitivity
The relationship between sequencing depth and VAF sensitivity is foundational to NGS assay design. Deeper sequencing directly enhances the ability to detect low-frequency variants with confidence [30].
The diagram above illustrates the logical relationship between these metrics. Higher sequencing depth mitigates the sampling effect, a phenomenon where a low number of reads can lead to overestimation, underestimation, or complete missing of variants [30]. With 100x coverage, a true 1% VAF might be represented by a single variant read, which could be easily missed or dismissed as an error. In contrast, with 10,000x coverage, the same 1% VAF would be represented by 100 variant reads, providing a statistically robust measurement [30].
Quantitative Guidelines for NGS Experiment Design
Selecting the appropriate sequencing depth is a critical decision that balances detection sensitivity with cost-effectiveness [30]. The required depth varies significantly based on the study's objective.
Table 1: Recommended Sequencing Depth by Application
| Research Application | Typical Sequencing Depth | Key Rationale and Considerations |
|---|---|---|
| Germline Variant Detection | 30x - 50x (WGS) [31] | Assumes variants are at ~50-100% VAF; lower depth is sufficient for confident calling [30]. |
| Somatic Variant Detection (Solid Tumors) | 100x - 500x and above [32] | Needed to detect subclonal mutations in samples with mixed tumor/normal cell populations [34]. |
| Measurable Residual Disease (MRD) | >1,000x (Ultra-deep) [32] [30] | Essential for identifying cancer-associated variants at VAFs well below 1% [30]. |
| VAF < 3% (e.g., TP53 in CLL) | ≥1,650x [32] | Recommended minimum depth for detecting 3% VAF with a threshold of 30 mutated reads, based on binomial distribution to minimize false positives/negatives [32]. |
The necessary depth is mathematically linked to the desired lower limit of VAF detection. Using binomial probability distribution, a minimum depth of 1,650x is recommended for reliable detection of variants at ≥3% VAF, with a supporting threshold of at least 30 mutated reads to minimize false positives and negatives [32]. Deeper coverage reduces the impact of sequencing errors, which typically range between 0.1% and 1%, thereby improving the reliability of low-frequency variant calls [32].
Methodological Framework: Implementing Metrics in the NGS Workflow
Understanding these terminologies is operationalized through a standardized NGS workflow, which consists of four key steps [35] [36].
The End-to-End NGS workflow
Detailed Methodologies for Key Steps
Library Preparation
This process converts extracted nucleic acids into a format compatible with the sequencer. DNA is fragmented (mechanically or enzymatically), and platform-specific adapters are ligated to the ends of the fragments [34]. These adapters facilitate binding to the flow cell and contain indexes (barcodes) that enable sample multiplexing—pooling multiple libraries for a single sequencing run, which dramatically improves cost-efficiency [33] [36]. An optional but common enrichment step (e.g., using hybridization capture or amplicon-based panels) can be incorporated to target specific genomic regions of interest [36] [37].
Sequencing and Data Analysis
During sequencing, massively parallel sequencing-by-synthesis occurs on instruments like Illumina systems [35]. The primary data output is a set of reads (sequence strings of A, T, C, G). In the analysis phase:
- Base Calling and Read Alignment: Sequences are aligned to a reference genome [34].
- Variant Calling and Calculation of Metrics: Bioinformatics tools identify differences from the reference. At this stage, read depth is calculated for each position, coverage is determined for the target region, and VAF is computed for each identified variant [36] [34].
The Scientist's Toolkit: Essential Research Reagents and Materials
| Item / Reagent | Critical Function in the NGS Workflow |
|---|---|
| Nucleic Acid Extraction Kits | Isolate high-purity DNA/RNA from diverse sample types (e.g., blood, cells, tissue); quality is paramount for downstream success [36] [37]. |
| Fragmentation Enzymes/Systems | Enzymatic (e.g., tagmentation) or mechanical (e.g., sonication) methods to shear DNA into optimal fragment sizes for sequencing [34] [37]. |
| Sequencing Adapters & Indexes | Short oligonucleotides ligated to fragments; enable cluster generation on the flow cell and sample multiplexing, respectively [33] [36]. |
| Target Enrichment Probes/Primers | For targeted sequencing; biotinylated probes (hybridization) or primer panels (amplicon) to isolate specific genomic regions [36] [34]. |
| Polymerase (PCR Enzymes) | Amplify library fragments; high-fidelity enzymes are essential to minimize introduction of amplification biases and errors during library prep [37]. |
Advanced Considerations in Clinical and Chemogenomics Applications
In translational research and drug development, these metrics directly impact the reliability of findings.
- Tumor Heterogeneity and Clonal Evolution: Cancers often contain multiple subclones with different mutations [34]. A sequencing depth sufficient to detect low-VAF variants (e.g., 1-5%) is necessary to fully characterize the tumor genome, understand resistance mechanisms, and identify potential therapeutic targets [32] [34].
- Standardization and Quality Control: The lack of consensus on minimum coverage depth remains a challenge in clinical NGS [32]. Laboratories must validate their assays by establishing a limit of detection (LOD) linked to sequencing depth, which defines the lowest VAF that can be reliably detected. For example, a study demonstrated that a coverage depth of only 100x resulted in a 30-45% false negative rate for detecting variants at 10% VAF, highlighting the risks of insufficient depth [32].
- Error Sources: The overall error rate of an NGS assay includes not only the intrinsic sequencing error (~0.1-1%) but also errors introduced during DNA processing and library preparation [32]. Deeper sequencing helps overcome these technical noises, ensuring that true biological variants are accurately discerned.
Read depth, coverage, and VAF are interdependent metrics that form the quantitative backbone of any rigorous NGS study. For chemogenomics researchers and drug development professionals, a nuanced grasp of these concepts is indispensable for designing sensitive and cost-effective experiments, interpreting complex genomic data from heterogeneous samples, and ultimately making informed decisions in the therapeutic discovery pipeline. By strategically applying the guidelines and methodologies outlined in this whitepaper—such as deploying ultra-deep sequencing for MRD detection—researchers can fully leverage the power of NGS to drive innovation in precision medicine.
The Step-by-Step NGS Laboratory Workflow: From Sample to Sequence
In the context of next-generation sequencing (NGS) for chemogenomics, the initial step of sample preparation and nucleic acid extraction is the most critical determinant of success. This phase involves the isolation of pure, high-quality genetic material (DNA or RNA) from biological samples, which serves as the foundational template for all subsequent sequencing processes [35] [38]. The profound impact of this step on final data quality cannot be overstated; even with the most advanced sequencers and library preparation kits, compromised starting material will inevitably derail an entire NGS run, leading to wasted resources and unreliable data [39]. For chemogenomics researchers, who utilize chemical compounds to probe biological systems and discover new therapeutics, the integrity of this genetic starting material is paramount for uncovering meaningful insights into gene expression, genetic variations, and drug-target interactions [40]. This guide details the essential protocols and considerations for ensuring that this first step establishes a robust foundation for your entire NGS workflow.
Core Principles and Quality Metrics
The primary goal of nucleic acid extraction is to obtain material that is optimal for library preparation. This is measured by three key metrics: Yield, Purity, and Quality [38] [36].
- Yield: This refers to the total amount of nucleic acid isolated. Most library preparation methods require nanograms to micrograms of DNA or cDNA (synthesized from RNA) [38] [36]. Sufficient yield is especially crucial when working with low-biomass samples, such as single cells or cell-free DNA (cfDNA).
- Purity: Isolated nucleic acids must be free of contaminants that can inhibit the enzymes used in later library preparation steps. Common inhibitors include reagents from the isolation process itself (e.g., phenol, ethanol, salts) or carryover from biological samples (e.g., heparin, humic acid, proteins) [38] [39].
- Quality: This pertains to the integrity and structural state of the nucleic acids. For DNA, this means it should be of high molecular weight and intact. For RNA, degradation must be minimized to ensure the transcriptome is accurately represented [38]. The importance of quality is highlighted by extensive analyses, such as one study of over 2,500 FFPE tissue samples, which found that samples with high DNA integrity had NGS success rates of ~94%, compared to only ~5.6% for low-integrity samples [39].
Table 1: Essential Quality Control Metrics for Nucleic Acids
| Metric | Description | Recommended Assessment Methods | Ideal Values/Outputs |
|---|---|---|---|
| Yield | Total quantity of nucleic acid obtained. | Fluorometric assays (e.g., Qubit, PicoGreen) [38] [39]. | Nanograms to micrograms, as required by the library prep protocol [36]. |
| Purity | Absence of contaminants that inhibit enzymes. | UV Spectrophotometry (A260/A280 and A260/A230 ratios) [35] [39]. | A260/280: ~1.8 (DNA), ~2.0 (RNA). A260/230: >1.8 [39]. |
| Quality/Integrity | Structural integrity and fragment size of nucleic acids. | Gel Electrophoresis; Microfluidic electrophoresis (e.g., Bioanalyzer, TapeStation); RNA Integrity Number (RIN) for RNA [38] [39]. | High molecular weight, intact bands for DNA; RIN > 8 for high-quality RNA [38]. |
Detailed Methodologies and Experimental Protocols
Nucleic Acid Extraction Workflow
The following diagram outlines the generalized workflow for nucleic acid extraction, from sample collection to a qualified sample ready for library preparation.
Step-by-Step Protocol
Sample Collection and Stabilization [39] [37]
- Procedure: Immediately after collection, stabilize samples using appropriate methods to inhibit nucleases and prevent degradation. For tissues, this may involve flash-freezing in liquid nitrogen or immersion in stabilizers like RNAlater. For blood, use collection tubes containing anticoagulants like EDTA.
- Key Consideration: Minimize the number of freeze-thaw cycles, as each cycle incrementally degrades nucleic acids. Record comprehensive sample metadata (source, time, storage temperature) for traceability.
-
- Procedure: Lyse cells and tissues using a method tailored to the sample type. This can be:
- Mechanical: Grinding (for tough plant or tissue materials), or bead beating.
- Chemical: Use of detergents and chaotropic salts to disrupt membranes.
- Enzymatic: Application of enzymes like lysozyme (for bacteria) or proteinase K (for general protein digestion).
- Key Consideration: Optimize buffer composition and lysis conditions to completely break down cell walls and protein complexes without causing excessive shearing of genomic DNA.
- Procedure: Lyse cells and tissues using a method tailored to the sample type. This can be:
Separation and Purification [39] [36]
- Procedure: Separate nucleic acids from cellular debris (proteins, lipids, carbohydrates). This is commonly achieved through:
- Silica-Membrane Columns: Where nucleic acids bind to the membrane in the presence of a high-salt buffer.
- Magnetic Beads: Which bind nucleic acids and are retrieved using a magnet.
- Key Consideration: For challenging samples (e.g., plants, FFPE), additional cleanup steps may be necessary to remove specific inhibitors like polysaccharides or pigments.
- Procedure: Separate nucleic acids from cellular debris (proteins, lipids, carbohydrates). This is commonly achieved through:
-
- Procedure: Perform multiple wash steps with ethanol-based buffers to remove salts, solvents, and other contaminants while the nucleic acids remain bound to the column or beads.
- Key Consideration: Ensure residual ethanol is completely removed after the final wash, as it can inhibit downstream enzymatic reactions. Avoid overdrying the membrane or beads, as this can make elution inefficient.
-
- Procedure: Elute the purified nucleic acids in a low-EDTA buffer (e.g., 10 mM Tris-HCl, pH 7.5-8.5) or nuclease-free water. Warming the elution buffer to 37-55°C and allowing it to incubate on the matrix for 2-5 minutes can improve yield.
- Key Consideration: The elution buffer must be compatible with downstream NGS library preparation steps. Buffers with high concentrations of EDTA can chelate magnesium ions and reduce enzyme activity.
The Scientist's Toolkit: Research Reagent Solutions
Table 2: Essential Reagents and Kits for Nucleic Acid Extraction
| Item/Kit | Primary Function | Key Considerations |
|---|---|---|
| Lysis Buffers | To disrupt cellular and nuclear membranes, releasing nucleic acids. | Buffer composition (detergents, salts, pH) must be optimized for specific sample types (e.g., Gram-positive bacteria, fibrous tissue) [39]. |
| Protease (e.g., Proteinase K) | To digest histone and non-histone proteins, freeing DNA. | Essential for digesting tough tissues and inactivating nucleases. Incubation time and temperature are critical for efficiency [37]. |
| RNase A (for DNA isolation) | To degrade RNA contamination in a DNA sample. | Should be DNase-free. An incubation step is added after lysis. |
| DNase I (for RNA isolation) | To degrade DNA contamination in an RNA sample. | Should be RNase-free. Typically used on-column during purification [39]. |
| Silica-Membrane Spin Columns | To bind, wash, and elute nucleic acids based on charge affinity. | High-throughput and relatively simple. Well-suited for a wide range of sample types and volumes [39] [36]. |
| Magnetic Bead Kits | To bind nucleic acids which are then manipulated using a magnet. | Amenable to automation, reducing hands-on time and cross-contamination risk. Ideal for high-throughput workflows [39]. |
| Inhibitor Removal Additives (e.g., CTAB, PVPP) | To bind and remove specific contaminants like polyphenols and polysaccharides. | Crucial for challenging sample types such as plants, soil, and forensic samples [39]. |
Advanced Considerations for Challenging Samples
Working with low-quality or low-quantity starting material requires additional strategies:
- Formalin-Fixed Paraffin-Embedded (FFPE) Tissues: Nucleic acids from FFPE samples are typically fragmented and cross-linked. Use isolation kits specifically designed for FFPE to maximize the recovery of sequenceable fragments. Target enrichment approaches or whole genome amplification may be necessary [38] [39].
- Single Cells and Low-Input Samples: When working with a limited quantity of nucleic acids, Whole Genome Amplification (WGA) or Whole Transcriptome Amplification (WTA) can be employed to generate sufficient material for library preparation. Enzymes with high processivity and low bias, such as phi29 DNA polymerase, are preferred for this purpose [38].
- Contamination Prevention: Contamination is a significant risk, especially with sensitive low-input applications.
- Strategies: Implement strict physical separation of pre- and post-PCR areas, use aerosol-resistant filter tips, decontaminate surfaces with UV irradiation or bleach, and include negative controls (extraction blanks) in every run [39].
- Common Sources: Be aware of "kitome" contamination (background DNA in reagents), cross-sample carryover, and amplicon contamination from previous PCRs [39].
For chemogenomics beginners, mastering sample preparation and nucleic acid extraction is the first and most vital investment in a successful NGS research program. By rigorously adhering to protocols that prioritize the yield, purity, and integrity of genetic material, researchers lay a solid foundation for the subsequent steps of library preparation, sequencing, and data analysis [35] [5]. A disciplined approach at this initial stage, including meticulous quality control and contamination prevention, will pay substantial dividends in the form of reliable, high-quality genomic data, ultimately accelerating the discovery of novel biological insights and therapeutic targets [40].
In the context of a chemogenomics research pipeline, next-generation sequencing (NGS) provides powerful tools for understanding compound-genome interactions. Library preparation represents a critical early step that fundamentally determines the quality and reliability of all subsequent data analysis. This technical guide focuses on two core processes within library preparation: DNA fragmentation, which creates appropriately sized genomic fragments, and adapter ligation, which outfits these fragments for sequencing. Proper execution of these steps ensures maximal information recovery from precious chemogenomic samples, whether screening compound libraries against genomic targets or investigating drug-induced genomic changes.
The following workflow diagram illustrates the complete process from purified DNA to a sequence-ready library, highlighting the fragmentation and adapter ligation steps within the broader context.
DNA Fragmentation Strategies
The initial step in NGS library preparation involves fragmenting purified DNA into sizes optimized for the sequencing platform and application. The method of fragmentation significantly impacts library complexity, coverage uniformity, and potential for sequence bias, all critical considerations for robust chemogenomic assays [41] [42].
Comparison of Fragmentation Methods
Table 1: Quantitative Comparison of DNA Fragmentation Methods
| Method | Typical Input DNA | Fragment Size Range | Hands-On Time | Key Advantages | Primary Limitations |
|---|---|---|---|---|---|
| Acoustic Shearing (Covaris) | 1–5 μg [41] | 100–5,000 bp [42] | Moderate | Unbiased fragmentation, consistent fragment sizes [41] | Specialized equipment cost, potential for sample overheating [41] |
| Sonication (Probe-based) | 1–5 μg [41] | 300–600 bp [41] | Moderate | Simple methodology, focused energy [41] | High contamination risk, requires optimization cycles [41] |
| Nebulization | Large input required [41] | Varies with pressure | Low | Simple apparatus | High sample loss, low recovery [41] |
| Enzymatic Digestion | As low as 1 ng [41] [43] | 200–600 bp | Low | Low input requirement, streamlined workflow, automation-friendly [41] [43] | Potential sequence bias, artifactual indels [42] [43] |
| Tagmentation (Transposon-Based) | 1 ng–1 μg [44] [45] | 300–1,500 bp [45] | Very Low | Fastest workflow, simultaneous fragmentation and adapter tagging [41] [42] | Fixed fragment size based on bead chemistry [43] |
Technical Considerations for Fragmentation
For chemogenomics applications involving limited compound-treated samples, input DNA requirements become a paramount concern. While traditional mechanical shearing methods often require microgram quantities of input DNA, modern enzymatic and tagmentation approaches reliably function with 1 ng or less, enabling sequencing from rare cell populations or biopsy material [45] [43].
The desired insert size (the genomic DNA between adapters) must align with both sequencing instrumentation limitations and research objectives. For example, exome sequencing typically utilizes ~250 bp inserts to match average exon size, while de novo assembly projects benefit from longer inserts (1 kb or more) to scaffold genomic regions effectively [42]. Recent studies demonstrate that libraries with insert fragments longer than the cumulative sum of both paired-end reads avoid read overlap, yielding more informative data and significantly improved genome coverage [43].
Post-fragmentation size selection represents a critical quality control step, typically achieved through magnetic bead-based cleanups or agarose gel purification. This process removes adapter dimers (self-ligated adapters without insert) and refines library size distribution, preventing the sequencing of unproductive fragments that consume valuable flow cell space [42].
End Repair and A-Tailing
Following fragmentation, DNA fragments typically contain a mixture of 5' and 3' overhangs that are incompatible with adapter ligation. The end repair process converts these heterogeneous ends into uniform, ligation-ready termini through a series of enzymatic reactions [41].
The end conversion process involves four coordinated enzymatic activities working sequentially or simultaneously in optimized buffer systems [41]:
- 5'→3' Polymerase Activity (T4 DNA polymerase or Klenow fragment): Fills in 5' overhangs
- 3'→5' Exonuclease Activity (T4 DNA polymerase): Removes 3' overhangs to create blunt ends
- 5' Phosphorylation (T4 polynucleotide kinase): Adds phosphate groups to 5' ends to enable ligation
- 3' A-Tailing (Klenow fragment exo- or Taq polymerase): Adds single adenine bases to 3' ends
The A-tailing step is particularly crucial for Illumina systems, as it prevents concatemerization and facilitates T-A cloning with complementary T-overhang adapters [41]. Modern commercial kits typically combine these reactions into a single-tube protocol to minimize sample loss and processing time [41].
Adapter Ligation
Adapter ligation outfits fragmented genomic DNA with the necessary sequences for amplification and sequencing. Adapters are short, double-stranded oligonucleotides containing several key elements [41] [46].
Adapter Design and Function
The standard Y-shaped adapter design includes [46]:
- Sequencing binding sites: Complementary to flow cell oligos and sequencing primers
- Index sequences (barcodes): Enable sample multiplexing by marking fragments from different libraries
- Complementary oligos at ends: Facilitate hybridization for bridge amplification
During ligation, a stoichiometric excess of adapters relative to DNA fragments (typically ~10:1 molar ratio) drives the reaction efficiency while minimizing the formation of adapter-adapter dimers [42]. Proper optimization of this ratio is essential, as excessive adapters promote dimer formation that can dominate subsequent amplification [42].
Advanced Ligation Technologies
Bead-linked transposome tagmentation represents a significant innovation that combines fragmentation and adapter incorporation into a single step. This technology uses transposase enzymes loaded with adapter sequences that simultaneously fragment DNA and insert the adapters, dramatically reducing processing time [44]. Modern implementations feature "on-bead" tagmentation where transposomes are covalently linked to magnetic beads, improving workflow consistency and enabling normalization without additional quantification steps [44].
Unique Dual Indexing (UDI) strategies have become essential for detecting and correcting sample index cross-talk in multiplexed sequencing, particularly crucial in chemogenomics applications where sample identity must be preserved throughout compound screening campaigns [44].
The Scientist's Toolkit: Essential Reagents and Solutions
Table 2: Key Research Reagent Solutions for Fragmentation and Adapter Ligation
| Reagent Category | Specific Examples | Function in Workflow |
|---|---|---|
| Fragmentation Enzymes | Non-specific endonuclease cocktails (Fragmentase), Transposase (Nextera) | Cleaves DNA into appropriately sized fragments for sequencing [42] [43] |
| End-Repair Enzymes | T4 DNA Polymerase, Klenow Fragment, T4 Polynucleotide Kinase | Converts heterogeneous fragment ends into uniform, blunt-ended, phosphorylated termini [41] [42] |
| A-Tailing Enzymes | Klenow Fragment (exo-), Taq DNA Polymerase | Adds single 'A' base to 3' ends, enabling efficient TA-cloning with adapters [41] [42] |
| Ligation Reagents | T4 DNA Ligase, PEG-enhanced ligation buffers | Catalyzes the formation of phosphodiester bonds between DNA fragments and adapter sequences [42] |
| Specialized Adapters | Illumina-compatible adapters, Unique Dual Index (UDI) adapters | Provides platform-specific sequences for cluster generation and sequencing, enables sample multiplexing [44] [45] |
| Size Selection Beads | SPRIselect, AMPure XP magnetic beads | Purifies ligated products and selects for desired fragment sizes while removing adapter dimers [42] |
| Commercial Library Prep Kits | Illumina DNA Prep, NEBNext Ultra II FS, KAPA HyperPlus | Provides optimized, standardized reagent mixtures for efficient library construction [45] [43] |
Fragmentation and adapter ligation represent foundational steps in constructing high-quality NGS libraries for chemogenomics research. The choice between mechanical, enzymatic, and tagmentation-based fragmentation approaches involves trade-offs between input requirements, workflow simplicity, and potential for sequence bias. Similarly, proper execution of end-repair and adapter ligation ensures maximal library complexity and sequencing efficiency. By understanding these core processes and the available reagent solutions, researchers can optimize library preparation for diverse chemogenomic applications, from targeted compound screening to whole-genome analysis of drug response mechanisms.
Target enrichment is a fundamental preparatory step in targeted next-generation sequencing (NGS) that enables researchers to selectively isolate and sequence specific genomic regions of interest while excluding irrelevant portions of the genome [47]. This process is particularly valuable in chemogenomics and drug development research, where investigating specific gene panels, exomes, or disease-related mutations is more efficient than whole-genome sequencing [48] [49]. By focusing sequencing power on predetermined targets, enrichment methods significantly reduce costs, simplify data analysis, and allow for deeper sequencing coverage—enhancing the ability to detect rare variants that are crucial for understanding disease mechanisms and drug responses [50] [51].
The two predominant techniques for target enrichment are hybridization capture and amplicon-based sequencing [49] [47]. Each method employs distinct molecular mechanisms to enrich target sequences and offers unique advantages and limitations. The choice between these methods directly impacts experimental outcomes, including data quality, variant detection sensitivity, and workflow efficiency—making selection critical for research success [52].
Amplicon-Based Target Enrichment
Fundamental Principles and Workflow
Amplicon-based enrichment, also known as PCR-based enrichment, utilizes the polymerase chain reaction to selectively amplify genomic regions of interest [49] [50]. This method employs designed primers that flank target sequences, enabling thousands-fold amplification of these specific regions through multiplex PCR [49]. The resulting amplification products (amplicons) are then converted into sequencing libraries by adding platform-specific adapters and sample barcodes [47].
A key strength of this approach is its ability to work effectively with limited and challenging sample types. The method's high amplification efficiency makes it particularly suitable for samples with low DNA quantity or quality, including formalin-fixed paraffin-embedded (FFPE) tissues and liquid biopsies [49] [53].
Key Methodological Variations
Several advanced PCR technologies have been adapted for NGS target enrichment, enhancing its applications:
- Long-Range PCR: Utilizes specialized polymerases to amplify longer DNA fragments (3-20 kb), reducing the number of primers needed and improving amplification uniformity [49].
- Droplet PCR: Compartmentalizes PCR reactions into millions of droplets, functioning as microreactors that minimize primer interference and ensure uniform target enrichment [49].
- Anchored Multiplex PCR: Employs a single target-specific primer combined with a universal primer, enabling target enrichment without prior knowledge of both flanking sequences—particularly valuable for detecting novel gene fusions [49].
- COLD-PCR: Enriches variant-containing DNA strands by exploiting the lower melting temperature of heteroduplexes (wild-type/variant DNA), improving detection of low-frequency mutations [49].
- Microfluidics-Based PCR: Uses nanofluidic chips for parallel amplification of multiple samples with minimal reagent consumption, offering automation capabilities [49].
Experimental Protocol: Multiplex PCR Amplicon Sequencing
Procedure:
- Primer Design: Design primers flanking all targeted regions using specialized tools (e.g., Ion AmpliSeq Designer) [53].
- Library Preparation:
- Purification: Clean up the library using magnetic beads [53].
- Sequencing: Pool multiple barcoded libraries for simultaneous sequencing [47].
Key Considerations:
- Primer design must minimize interactions in multiplex reactions [49].
- PCR conditions should ensure uniform amplification across all targets [49].
- Incorporation of unique molecular identifiers helps identify PCR duplicates [52].
Hybridization Capture-Based Target Enrichment
Fundamental Principles and Workflow
Hybridization capture enriches target sequences using biotinylated oligonucleotide probes (baits) that are complementary to regions of interest [49] [51]. The standard workflow begins with genomic DNA fragmentation via acoustic shearing or enzymatic cleavage, followed by end-repair and ligation of platform-specific adapters to create a sequencing library [49] [51]. The adapter-ligated fragments are then denatured and hybridized with the biotinylated probes. Streptavidin-coated magnetic beads capture the probe-bound targets, which are subsequently isolated from non-hybridized DNA through washing steps [50] [51]. The enriched targets are then amplified and prepared for sequencing.
This method can utilize either DNA or RNA probes, with RNA probes generally offering higher hybridization specificity and stability, though DNA probes are more commonly used due to better handling stability [49].
Probe Design Strategies
Effective probe design is critical for hybridization capture performance. Several specialized strategies address specific genomic challenges:
- GC-Rich Region Capture: Designing additional probes with adjusted lengths and isothermal properties improves coverage of GC-rich regions that are challenging for PCR-based methods [52].
- Tiling Probes: Positioning overlapping probes across repetitive regions (e.g., internal tandem duplications in FLT3) enables sequencing through these difficult areas [52].
- Variant-Tolerant Design: Long oligonucleotide baits (typically 100-120 nt) can tolerate sequence variations, ensuring equal capture of all alleles in heterogeneous samples [52].
Experimental Protocol: Solution-Based Hybrid Capture
Procedure:
- DNA Fragmentation: Fragment 50-500 ng of genomic DNA by sonication or enzymatic treatment [49] [52].
- Library Preparation:
- Hybridization:
- Capture and Washing:
- Elution and Amplification: Elute captured targets from beads and perform limited-cycle PCR to generate the final sequencing library [49].
Key Considerations:
- Input DNA quantity and quality significantly impact capture efficiency [52].
- Hybridization time and temperature must be optimized for specific probe sets [52].
- Enzymatic DNA repair steps can improve performance with FFPE samples [52].
Comparative Analysis: Hybrid Capture vs. Amplicon-Based Methods
Technical and Performance Comparison
Table 1: Comprehensive Comparison of Target Enrichment Methods
| Feature | Amplicon-Based Enrichment | Hybridization Capture |
|---|---|---|
| Workflow Complexity | Simpler, fewer steps [48] [50] | More complex, multiple steps [48] [50] |
| Hands-on Time | Shorter (several hours) [48] [52] | Longer (can require 1-3 days) [48] [52] |
| Cost Per Sample | Generally lower [48] [50] | Higher due to additional reagents [48] [50] |
| Input DNA Requirements | Lower (1-100 ng) [47] [50] [53] | Higher (typically 50-500 ng) [50] [52] |
| Number of Targets | Limited (usually <10,000 amplicons) [48] [47] | Virtually unlimited [48] [47] |
| On-Target Rate | Higher (due to primer specificity) [48] [50] | Variable, dependent on probe design [48] [50] |
| Coverage Uniformity | Lower (subject to PCR bias) [50] [52] | Higher uniformity [48] [50] |
| False Positive Rate | Higher risk of amplification errors [50] [52] | Lower noise and fewer false positives [48] [52] |
| Variant Detection Sensitivity | <5% variant allele frequency [47] | <1% variant allele frequency [47] |
| Ability to Detect Novel Variants | Limited by primer design [52] | Excellent for novel variant discovery [51] [52] |
Table 2: Application-Based Method Selection
| Application | Recommended Method | Rationale |
|---|---|---|
| Small Gene Panels (<50 genes) | Amplicon Sequencing [50] [51] | Cost-effective with simpler workflow for limited targets [50] |
| Large Panels/Exome Sequencing | Hybridization Capture [50] [51] | Scalable to thousands of targets with better uniformity [50] |
| Challenging Samples (FFPE, cfDNA) | Both (with considerations) [52] | Amplicon works with lower input; Hybridization better for degraded DNA [52] |
| Rare Variant Detection | Hybridization Capture [47] [50] | Lower false positives and higher sensitivity for low-frequency variants [52] |
| CRISPR Validation | Amplicon Sequencing [48] [47] | Ideal for specific edit verification with simple design [48] |
| Variant Discovery | Hybridization Capture [51] [52] | Superior for identifying novel variants without prior sequence knowledge [51] |
| Homologous Regions | Amplicon Sequencing [53] | Primer specificity can distinguish highly similar sequences [53] |
| GC-Rich Regions | Hybridization Capture [52] | Better coverage uniformity in challenging genomic contexts [52] |
Visual Comparison of Workflows
Diagram 1: Target Enrichment Workflow Comparison. The amplicon method (yellow) uses a streamlined PCR-based approach, while hybridization capture (green) involves more steps including fragmentation and specific capture of targets.
Impact of Genomic Context on Method Performance
GC-Rich Regions: Hybridization capture demonstrates superior performance in sequencing GC-rich regions (e.g., CEBPA gene with up to 90% GC content) due to flexible bait design that can overcome amplification challenges faced by PCR-based methods [52].
Repetitive Sequences and Tandem Duplications: Amplicon methods struggle with repetitive regions due to primer design constraints, while hybridization capture can employ tiling strategies with overlapping probes to sequence through repeats [52].
Homologous Regions: Amplicon sequencing can better distinguish between highly similar sequences (e.g., PTEN gene and its pseudogene PTENP1) through precise primer positioning, whereas hybridization may capture both homologous regions non-specifically [53].
Variant-Rich Regions: Hybridization capture tolerates sequence variations within probe regions better than amplicon methods, where variants in primer binding sites can cause allelic dropout or biased amplification [52].
The Scientist's Toolkit: Essential Research Reagents
Table 3: Key Research Reagents for Target Enrichment
| Reagent/Category | Function | Example Products/Suppliers |
|---|---|---|
| Target Enrichment Probes | Sequence-specific baits for hybridization capture | Agilent SureSelect, Illumina Nextera, IDT xGen [54] [51] [55] |
| Multiplex PCR Primers | Amplify multiple target regions simultaneously | Thermo Fisher Ion AmpliSeq, Qiagen GeneRead, IDT Panels [49] [53] |
| Library Preparation Kits | Fragment DNA, add adapters, and prepare sequencing libraries | Illumina DNA Prep, OGT SureSeq, Thermo Fisher Ion Torrent [51] [52] [53] |
| DNA Repair Enzymes | Fix damage in challenging samples (e.g., FFPE) | OGT SureSeq FFPE Repair Mix [52] |
| Capture Beads | Magnetic separation of biotinylated probe-target complexes | Streptavidin-coated magnetic beads [50] [51] |
| Target Enrichment Panels | Pre-designed sets targeting specific diseases or pathways | Cancer panels, inherited disease panels, pharmacogenomic panels [53] [55] |
Method Selection Framework for Chemogenomics Research
Decision Factors and Guidelines
Selecting the appropriate enrichment method requires careful consideration of research objectives and practical constraints:
Choose Amplicon Sequencing When:
- Targeting a small number of genes (<50) or well-defined regions [50] [51]
- Working with limited DNA input (1-10 ng) from samples like fine needle aspirates or liquid biopsies [53]
- Budget and time constraints are significant factors [48] [50]
- Detecting known germline variants, SNPs, or indels [48] [47]
- Validating CRISPR edits or screening experiments [48] [50]
Choose Hybridization Capture When:
- Targeting large gene panels (>50 genes) or whole exomes [50] [51]
- Comprehensive variant discovery including novel variants is required [51] [52]
- Studying complex genomic regions with high GC content or repeats [52]
- Highest sensitivity for low-frequency somatic variants is needed [47] [50]
- Sample quality permits sufficient DNA input (≥50 ng) [50] [52]
Emerging Trends and Future Directions
The target enrichment landscape continues to evolve with several promising developments:
- Automation and Workflow Integration: Streamlined protocols reducing hybridization capture from 2-3 days to single-day workflows through enzymatic fragmentation and reduced hybridization times [52].
- Molecular Barcoding: Unique identifiers that enable accurate detection of low-frequency variants and computational removal of PCR duplicates [52].
- Advanced Probe Design: AI-driven approaches and novel chemistries improving specificity and reducing off-target binding [55].
- CRISPR-Based Enrichment: Emerging methods leveraging CRISPR technology for highly precise target capture [55].
- Multimodal Approaches: Integrated solutions combining benefits of both methods, such as Illumina's bead-linked transposome chemistry with hybrid capture [51].
For chemogenomics researchers, these advancements promise more robust, efficient, and cost-effective target enrichment solutions that will accelerate drug discovery and personalized medicine applications.
Hybrid capture and amplicon-based methods represent complementary approaches to NGS target enrichment, each with distinct strengths and optimal applications. Hybridization capture excels in comprehensive profiling, novel variant discovery, and large-scale projects, while amplicon sequencing offers simplicity, speed, and cost-efficiency for focused investigations. Understanding their technical differences, performance characteristics, and practical considerations enables researchers to select the most appropriate method for specific chemogenomics applications—ultimately enhancing the quality and impact of genomic research in drug development.
Within the established next-generation sequencing (NGS) workflow—comprising nucleic acid extraction, library preparation, sequencing, and data analysis—the sequencing step itself is where the genetic code is deciphered [35] [5]. For researchers in chemogenomics and drug development, understanding the technical intricacies of this step is crucial for interpreting data quality and designing robust experiments. This phase is fundamentally enabled by two core processes: cluster generation, which clonally amplifies the prepared library fragments, and sequencing-by-synthesis (SBS), the biochemical reaction that determines the base-by-base sequence [38] [56]. These processes occur on the sequencer's flow cell, a microfluidic chamber that serves as the stage for massively parallel sequencing, allowing millions to billions of fragments to be read simultaneously [56]. This technical guide provides an in-depth examination of these core mechanisms, framed within the practical context of a modern research laboratory.
The Principle of Sequencing-by-Synthesis (SBS)
Sequencing-by-Synthesis is the foundational chemistry employed by Illumina platforms, characterized by the use of fluorescently labeled nucleotides with reversible terminators [56]. This approach allows for the stepwise incorporation of a single nucleotide per cycle across millions of templates in parallel.
The core SBS cycle consists of four key steps for every single base incorporation:
- Nucleotide Incorporation: A single type of fluorescently labeled, terminator-bound dNTP is introduced to the flow cell and incorporated by DNA polymerase into the growing complementary DNA strand. The reversible terminator ensures only one base is added per cluster per cycle [38] [56].
- Image Acquisition: Following incorporation, the flow cell is imaged using lasers. The fluorescent dye attached to the incorporated nucleotide emits a specific wavelength of light, which is captured by a camera. The color of the fluorescence identifies the base that was added (A, T, C, or G) [38] [56].
- Dye and Terminator Cleavage: The fluorescent dye and the reversible terminator are chemically cleaved from the nucleotide in a single reaction, restoring the 3'-OH group and enabling the incorporation of the next nucleotide [56].
- Cycle Repetition: This process of incorporation, imaging, and cleavage is repeated "n" times to achieve a read length of "n" bases [38].
Evolution of SBS Chemistry: 2-Channel Systems
While the original SBS chemistry used four distinct fluorescent dyes (4-channel), a significant evolution is 2-channel SBS technology, used in systems like the NextSeq 1000/2000 and NovaSeq X [57]. This method simplifies optical detection by using only two fluorescent dyes, requiring only two images per cycle instead of four. In a typical implementation using red and green dyes, the base identity is determined as follows:
- Red signal only is interpreted as a C base.
- Green signal only is interpreted as a T base.
- Both red and green signals (appearing as yellow) are interpreted as an A base.
- No signal is interpreted as a G base [57].
This advancement accelerates sequencing and data processing times while maintaining the high data accuracy characteristic of Illumina SBS technology [57].
Cluster Generation by Bridge Amplification
Prior to the sequencing reaction, the library fragments must be clonally amplified to create signal intensities strong enough for optical detection. On Illumina platforms, this is achieved through bridge amplification [38] [46].
Table 1: Key Stages of Bridge Amplification and Cluster Generation
| Stage | Process Description | Outcome |
|---|---|---|
| 1. Template Binding | The single-stranded, adapter-ligated library fragments are flowed onto the flow cell, where they bind complementarily to oligonucleotide lawns attached to the surface [56] [46]. | Library fragments are immobilized on the flow cell. |
| 2. Bridge Formation | The bound template bends over and "bridges" to the second type of complementary oligo on the flow cell surface [38] [46]. | A double-stranded bridge is formed after synthesis of the complementary strand. |
| 3. Denaturation and Replication | The double-stranded bridge is denatured, resulting in two single-stranded copies tethered to the flow cell. This process is repeated for many cycles [38] [56]. | Exponential amplification of each single template molecule occurs. |
| 4. Cluster Formation | After multiple cycles of bridge amplification, each original library fragment forms a clonal cluster containing thousands of identical copies [56]. | Millions of unique clusters are generated across the flow cell, each representing one original library fragment. |
| 5. Strand Preparation | The reverse strands are cleaved and washed away, and the forward strands are ready for sequencing [46]. | Clusters consist of single-stranded templates for the subsequent SBS reaction. |
The following diagram illustrates the bridge amplification process that leads to cluster generation.
Detailed Experimental Protocol for the Sequencing Run
The following section provides a detailed, step-by-step methodology for executing the sequencing step on a typical Illumina instrument, such as the NovaSeq 6000 or NextSeq 2000 systems.
Pre-Run Preparation and Quality Control
- Library Quantification and Normalization: Quantify the final prepared library using a fluorometric method (e.g., Qubit) and validate library fragment size distribution using an instrument such as the Bioanalyzer or TapeStation. Accurate quantification is critical for optimal cluster density [38].
- Library Dilution and Denaturation: Dilute the library to the precise concentration recommended for the specific sequencing kit and flow cell type. Denature the diluted library with sodium hydroxide to create single-stranded DNA.
- Library Pool Loading: Combine the denatured library with the appropriate sequencing reagents, which include DNA polymerase and nucleotides. Load this mixture into the designated reservoir on the sequencing cartridge or the instrument itself.
On-Instrument Workflow
- Cluster Generation (cBot or Onboard): The instrument automatically loads the library onto the flow cell. Bridge amplification then occurs, either on a separate cBot system (for some older models) or integrated directly into the sequencer's run, as in modern systems like the NextSeq 2000. This process typically takes 1-6 hours.
- Priming and SBS Initiation: Once clusters are generated, the sequencing primers are annealed to the templates. The instrument initiates the SBS cycle.
- Automated SBS Cycling: The instrument performs the repetitive SBS cycle:
- Flush and Scan: The flow cell is flushed with one of the four fluorescently labeled, reversibly terminated nucleotides.
- Image Capture: After incorporation, the flow cell is imaged. For a 2-channel system, two images are taken per cycle; for a 4-channel system, four images are taken [57].
- Cleavage: The flow cell is flushed with a chemical reagent to cleave the fluorescent dye and terminator, resetting the 3' end for the next incorporation.
- This cycle repeats for the predetermined number of cycles (e.g., 150 cycles for 2x150 bp paired-end reads).
- Primary Data Analysis (Onboard): As the run proceeds, the instrument's software performs real-time base calling, assigning a nucleobase identity and a quality score (Q-score) to each base in every cluster [56].
Performance Metrics and Data Output
The performance of the sequencing run is evaluated using several key metrics. Understanding these is essential for assessing data quality and troubleshooting.
Table 2: Key Performance Metrics and Output for Modern Sequencing Systems
| Metric | Description | Typical Value / Range (Varies by Instrument) |
|---|---|---|
| Read Length | The number of bases sequenced from a fragment. Configurable as single-end (SE) or paired-end (PE). | 50 - 300 bp (PE common for WGS) [3] [46] |
| Total Output per Flow Cell | The total amount of sequence data generated in a single run. | 20 Gb (MiSeq) to 16 Tb (NovaSeq X Plus) [3] [57] |
| Cluster Density | The number of clusters per mm² on the flow cell. Too high causes overlap; too low wastes capacity. | Optimal range is instrument-specific (e.g., 170-220 K/mm² for some patterned flow cells). |
| Q30 Score (or higher) | The percentage of bases with a base call accuracy of 99.9% or greater. A key industry quality threshold. | >75% is typical; >80% is good for most applications [3]. |
| Error Rate | The inherent error rate of the sequencing technology, which is context-specific. | ~0.1% for Illumina SBS [3]. |
| Run Time | The total time from sample loading to data availability. | 4 hours (MiSeq i100) to ~44 hours (NovaSeq X, 10B read WGS) [3] [57]. |
The Scientist's Toolkit: Essential Research Reagents
The following table details the key reagents and materials required for the sequencing step, with an explanation of their critical function in the workflow.
Table 3: Essential Research Reagents and Materials for Sequencing
| Reagent / Material | Function |
|---|---|
| Flow Cell | A glass slide with microfluidic channels coated with oligonucleotides complementary to the library adapters. It is the physical substrate where cluster generation and sequencing occur [56]. |
| SBS Kit / Cartridge | Contains the core biochemical reagents: fluorescently labeled, reversibly terminated dNTPs (dATP, dCTP, dGTP, dTTP) and a high-fidelity DNA polymerase [56]. |
| Cluster Generation Reagents | Contains nucleotides and enzymes required for the bridge amplification process. These are often included in the sequencing kit for integrated workflows. |
| Buffer Solutions | Various wash and storage buffers for maintaining pH, ionic strength, and enzyme stability throughout the long sequencing run. |
| Custom Primers | Sequencing primers designed to bind to the adapter sequences on the library fragments, initiating the SBS reaction [56] [46]. |
Cluster generation and Sequencing-by-Synthesis represent the engineered core of the NGS workflow, transforming prepared nucleic acid libraries into digital sequence data. For the chemogenomics researcher, a deep technical understanding of these processes—from the physics of bridge amplification and the chemistry of reversible terminators to the practical interpretation of quality metrics—is indispensable. This knowledge empowers informed decisions on experimental design, platform selection, and data validation, ultimately ensuring the generation of high-quality, reliable genomic data to drive discovery in drug development and molecular science.
Next-generation sequencing (NGS) data analysis represents a critical phase in chemogenomics research, transforming raw digital signals into actionable biological insights for drug discovery. This technical guide delineates the multi-stage bioinformatics pipeline required to convert sequencer output into comprehensible results, focusing on applications for target identification and validation. The process encompasses primary, secondary, and tertiary analytical phases, each with distinct computational requirements, methodological approaches, and quality control metrics essential for reliable interpretation in pharmaceutical development contexts.
In chemogenomics, NGS facilitates the discovery of novel drug targets and mechanisms of action by comprehensively profiling genomic, transcriptomic, and epigenomic alterations. The data analysis workflow systematically converts raw base calls into biological insights through a structured pipeline [5]. This transformation occurs through three principal analytical stages: primary analysis (quality assessment and demultiplexing), secondary analysis (alignment and variant calling), and tertiary analysis (biological interpretation and pathway analysis) [21]. The massive scale of NGS data—often comprising terabytes of information containing millions to billions of sequencing reads—demands robust computational infrastructure and specialized bioinformatic tools [28]. For drug development professionals, understanding this pipeline is crucial for deriving meaningful conclusions about compound-target interactions, mechanism elucidation, and biomarker discovery.
Primary Analysis: From Instrument Signals to Quality-Assessed Reads
Primary analysis constitutes the initial quality assessment phase where raw electrical signals from sequencing instruments are converted into base calls with associated quality scores [21].
Raw Data Formats and Conversion
Sequencing platforms generate proprietary raw data files: Illumina systems produce BCL (Binary Base Call) files containing raw intensity measurements and preliminary base calls [28]. These binary files are converted into FASTQ format—the universal, text-based standard for storing biological sequences and their corresponding quality scores—through a process called "demultiplexing" that separates pooled samples using their unique index sequences [21]. The conversion from BCL to FASTQ format is typically managed by Illumina's bcl2fastq Conversion Software [21].
Quality Metrics and Assessment
The FASTQ format encapsulates both sequence data and quality information in a structured format [28]:
- Sequence Identifier: Instrument-specific data including flow cell coordinates
- Nucleotide Sequence: Raw base calls (A, T, G, C, N for ambiguous)
- Quality Score String: ASCII characters representing Phred-scaled quality values
Critical quality metrics assessed during primary analysis include [21]:
Table 1: Key Quality Control Metrics in Primary NGS Analysis
| Metric | Definition | Optimal Threshold | Interpretation |
|---|---|---|---|
| Phred Quality Score (Q) | Probability of incorrect base call: Q = -10log₁₀(P) | Q ≥ 30 | <0.1% error rate; base call accuracy >99.9% |
| Cluster Density | Density of clonal clusters on flow cell | Varies by platform | Optimal density ensures signal purity |
| % Pass Filter (%PF) | Percentage of clusters passing filtering | >80% | Indicates optimal clustering |
| % Aligned | Percentage aligned to reference genome | Varies by application | Measured using controls (e.g., PhiX) |
| Error Rate | Frequency of incorrect base calls | Platform-dependent | Based on internal controls |
Tools such as FastQC provide comprehensive quality assessment through visualizations of per-base sequence quality, sequence duplication levels, adapter contamination, and GC content [58]. Statistical guidelines derived from large-scale repositories like ENCODE provide condition-specific quality thresholds for different experimental applications (e.g., RNA-seq, ChIP-seq) [58].
Secondary Analysis: Sequence Alignment and Variant Calling
Secondary analysis transforms quality-filtered sequences into genomic coordinates and identifies molecular variants, serving as the foundation for biological interpretation [21].
Read Preprocessing and Cleaning
Before alignment, raw sequencing reads undergo cleaning procedures to remove technical artifacts:
- Adapter Trimming: Removal of sequencing adapter sequences
- Quality Trimming: Exclusion of low-quality bases (typically Q<30) or read portions
- Read Filtering: Discarding of excessively short reads or potential contaminants
- Duplicate Removal: Elimination of PCR-amplified duplicates, potentially using Unique Molecular Identifiers (UMIs) to distinguish biological duplicates from technical replicates [21]
For RNA sequencing data, additional preprocessing steps may include strand-specificity determination, ribosomal RNA contamination assessment, and correction of sequence biases introduced during library preparation [21].
Sequence Alignment and Mapping
The alignment process involves matching individual sequencing reads to reference genomes using specialized algorithms that balance computational efficiency with mapping accuracy [21]. Common alignment tools include:
- BWA (Burrows-Wheeler Aligner) for DNA sequencing
- Bowtie 2 and TopHat for RNA sequencing
- STAR for splice-aware RNA-seq alignment
The output of alignment is typically stored in BAM (Binary Alignment/Map) format, a compressed, efficient representation of genomic coordinates and alignment information [28]. The SAM (Sequence Alignment/Map) format provides a human-readable text alternative, while CRAM offers superior compression by storing only differences from a reference genome [28].
Visualization tools such as the Integrative Genomic Viewer (IGV) enable researchers to inspect alignments visually, observe read pileups, and identify potential variant regions [21].
Variant Discovery and Calling
Variant identification involves detecting positions where the sequenced sample differs from the reference genome. The statistical confidence in variant calling increases with sequencing depth (coverage), analogous to the probability of correctly identifying a coin through repeated flips [59].
Table 2: Variant Types and Detection Methods
| Variant Type | Definition | Detection Signature | Common Tools |
|---|---|---|---|
| SNPs | Single nucleotide polymorphisms | ~50% of reads show alternate base in heterozygotes | GATK, SAMtools |
| Indels | Small insertions/deletions | Gapped alignments in reads | GATK, Dindel |
| Copy Number Variations (CNVs) | Large deletions/duplications | Abnormal read depth across regions | CNVkit, ExomeDepth |
| Structural Variants | Chromosomal rearrangements | Split reads, discordant pair mappings | Delly, Lumpy |
The variant calling process generates VCF (Variant Call Format) files, which catalog genomic positions, reference and alternate alleles, quality metrics, and functional annotations [28]. For expression analyses, count matrices (tab-delimited files) quantify gene-level expression across samples [21].
Tertiary Analysis: Biological Interpretation in Chemogenomics
Tertiary analysis represents the transition from genomic coordinates to biological meaning, particularly focusing on applications relevant to drug discovery and development [60].
Variant Annotation and Prioritization
In chemogenomics, variant annotation adds biological context to raw variant calls through:
- Functional Impact Prediction: Assessing consequences on protein function (e.g., SIFT, PolyPhen-2)
- Population Frequency Filtering: Identifying rare variants against databases (gnomAD, 1000 Genomes)
- Pathogenicity Prediction: Integrating clinical annotations (ClinVar, COSMIC)
- Pharmacogenomic Markers: Linking variants to drug response associations [61]
Advanced interpretation platforms leverage artificial intelligence to automate variant prioritization based on customized criteria and literature evidence [60].
Actionability Assessment in Oncology
For oncology applications, the ESMO Scale of Clinical Actionability for Molecular Targets (ESCAT) provides a structured framework for classifying genomic alterations based on clinical evidence levels [61]:
Table 3: ESMO Classification for Genomic Alterations
| Tier | Clinical Evidence Level | Implication for Treatment |
|---|---|---|
| I | Alteration-drug match associated with improved outcome in clinical trials | Validated for clinical use |
| II | Alteration-drug match associated with antitumor activity, magnitude unknown | Investigational with evidence |
| III | Evidence from other tumor types or similar alterations | Hypothetical efficacy |
| IV | Preclinical evidence of actionability | Early development |
| V | Associated with objective response without meaningful benefit | Limited clinical value |
Molecular tumor boards integrate these classifications with patient-specific factors to guide therapeutic decisions, particularly for off-label drug use [61].
Advanced Analytical Applications in Drug Discovery
Chemogenomics leverages multiple NGS applications for comprehensive drug-target profiling:
- Tumor Mutational Burden (TMB) Calculation: Quantifying total mutation load as a biomarker for immunotherapy response [61]
- Microsatellite Instability (MSI) Detection: Identifying hypermutated phenotypes resulting from DNA repair deficiencies [61]
- Pathway Enrichment Analysis: Mapping alterations to biological pathways for mechanism elucidation
- Gene Expression Signatures: Developing transcriptomic profiles for drug sensitivity prediction
Enterprise-level interpretation solutions enable cohort analysis and biomarker discovery through integration with electronic health records and multi-omics datasets [60].
Bioinformatics Workflows and Computational Infrastructure
Robust, reproducible analysis requires structured workflow management and appropriate computational resources.
Workflow Management with Nextflow
Nextflow provides a domain-specific language for implementing portable, scalable bioinformatics pipelines [62]. Best practices include:
- Separating workflow logic from configuration parameters
- Implementing comprehensive help documentation
- Incorporating rich metadata tracking
- Using containerization for reproducible execution environments [63]
Below is the DOT language representation of a generalized NGS data analysis workflow:
Computational Requirements and Data Management
NGS data analysis demands substantial computational resources:
- Storage: Raw FASTQ files range from gigabytes to terabytes; compressed BAM files are 30-50% smaller
- Memory: Alignment and variant calling require significant RAM (32-256GB+)
- Processing: Multi-core high-performance computing systems for parallel processing
- Infrastructure Options: Local computing clusters, cloud-based solutions (AWS, Google Cloud), or hybrid approaches [21]
Effective data management strategies include implementing robust file organization systems, maintaining comprehensive metadata records, and ensuring secure data transfer protocols for large file volumes [63].
The Scientist's Toolkit: Essential Research Reagents and Computational Tools
Successful NGS data analysis requires both wet-lab reagents and bioinformatic tools integrated into a cohesive workflow.
Table 4: Essential Research Reagents and Computational Tools
| Category | Item | Function/Purpose |
|---|---|---|
| Wet-Lab Reagents | Library Preparation Kits | Fragment DNA/RNA and add adapters for sequencing |
| Unique Dual Indexes | Multiplex samples while minimizing index hopping | |
| Target Enrichment Probes | Isolate genomic regions of interest (e.g., exomes) | |
| Quality Control Assays | Assess nucleic acid quality before sequencing (e.g., Bioanalyzer) | |
| Bioinformatic Tools | FastQC | Quality control analysis of raw sequencing data [58] |
| BWA/Bowtie2 | Map sequencing reads to reference genomes [21] | |
| GATK | Variant discovery and genotyping in DNAseq data | |
| SAMtools/BEDTools | Manipulate and analyze alignment files [28] | |
| IGV | Visualize alignments and validate variants [21] | |
| Annovar/VEP | Annotate variants with functional information | |
| Nextflow | Orchestrate reproducible analysis pipelines [62] | |
| Reference Databases | GENCODE | Comprehensive reference gene annotation |
| gnomAD | Population frequency data for variant filtering | |
| ClinVar | Clinical interpretations of variants | |
| Drug-Gene Interaction Database | Curated drug-target relationships for chemogenomics |
The NGS data analysis pipeline represents a critical transformation point in chemogenomics research, where raw digital signals become biological insights with potential therapeutic implications. Through the structured progression from primary quality assessment to tertiary biological interpretation, researchers can extract meaningful patterns from complex genomic data. The increasing accessibility of automated analysis platforms and standardized workflows makes sophisticated genomic analysis feasible for drug development teams without extensive bioinformatics expertise. However, appropriate quality control, statistical rigor, and interdisciplinary collaboration remain essential for deriving reliable conclusions that can advance therapeutic discovery and precision medicine initiatives.
Optimizing Your NGS Results: Troubleshooting Common Pitfalls and Enhancing Efficiency
Addressing Sample Quality and Quantity Challenges
In chemogenomics and drug development, the integrity of next-generation sequencing (NGS) data is paramount for drawing meaningful biological conclusions. The challenges of sample quality and quantity represent the most significant technical hurdles at the outset of any NGS workflow, with implications that cascade through all subsequent analysis stages. Success in these initial steps ensures that the vast amounts of data generated are a true reflection of the underlying biology, rather than artifacts of a compromised preparation process. This guide provides an in-depth technical framework for researchers to navigate these challenges, detailing established methodologies and quality control metrics to ensure the generation of robust, reliable sequencing data from limited and sensitive sample types common in early-stage research.
Assessing Sample Quality and Quantity
The initial assessment of nucleic acids is a critical first step that determines the feasibility of the entire NGS project. Accurate quantification and purity evaluation prevent the wasteful use of expensive sequencing resources on suboptimal samples.
Quantification and Purity Analysis
The concentration and purity of extracted DNA or RNA must be rigorously determined before proceeding to library preparation. Relying on a single method can be misleading; a combination of techniques provides a more comprehensive assessment.
Table 1: Methods for Nucleic Acid Quantification and Purity Assessment
| Method | Principle | Information Provided | Optimal Values | Advantages/Limitations |
|---|---|---|---|---|
| UV Spectrophotometry (e.g., NanoDrop) | Measures UV absorbance at specific wavelengths [64] | Concentration (A260); Purity via A260/A280 and A260/A230 ratios [64] [65] | DNA: ~1.8; RNA: ~2.0 [64] [65] | Fast and requires small volume, but can overestimate concentration by detecting contaminants [65] |
| Fluorometry (e.g., Qubit) | Fluorescent dyes bind specifically to DNA or RNA [35] [65] | Accurate concentration of dsDNA or RNA [65] | N/A | Highly accurate quantification; not affected by contaminants like salts or solvents [65] |
| Automated Capillary Electrophoresis (e.g., Agilent Bioanalyzer, TapeStation) | Electrokinetic separation of nucleic acids by size [64] [65] | Concentration, size distribution, and integrity (e.g., RIN for RNA) [64] [65] | RNA Integrity Number (RIN): 1 (degraded) to 10 (intact) [64] | Assesses integrity and detects degradation; more expensive and requires larger sample volumes [64] [65] |
Integrity and Size Distribution
For RNA sequencing, integrity is non-negotiable. The RNA Integrity Number (RIN) provides a standardized score for RNA quality, where a high RIN (e.g., >8) indicates minimal degradation [64]. This is crucial for transcriptomic studies in chemogenomics, where degraded RNA can skew gene expression profiles and lead to incorrect interpretations of a compound's effect.
Practical Strategies for Quality and Quantity Challenges
When working with precious samples, such as patient biopsies or single cells, specific strategies must be employed to overcome limitations in quality and quantity.
Mitigating Low Input and PCR Bias
Amplification is often necessary for low-input samples, but it can introduce significant bias, such as PCR duplicates, which lead to uneven sequencing coverage [37].
- Experimental Solutions:
- Enzyme Selection: Use high-fidelity polymerases and specialized kits designed for high-sensitivity library preparation to minimize amplification bias [37] [65]. These kits are optimized for inputs as low as 0.2 ng [65].
- Maximize Library Complexity: The goal is to maximize the diversity of unique fragments in the library. This involves using sufficient starting material where possible and optimizing enzymatic reactions to favor representative amplification [37] [42].
- Computational Solutions:
- Duplicate Removal: After sequencing, bioinformatic tools like Picard MarkDuplicates or SAMTools can be used to identify and remove PCR duplicates, cleaning the data for downstream analysis [37].
Preventing Contamination
Contamination during sample preparation can lead to false positives and erroneous data.
- Sources and Solutions:
- Pre-Amplification Contamination: This is a primary risk when handling multiple samples in parallel. The solution is to establish a dedicated pre-PCR workspace, physically separated from post-PCR areas, and to use filtered pipette tips [37].
- Sample-Derived Contaminants: Biological samples can contain inhibitors like hemoglobin or polysaccharides. Using column-based purification systems effectively removes these contaminants, yielding purer nucleic acids [65].
- Reagent Contaminants: Chaotropic salts, alcohols, or phenol from extraction reagents can carry over and inhibit enzymatic steps in library prep. Careful purification and purity checks (A260/230 ratios) are essential to confirm their removal [65].
The Scientist's Toolkit: Essential Reagents and Kits
Selecting the appropriate tools for extraction and library preparation is vital for success, especially with challenging samples. The following table details key solutions.
Table 2: Research Reagent Solutions for NGS Sample Preparation
| Item Category | Specific Examples | Key Function | Application Notes |
|---|---|---|---|
| Nucleic Acid Extraction Kits | AMPIXTRACT Blood and Cultured Cell DNA Extraction Kit; EPIXTRACT Kits [65] | Rapid isolation of pure genomic DNA from various sample types (blood, urine, tissue, plasma) [65] | Effective with low input (as low as 1 ng); uses column-based purification to remove contaminants [65] |
| High-Sensitivity Library Prep Kits | AMPINEXT High-Sensitivity DNA Library Preparation Kit [65] | Constructs sequencing libraries from trace amounts of DNA (0.2 ng - 100 ng) [65] | Essential for low-input applications; minimizes amplification bias to maintain library complexity [37] [65] |
| Specialized Application Kits | AMPINEXT Bisulfite-Seq Kits; AMPINEXT ChIP-Seq Kits [65] | Prepares libraries for specific applications like methylation sequencing (Bisulfite-Seq) or chromatin immunoprecipitation (ChIP-Seq) [65] | Optimized for input type and specific enzymatic reactions; includes necessary reagents for conversion and pre-PCR steps [65] |
| Enzymes for Library Construction | T4 Polynucleotide Kinase, T4 DNA Polymerase, Klenow Fragment [42] | Performs end-repair, 5' phosphorylation, and 3' A-tailing of DNA fragments during library prep [42] | Critical for converting sheared DNA into blunt-ended, ligation-competent fragments; high-quality enzymes are crucial for efficiency [42] |
Navigating the challenges of sample quality and quantity is a foundational skill in modern chemogenomics and drug development. By implementing rigorous quality control measures, understanding the sources and solutions for common issues like low input and contamination, and selecting appropriate reagents, researchers can lay the groundwork for successful and interpretable NGS experiments. A meticulous approach to these initial stages ensures that the powerful data generated by NGS technologies accurately reflects the biological system under investigation, thereby enabling the discovery and validation of novel therapeutic targets.
Minimizing Bias in Library Preparation and PCR Amplification
In the context of chemogenomics research, where accurate and comprehensive genomic data is paramount for linking chemical compounds to their biological targets, understanding and minimizing bias in Next-Generation Sequencing (NGS) is a critical prerequisite. Bias refers to the non-random, systematic errors that cause certain sequences in a sample to be over- or under-represented in the final sequencing data [66]. For beginners in drug development, it is essential to recognize that these biases can significantly compromise data integrity, leading to inaccurate variant calls, obscured biological relationships, and ultimately, misguided research conclusions.
The two most prevalent sources of bias are GC content bias and PCR amplification bias [67]. GC bias manifests as uneven sequencing coverage across genomic regions with extreme proportions of guanine and cytosine nucleotides. GC-rich regions (>60%) can form stable secondary structures that hinder amplification, while GC-poor regions (<40%) may amplify less efficiently due to less stable DNA duplex formation [67]. Conversely, PCR amplification bias occurs during the library preparation steps where polymerase chain reaction (PCR) is used to amplify the genetic material. This process can preferentially amplify certain DNA fragments over others based on their sequence context, leading to a skewed representation in the final library [68] [66]. This is particularly problematic in applications like liquid biopsy, where the accurate quantification of multiple single nucleotide variants (SNVs) at the same locus is crucial [67].
For chemogenomics studies, which often rely on sensitive detection of genomic alterations in response to chemical perturbations, mitigating these biases is not optional—it is fundamental to achieving reliable and reproducible results.
A foundational study systematically dissected the Illumina library preparation process to pinpoint the primary source of base-composition bias [68]. The experimental design and key findings provide a model for how to rigorously evaluate bias.
Methodology for Bias Tracing
- Test Substrate: Researchers created a composite genomic DNA sample ("PER") with an extensive GC range by mixing DNA from Plasmodium falciparum (19% GC), Escherichia coli (51% GC), and Rhodobacter sphaeroides (69% GC) [68].
- Bias Assay: Instead of relying solely on sequencing, the team used a panel of quantitative PCR (qPCR) assays targeting amplicons ranging from 6% to 90% GC. This allowed for a precise, system-independent quantification of the abundance of each locus at various stages of the library prep workflow [68].
- Process Tracing: Aliquots were drawn after each major step of the library preparation process—shearing, end-repair/A-tailing, adapter ligation, size selection, and PCR amplification—and analyzed via qPCR to determine when skews in representation occurred [68].
Key Experimental Findings
The qPCR tracing revealed that the enzymatic steps of shearing, end-repair, A-tailing, and adapter ligation did not introduce significant systematic bias. Similarly, size selection on an agarose gel did not skew the base composition [68]. The critical finding was that PCR amplification during library preparation was identified as the most discriminatory step. As few as ten PCR cycles using the standard protocol severely depleted loci with GC content >65% and diminished those <12% GC [68].
Furthermore, the study identified hidden factors that exacerbate bias. The make and model of the thermocycler, specifically its temperature ramp rate, had a severe effect. A faster ramp rate (6°C/s) led to poor amplification of high-GC fragments, while a slower machine (2.2°C/s) resulted in a much flatter bias profile, extending even coverage from 13% to 84% GC [68]. This underscores that the physical instrumentation, not just the biochemistry, is a critical variable.
Optimized Protocols for Bias Minimization
Building on the experimental findings, researchers developed and tested several optimized protocols to mitigate amplification bias. The following table summarizes the key parameters that were successfully modified.
Table 1: Optimization Strategies for Reducing PCR Amplification Bias
| Parameter | Standard Protocol | Optimized Approach | Impact on Bias |
|---|---|---|---|
| Thermocycling Conditions | Short denaturation (e.g., 10s at 98°C) | Extended initial and cycle denaturation times (e.g., 3 min initial, 80s/cycle) [68] | Allows more time for denaturation of high-GC fragments, improving their amplification [68]. |
| PCR Enzyme | Standard polymerases (e.g., Phusion HF) | Bias-optimized polymerases (e.g., KAPA HiFi, AccuPrime Taq HiFi) [68] [66] | Engineered for more uniform amplification across fragments with diverse GC content [66]. |
| Chemical Additives | None | Inclusion of additives like Betaine (e.g., 2M) or TMAC* [68] [66] | Betaine equalizes the melting temperature of DNA, while TMAC stabilizes AT-rich regions, both promoting even amplification [68] [66]. |
| PCR Instrument | Varies by lab; fast ramp rates | Use of slower-ramping thermocyclers or protocols optimized for fast instruments [68] | A slower ramp rate ensures sufficient time at critical temperatures, minimizing bias related to instrument model [68]. |
*Tetramethyleneammonium chloride (TMAC) is particularly useful for AT-rich genomes [66].
The diagram below illustrates the logical workflow for diagnosing and addressing amplification bias in an NGS protocol.
Diagnosing and Addressing Amplification Bias
Alternative Library Preparation Methods
For the most bias-sensitive applications, alternative strategies exist that minimize or completely avoid PCR.
- PCR-Free Library Preparation: This workflow eliminates the amplification step entirely, thereby removing PCR-derived bias. However, it requires significantly higher input DNA (typically 1 µg or more), which can be a limitation for precious clinical or low-input samples [66] [69] [67].
- Enzymatic Fragmentation: Some modern kits, like KAPA HyperPlus, use enzymatic fragmentation (a "fragmentase") instead of physical shearing. This method combines shearing with end-repair in a single-tube reaction, reducing DNA loss and hands-on time, which can indirectly improve yield and representation [69].
The Scientist's Toolkit: Essential Reagents and Kits
Selecting the right reagents is a practical first step for any researcher aiming to minimize bias. The following table details key solutions mentioned in the literature.
Table 2: Research Reagent Solutions for Minimizing NGS Bias
| Reagent / Kit | Function | Key Advantage | Reference |
|---|---|---|---|
| KAPA HiFi DNA Polymerase | PCR amplification of NGS libraries | Demonstrates highly uniform genomic coverage across a wide range of GC content, performance close to PCR-free methods. | [66] |
| Betaine | PCR additive | Acts as a destabilizer, equalizing the melting temperature of DNA fragments with different GC content, thus improving amplification of GC-rich templates. | [68] |
| TMAC (Tetramethyleneammonium chloride) | PCR additive | Increases the thermostability of AT pairs, improving the efficiency and specificity of PCR for AT-rich regions. | [66] |
| PCR-Free Library Kits | Library preparation | Bypasses PCR amplification entirely, eliminating PCR duplicates and amplification bias. Ideal for high-input DNA samples. | [69] [67] |
| Unique Molecular Identifiers (UMIs) | Sample indexing | Short random barcodes ligated to each molecule before amplification, allowing bioinformatic distinction between true biological duplicates and PCR-derived duplicates. | [67] |
Bioinformatic Correction and Quality Control
Even with optimized wet-lab protocols, some level of bias may persist. Bioinformatics tools provide a final layer of defense to identify and correct these artifacts.
- Identification and Quantification: Tools like FastQC provide a visual report on sequence quality, including per-sequence GC content, which can reveal GC bias. Picard Tools and Qualimap offer more detailed assessments of coverage uniformity and can calculate metrics like the fraction of duplicate reads, which is a proxy for amplification bias [67].
- Computational Normalization: Several algorithms exist to computationally correct for GC bias. These tools adjust the read depth based on the local GC content, creating a more uniform coverage profile and improving the accuracy of downstream analyses like variant calling and copy number variation (CNV) detection [67].
A robust quality control (QC) pipeline is non-negotiable. Researchers should routinely run QC checks on their raw sequencing data to diagnose bias issues, which informs whether to adjust wet-lab protocols or apply bioinformatic corrections in subsequent experiments.
For chemogenomics researchers embarking on NGS, a proactive and multifaceted strategy is key to minimizing bias in library preparation and PCR amplification. This begins with selecting appropriate protocols and bias-optimized reagents, such as high-fidelity polymerases and chemical additives, tailored to the GC characteristics of the target genome. Furthermore, acknowledging and controlling for instrumental variables like thermocycler ramp rates is crucial. When resources and sample input allow, PCR-free workflows present the most robust solution. Finally, the implementation of rigorous bioinformatic QC and normalization tools ensures that any residual bias is identified and accounted for, safeguarding the integrity of the data and the validity of the biological conclusions drawn in drug development research.
Strategies for Automating the NGS Workflow for Reproducibility and Scalability
Next-generation sequencing (NGS) has revolutionized genomics research, bringing an unprecedented capacity to analyze genetic material in a high-throughput and cost-effective manner [40]. For researchers in chemogenomics—a field that explores the complex interplay between chemical compounds and biological systems to accelerate drug discovery—this technology is indispensable. It enables the systematic study of how drug-like molecules modulate gene expression, protein function, and cellular pathways. However, traditional manual NGS methods, characterized by labor-intensive pipetting and subjective protocol execution, create significant bottlenecks. They introduce variability that compromises data integrity, hindering the reproducibility of dose-response experiments and the scalable profiling of compound libraries [70] [71].
Automation is therefore not merely a convenience but an operational necessity for robust chemogenomics research. It transforms NGS from a variable art into a standardized, traceable process. By integrating robotics, sophisticated software, and standardized protocols, laboratories can achieve the precision and throughput required to reliably connect chemical structures to genomic phenotypes. This technical guide outlines core strategies for automating NGS workflows, with a specific focus on achieving the reproducibility and scalability essential for meaningful chemogenomics discovery and therapeutic development.
Core Methodology: Automated Library Preparation
In the NGS workflow, library preparation—the process of converting nucleic acids into a sequencer-compatible format—is the most susceptible to human error and is a primary target for automation. The foundational strategy for enhancing both reproducibility and scalability lies in the end-to-end automation of this critical step.
Technological Foundations
Automation in library preparation is achieved through integrated systems that handle liquid dispensing, enzymatic reactions, and purification. Key innovations include:
- End-to-End Automation Workstations: Systems like the G.STATION NGS Workstation encapsulate the entire library construction process. They integrate a non-contact liquid handler (e.g., the I.DOT Liquid Handler) for precise nanoliter-range reagent dispensing and a cleanup device (e.g., the G.PURE) for magnetic bead-based purification and size selection [70]. This "sample-in, library-out" approach eliminates manual intervention, drastically reducing hands-on time from hours to minutes.
- Non-Contact, Low-Volume Dispensing: Technologies such as the I.DOT Liquid Handler dispense reagents in the nanoliter range. This non-contact method minimizes cross-contamination risks and enables significant assay miniaturization, conserving precious samples and expensive reagents while maintaining high data quality [70]. Its compatibility with 96-, 384-, and 1536-well plates makes it inherently scalable.
- Sequencing-Ready DNA Prep Platforms: These fully integrated platforms combine DNA/RNA extraction, library preparation, and quality control into a single, automated workflow. Studies demonstrate that such platforms can achieve high reproducibility and quality outputs, making them invaluable for population-scale genomics and large-scale chemogenomics screens [70].
Impact on Reproducibility and Scalability
The quantitative benefits of automating library preparation are substantial, as shown in the following comparison:
Table 1: Impact of Automating NGS Library Preparation
| Metric | Manual Preparation | Automated Preparation | Impact |
|---|---|---|---|
| Hands-on Time | ~3 hours per library | < 15 minutes per library [70] | Frees personnel for data analysis and experimental design [71]. |
| Process Variability | High due to pipetting errors and protocol deviations. | Minimal; automated systems enforce precise liquid handling and timings. | Ensures consistency across runs and laboratories [72]. |
| Sample Throughput | Limited by human speed and endurance. | High; can process hundreds to thousands of samples daily [71]. | Enables scaling from dozens to hundreds of libraries per day [71]. |
| Reagent Cost | Higher due to excess consumption and dead volumes. | Reduced by up to 50% via miniaturization [70]. | Lowers cost per sample, making large-scale studies more feasible. |
| Contamination Risk | Higher due to manual pipetting and sample handling. | Significantly reduced via non-contact dispensing and closed systems [72]. | Protects sample integrity and reduces false positives. |
Experimental Protocol: Automated Targeted RNA-Seq for Compound Profiling
The following detailed protocol is designed for chemogenomics researchers to reliably profile gene expression changes in response to chemical compound treatments. This protocol leverages automation to ensure that results are reproducible and scalable across large compound libraries.
Detailed Stepwise Methodology
Step 1: Automated RNA Extraction and Quality Control (QC)
- Isolate total RNA from compound-treated and control cells using a robotic nucleic acid extraction system integrated with a Liquid Handling System (LHS).
- Perform automated QC using an instrument that performs fluorometric quantification and spectrophotometric purity assessment (e.g., A260/A280 ratio). The system should be programmed to flag samples with concentration < 20 ng/µL or A260/A280 ratio outside 1.8-2.0, preventing low-quality samples from proceeding.
Step 2: Automated Library Preparation using a Integrated Workstation
- Utilize an end-to-end workstation (e.g., G.STATION) for the entire process.
- cDNA Synthesis: The LHS dispenses fragmented RNA, reverse transcriptase, and random primers into a 384-well plate. The thermal cycler on the system executes the programmed cDNA synthesis protocol.
- Tagmentation and Adapter Ligation: The LHS precisely adds tagmentation enzyme and uniquely indexed adapters to each sample. This step is critical for multiplexing. The system's software tracks each barcode to ensure sample identity is maintained.
- Library Amplification & Purification: The LHS adds PCR mix to the tagmented DNA. Post-amplification, the integrated cleanup device (e.g., G.PURE) performs magnetic bead-based purification and size selection to isolate library fragments of the desired size (e.g., ~300-500 bp).
Step 3: Normalization, Pooling, and Sequencing
- Quantify the final libraries using an automated fluorometer. The LHS then normalizes concentrations across all libraries based on the QC data.
- The LHS pools a pre-calculated volume of each normalized library into a single tube for multiplexed sequencing.
- Load the pooled library onto a sequencer. For targeted RNA-Seq, a mid-to-high throughput system (e.g., Illumina NextSeq 1000/2000 Systems) is recommended [35].
Step 4: Automated Data Analysis
- Upon run completion, the sequencer automatically triggers the start of a bioinformatics pipeline.
- Use a standardized RNA-Seq analysis workflow (e.g., on the DRAGEN-GATK or nf-core/rnaseq platform) for secondary analysis [73] [74]. This includes alignment to a reference genome, transcript quantification, and differential expression analysis between compound-treated and control groups.
Visualization of the Automated Workflow
The following diagram illustrates the integrated, automated pathway from sample to insight, highlighting the reduction in manual intervention.
Automated NGS Workflow from Sample to Result
Research Reagent Solutions
A successful automated experiment depends on the seamless interaction of reliable reagents with the automated platform.
Table 2: Essential Materials for Automated Targeted RNA-Seq
| Item | Function in the Protocol | Considerations for Automation |
|---|---|---|
| Total RNA Samples | The input molecule for library prep; quality dictates success. | Use barcoded tubes for seamless tracking by the automated system's software. |
| Robust RNA-Seq Library Prep Kit | Provides all enzymes, buffers, and reagents for cDNA synthesis, tagmentation, and adapter ligation. | Must be validated for use with automated LHSs. Lyophilized reagents are preferred to eliminate cold-chain shipping and improve stability on the deck [75]. |
| Unique Dual Index (UDI) Adapter Set | Allows multiplexing of hundreds of samples by labeling each with a unique barcode combination. | Essential for tracking samples in a pooled run. UDIs correct for index hopping errors, improving data accuracy [35]. |
| Magnetic Beads (SPRI) | Used for automated size selection and purification of libraries between enzymatic steps. | Bead size and consistency are critical for reproducible performance on automated cleanup modules [70]. |
| Low-Volume, 384-Well Plates | The reaction vessel for the entire library preparation process. | Must be certified for use with the specific thermal cycler and LHS to ensure proper heat transfer and sealing. |
| QC Assay Kits | For fluorometric quantification (e.g., Qubit) and fragment analysis (e.g., Bioanalyzer/TapeStation). | Assays should be compatible with automated loading and analysis to feed data directly into the normalization step. |
Quality Control and Data Analysis Automation
Automating wet-lab processes is only half the solution. Ensuring data quality and standardizing analysis are equally critical for reproducible and scalable science.
Integrated Quality Control
Real-time quality monitoring is a cornerstone of a robust automated workflow. Tools like omnomicsQ can be integrated to automatically assess sample quality at various stages, flagging any samples that fall below pre-defined thresholds (e.g., low concentration, inappropriate fragment size) before they consume valuable sequencing resources [72]. This proactive approach prevents wasted reagents and time. Furthermore, participation in External Quality Assessment (EQA) programs (e.g., EMQN, GenQA) helps benchmark automated workflows against industry standards, ensuring cross-laboratory reproducibility, which is vital for collaborative drug discovery projects [72].
Bioinformatics and Workflow Orchestration
Post-sequencing, a modern bioinformatics platform is essential for managing the data deluge. These platforms provide:
- Workflow Orchestration: Execution of complex, multi-step analysis pipelines (e.g., using Nextflow) in a standardized, scalable, and reproducible manner [74]. Version control for both pipelines and software dependencies (via containers like Docker) ensures that an analysis run today can be perfectly replicated years later.
- Unified Data Management: Centralized storage and management of raw data (FASTQ), intermediate files (BAM), and results (VCF) with rich metadata, adhering to FAIR principles [74].
- Scalable Compute: Dynamic allocation of computational resources across cloud or on-premise environments to handle data from large-scale experiments efficiently [76] [74].
- AI-Enhanced Analysis: Artificial intelligence is increasingly used to improve the accuracy and speed of variant calling and data interpretation. Tools like DeepVariant use deep learning to identify genetic variants more accurately than traditional methods, while other AI models can help interpret the functional impact of these variants in the context of chemical perturbations [76].
A Phased Approach to Implementation
Successfully automating an NGS workflow requires a strategic, phased approach:
- Workflow Audit: Identify the most repetitive, error-prone, or bottlenecked steps in your current NGS workflow (e.g., manual pipetting during library normalization) as the primary candidates for automation [71].
- Platform Selection: Choose an automation platform that integrates seamlessly with your existing laboratory information management system (LIMS), NGS pipelines, and regulatory requirements (e.g., GDPR, HIPAA, IVDR for diagnostic applications) [72].
- Pilot and Scale: Begin by automating a single process, such as nucleic acid extraction or library preparation, in a pilot phase. This allows for troubleshooting and validation before scaling to a full, end-to-end automated workflow [71].
- Personnel Training: Invest in comprehensive training for scientists and technicians. This should cover operating automated systems, understanding new software, and troubleshooting, ensuring smooth adoption and maximizing the return on investment [72].
Automation is the catalytic force that unlocks the full potential of NGS in chemogenomics. By implementing the strategies outlined in this guide—adopting end-to-end automated library preparation, integrating real-time quality control, and leveraging powerful bioinformatics platforms—research teams can transform their operations. The result is a workflow defined by precision, reproducibility, and scalable throughput. This robust foundation empowers researchers to confidently generate high-quality genomic data, accelerating the translation of chemical probes into viable therapeutic strategies and ultimately advancing the frontier of personalized medicine.
Selecting the Right Consumables and Reagents for Your Application
In chemogenomics research, which aims to discover how small molecules affect biological systems through genomic approaches, next-generation sequencing (NGS) has become an indispensable tool. The reliability of your NGS data, crucial for connecting chemical compounds to genomic responses, is fundamentally dependent on the consumables and reagents you select. These components form the foundation of every sequencing workflow, directly impacting data quality, reproducibility, and the success of downstream analysis [77]. The global sequencing consumables market, reflecting this critical importance, is projected to grow from USD 11.32 billion in 2024 to approximately USD 55.13 billion by 2034, demonstrating their essential role in modern genomics [78].
For researchers in drug development, selecting the right consumables is not merely a procedural step but a critical strategic decision. The choice between different types of library preparation kits, sequencing reagents, and quality control methods can determine the ability to detect subtle transcriptomic changes in response to compound treatment or to identify novel drug targets through genetic screening. This guide provides a structured framework for navigating these choices, ensuring your chemogenomics research is built upon a robust and reliable technical foundation.
The NGS Workflow: A Consumables Perspective
A standardized NGS procedure involves multiple critical stages where consumable selection is paramount. The following workflow outlines the key decision points, with an emphasis on steps particularly relevant to chemogenomics applications such as profiling compound-induced gene expression changes or identifying genetic variants that modulate drug response.
Figure 1: Comprehensive NGS workflow for chemogenomics, highlighting critical points for consumable selection. Each stage requires specific reagent choices that can significantly impact data quality, especially when working with compound-treated samples. Adapted from Illumina workflow descriptions [35] and Frontline Genomics protocols [37].
Essential Consumables and Reagents by Workflow Stage
Nucleic Acid Extraction
The extraction process sets the foundation for your entire NGS experiment. In chemogenomics, where samples may include cells treated with novel compounds or sensitive primary cell cultures, maintaining nucleic acid integrity is paramount.
- Sample-Specific Considerations: The optimal extraction method varies significantly by sample type. For DNA extraction from blood, protocols must effectively disrupt red blood cells and dissolve clots, often requiring specific enzymatic cocktails [77]. For RNA extraction from fibrous tissues, prolonged lysis times may be necessary to achieve effective RNA release [77]. When working with compound-treated cells, consider potential interactions between your chemicals and extraction components.
- Specialized Extraction Types: Chemogenomics often requires specialized extraction approaches:
- Circulating cell-free DNA (cfDNA): Requires highly sensitive extraction methods to maximize recovery from limited samples, crucial when analyzing biomarkers from compound efficacy studies [77].
- High Molecular Weight (HMW) DNA: Needs gentle handling to prevent shearing, essential for long-read sequencing applications in structural variant analysis [77].
- Formalin-Fixed Paraffin-Embedded (FFPE) tissue: Often encountered in drug discovery pipelines, requiring specialized kits designed to reverse cross-linking and repair fragmented nucleic acids [79].
- Quality Control Imperative: Implement rigorous QC after extraction using UV spectrophotometry for purity assessment and fluorometric methods for accurate quantitation [35]. This step is particularly important when working with compounds that might absorb at common wavelengths used in quantification.
Library Preparation
Library preparation is where the most significant consumable choices occur, directly determining library complexity and sequencing success. The selection process should be guided by your specific chemogenomics application.
Table 1: Library Preparation Kits Selection Guide for Chemogenomics Applications
| Application | Recommended Kit Type | Key Technical Considerations | Chemogenomics-Specific Utility |
|---|---|---|---|
| Whole Genome Sequencing (WGS) | Fragmentation & Ligation Kits | Fragment size selection critical for even coverage; input DNA quality crucial [37] | Identifying genetic variants that influence compound sensitivity; mutagenesis tracking |
| Whole Exome Sequencing | Target Enrichment Kits | Hybridization-based capture efficiency; off-target rates [37] | Cost-effective profiling of coding regions affected by compound treatment |
| RNA Sequencing | RNA-to-cDNA Conversion Kits | RNA integrity number (RIN) >8 recommended; ribosomal depletion needed for mRNA-seq [37] | Profiling transcriptomic responses to compound treatment; alternative splicing analysis |
| Targeted Sequencing | Hybridization or Amplicon Kits | Probe design coverage; amplification bias in amplicon approaches [37] | Deep sequencing of candidate drug targets or pathways; pharmacogenomic variant screening |
| Methylation Sequencing | Bisulfite Conversion Kits | Conversion efficiency >99%; DNA degradation minimization [37] | Epigenetic changes induced by compound treatment; biomarker discovery |
- Fragmentation Methods: DNA can be fragmented using physical (acoustic shearing) or enzymatic (tagmentation) methods. Enzymatic approaches like tagmentation, which combines fragmentation and adapter ligation, have significantly reduced costs and hands-on time [37]. For chemogenomics applications where high molecular weight DNA is desirable for detecting large structural variants, gentle physical shearing may be preferable.
- Adapter Ligation: Adapters must be compatible with your sequencing platform. Unique dual indexing (UDI) is strongly recommended for chemogenomics screens to enable sample multiplexing while preventing index hopping errors, especially in large-scale compound screens [37].
- Amplification Strategies: PCR amplification is often necessary but introduces biases. To minimize this, select high-fidelity polymerases demonstrated to minimize amplification bias [37]. For limited samples common in early drug discovery, consider using specialized low-input protocols.
Sequencing
Sequencing consumables are typically platform-specific but share common selection criteria relevant to chemogenomics applications.
- Flow Cells and Cartridges: The choice of flow cell determines sequencing capacity and read length. For applications like single-cell RNA-seq of compound-treated cells, high-output flow cells provide the necessary depth to characterize heterogeneous cellular responses [78].
- Sequencing Reagents: These include nucleotides, polymerases, and buffers essential for the sequencing process [80]. Key considerations include:
- Run Quality: Cluster density and phasing/prephasing metrics directly impact data quality and output [78].
- Read Length: Matched to application - longer reads for structural variant detection, shorter reads for expression profiling.
- Chemistry Compatibility: Ensure reagents are specifically validated for your sequencing platform and application [77].
- Quality Monitoring: Implement real-time quality monitoring during sequencing runs to identify issues early. Automated tools can flag samples that fall below pre-defined quality thresholds, preventing wasted resources on compromised data [72].
A Framework for Consumable Selection
Application-Driven Selection Criteria
Navigate consumable selection systematically by considering these critical parameters:
- Sample Type and Quality: Input material characteristics (e.g., FFPE, fresh frozen, low-input) dictate compatible kits. For degraded samples from archival collections, specialized restoration reagents may be necessary [37].
- Throughput Requirements: Scale your selection to match screening scope. Automated liquid handling systems can improve consistency in high-throughput chemogenomics screens [72].
- Platform Compatibility: Ensure consumables are validated for your specific sequencer (Illumina, PacBio, Oxford Nanopore) as chemistries are often proprietary [80].
- Regulatory Compliance: For translational chemogenomics, select reagents meeting quality standards (ISO 13485) if developing diagnostic applications [72].
The Scientist's Toolkit: Essential Research Reagent Solutions
Table 2: Research Reagent Solutions for Chemogenomics NGS Workflows
| Reagent Category | Specific Examples | Function in Workflow | Selection Considerations |
|---|---|---|---|
| Nucleic Acid Extraction Kits | Cell-free DNA extraction kits, Total RNA isolation kits | Isolate and purify genetic material from various sample types [37] | Input requirements, yield, automation compatibility, processing time |
| Library Preparation Kits | MagMAX CORE Kit (Thermo Fisher), Illumina DNA Prep | Fragment DNA and attach platform-specific adapters [78] [79] | Input DNA quality, hands-on time, compatibility with automation, bias metrics |
| Target Enrichment Kits | Hybridization capture probes, Amplicon sequencing panels | Enrich for specific genomic regions of interest [37] | Coverage uniformity, off-target rates, specificity, gene content relevance |
| Sequenceing Reagents | Illumina SBS chemistry, PacBio SMRTbell reagents | Enable the actual sequencing reaction on instruments [80] | Platform compatibility, read length, output, cost per gigabase |
| Quality Control Kits | Fluorometric quantitation assays, Fragment analyzers | Assess nucleic acid quality and library preparation success [35] | Sensitivity, required equipment, sample consumption, throughput |
Addressing Common Challenges in Consumable Selection
- Minimizing Bias: PCR duplication can lead to uneven sequencing coverage. To improve library complexity, optimize input DNA quantity and use PCR enzymes demonstrated to minimize amplification bias [37]. For applications requiring absolute quantification, consider unique molecular identifiers (UMIs).
- Preventing Contamination: Implement dedicated pre-PCR areas and use automated systems with disposable tips to reduce cross-contamination risks between samples, especially critical in high-throughput compound screens [37].
- Managing Costs: While initial costs may seem high, consider total workflow efficiency. Automated systems and integrated kits can reduce hands-on time and reagent waste, improving overall cost-effectiveness [72].
Implementation and Quality Assurance
Automation and Workflow Integration
Automation technologies significantly enhance the precision and efficiency of NGS library preparation [77]. For chemogenomics researchers conducting larger-scale studies, automation offers substantial benefits:
- Liquid Handling Systems: Automated pipetting eliminates variability in reagent dispensing, improving reproducibility across compound treatment conditions [72].
- Workflow Integration: Select systems that integrate seamlessly with your laboratory information management system (LIMS) for complete sample tracking [72].
- Modular Platforms: Vendor-agnostic systems allow flexibility to adapt protocols as research questions evolve, crucial in iterative drug discovery cycles [77].
Quality Control Across the Workflow
Implement a multi-stage QC strategy to ensure data reliability:
- Post-Extraction QC: Assess nucleic acid purity (A260/A280 ratios) and integrity (RIN for RNA) using spectrophotometric and fluorometric methods [35].
- Library QC: Verify fragment size distributions and quantify libraries appropriately using methods such as qPCR to ensure optimal cluster densities [37].
- Real-Time Monitoring: Utilize automated quality monitoring tools that flag samples falling below predefined thresholds before proceeding to sequencing [72].
In chemogenomics research, where connecting chemical perturbations to genomic responses is fundamental, proper selection of NGS consumables and reagents is not a trivial consideration but a critical determinant of success. The framework presented here—emphasizing application-specific needs, quality integration points, and strategic implementation—provides a structured approach to these decisions. As sequencing technologies continue to evolve, with emerging platforms offering new capabilities for chemogenomics discovery, the principles of careful consumable selection, rigorous quality control, and workflow optimization will remain essential for generating reliable, reproducible data that advances drug development pipelines. By viewing consumables not merely as disposable supplies but as integral components of your research infrastructure, you position your chemogenomics studies for the highest likelihood of meaningful biological insights.
Managing Host DNA Contamination and Improving Pathogen Detection Sensitivity
In the field of chemogenomics and infectious disease research, metagenomic next-generation sequencing (mNGS) has emerged as a transformative, hypothesis-free method for pathogen detection. This technology enables researchers to identify bacteria, viruses, fungi, and parasites without prior knowledge of the causative agent, making it particularly valuable for diagnosing complex infections and discovering novel pathogens [81] [82]. However, a significant technical challenge impedes its sensitivity: the overwhelming presence of host DNA in clinical samples.
In most patient samples, over 99% of sequenced nucleic acids originate from the human host, drastically reducing the sequencing capacity available for detecting pathogenic microorganisms [81] [83]. This disparity arises from fundamental biological differences; a single human cell contains approximately 3 Gb of genomic data, while a viral particle may contain only 30 kb—a difference of up to five orders of magnitude [83]. This imbalance leads to three critical issues: (1) dilution of microbial signals, making pathogen detection difficult; (2) wasteful consumption of sequencing resources on non-informative host reads; and (3) reduced analytical sensitivity, particularly for low-abundance pathogens. Consequently, effective host DNA depletion has become a prerequisite for advancing mNGS applications in clinical diagnostics and chemogenomics research.
Understanding Host Depletion: Core Principles and Methodologies
Host DNA depletion strategies can be implemented at various stages of the mNGS workflow, either experimentally before sequencing or computationally after data generation. These methods leverage differences in physical properties, molecular characteristics, and genomic features between host and microbial cells.
Table 1: Host DNA Depletion Methods: Comparison of Key Approaches
| Method Category | Underlying Principle | Advantages | Limitations | Ideal Application Scenarios |
|---|---|---|---|---|
| Physical Separation | Exploits size/density differences between host cells and microbes | Low cost, rapid operation | Cannot remove intracellular host DNA | Virus enrichment, body fluid samples [83] |
| Targeted Amplification | Selective enrichment of microbial genomes using specific primers | High specificity, strong sensitivity | Primer bias affects quantification accuracy | Low biomass samples, known pathogen screening [83] |
| Host Genome Digestion | Enzymatic or chemical cleavage of host DNA based on methylation or accessibility | Efficient removal of free host DNA | May damage microbial cell integrity | Tissue samples with high host content [83] |
| Bioinformatics Filtering | Computational removal of host-mapping reads from sequencing data | No experimental manipulation, highly compatible | Dependent on complete reference genome | Routine samples, post-data processing [83] |
| Novel Filtration Technologies | Surface-based selective retention of host cells while allowing microbial passage | High efficiency (>99% WBC removal), preserves microbial composition | Technology-specific optimization required | Blood samples for sepsis diagnostics [84] |
The selection of an appropriate host depletion strategy depends on several factors, including sample type, target pathogens, available resources, and downstream applications. For instance, physical separation methods work well for liquid samples where cellular integrity is maintained, while bioinformatics filtering serves as a universal final defense that can be applied to all sequencing data. Recent advancements have introduced innovative solutions such as Zwitterionic Interface Ultra-Self-assemble Coating (ZISC)-based filtration devices, which achieve >99% white blood cell removal while allowing unimpeded passage of bacteria and viruses [84].
Quantitative Impact: Measuring the Effect of Host Depletion on Sensitivity
Substantial evidence demonstrates that effective host DNA depletion dramatically improves mNGS performance. The relationship between host read removal and microbial detection enhancement follows a logarithmic pattern, where even modest reductions in host background can yield disproportionate gains in pathogen detection sensitivity.
Table 2: Performance Metrics of Host Depletion Methods in Clinical Validation Studies
| Study Reference | Sample Type | Host Depletion Method | Key Performance Metrics | Clinical Application |
|---|---|---|---|---|
| ZISC Filtration [84] | Sepsis blood samples (n=8) | ZISC-based filtration device | >10x enrichment of microbial reads (925 vs. 9,351 RPM); 100% detection of culture-confirmed pathogens | Sepsis diagnostics |
| Colon Biopsy [83] | Human colon tissue | Combination of physical and enzymatic methods | 33.89% increase in bacterial gene detection (human); 95.75% increase (mouse) | Gut microbiome research |
| CSF mNGS [85] | Cerebrospinal fluid | DNAse treatment (RNA libraries); methylated DNA removal (DNA libraries) | Overall sensitivity: 63.1%; specificity: 99.6%; 21.8% diagnoses made by mNGS alone | Central nervous system infections |
| Lung BALF [86] | Bronchoalveolar lavage fluid | Bioinformatic filtering (Bowtie2/Kraken2) | 56.5% sensitivity for infection diagnosis vs. 39.1% for conventional methods | Pulmonary infection vs. malignancy |
The quantitative benefits extend beyond simple read count improvements. Effective host depletion increases microbial diversity detection (as measured by Chao1 index), enhances gene coverage, and improves the detection of low-abundance taxa that may play crucial roles in disease pathogenesis [83]. In clinical settings, these technical improvements translate to tangible diagnostic benefits. For example, a seven-year performance evaluation of CSF mNGS testing demonstrated that the assay identified 797 organisms from 697 (14.4%) of 4,828 samples, with 48 (21.8%) of 220 infectious diagnoses made by mNGS alone [85].
Emerging Solutions: Innovative Technologies for Host DNA Removal
ZISC-Based Filtration Technology
Recent advances in material science have yielded novel approaches to host cell depletion. The ZISC-based filtration device represents a breakthrough technology that uses zwitterionic interface ultra-self-assemble coating to selectively bind and retain host leukocytes without clogging, regardless of filter pore size [84]. This technology achieves >99% removal of white blood cells across various blood volumes while allowing unimpeded passage of bacteria and viruses.
The mechanism relies on surface chemistry that preferentially interacts with host cells while minimally affecting microbial pathogens. When evaluated in spiked blood samples, the filter demonstrated efficient passage of Escherichia coli, Staphylococcus aureus, Klebsiella pneumoniae, and feline coronavirus, confirming its broad compatibility with different pathogen types [84]. In clinical validation with blood culture-positive sepsis patients, mNGS with filtered gDNA detected all expected pathogens in 100% (8/8) of samples, with an average microbial read count of 9,351 reads per million (RPM)—over tenfold higher than unfiltered samples (925 RPM) [84].
Integrated Workflow Solutions
Beyond single-method approaches, integrated workflows combine multiple depletion strategies to achieve superior performance. For example, a typical optimized workflow might incorporate:
- Initial physical separation using differential centrifugation or filtration
- Selective enzymatic digestion of residual host DNA
- Bioinformatic filtering as a final cleanup step
This layered approach addresses the limitations of individual methods while capitalizing on their complementary strengths. The sequential application of orthogonal depletion mechanisms can achieve synergistic effects, potentially reducing host background to ≤80% while increasing microbial sequencing depth by orders of magnitude [83].
Experimental Protocols: Detailed Methodologies for Implementation
ZISC-Based Filtration Protocol for Blood Samples
Principle: This protocol utilizes a novel zwitterionic interface coating that selectively retains host leukocytes while allowing microbial pathogens to pass through the filter [84].
Materials:
- ZISC-based fractionation filter (commercially available as Devin from Micronbrane, Taiwan)
- Whole blood sample (3-13 mL volume)
- Syringe (appropriate size for blood volume)
- 15 mL Falcon tube
- Low-speed centrifuge
- High-speed centrifuge
- DNA extraction kit
Procedure:
- Transfer approximately 4 mL of whole blood to a syringe.
- Securely connect the syringe to the ZISC-based fractionation filter.
- Gently depress the syringe plunger to push the blood sample through the filter into a 15 mL Falcon tube.
- Centrifuge the filtered blood at 400g for 15 minutes at room temperature to separate plasma.
- Transfer the plasma to a new tube and centrifuge at 16,000g to obtain a sample pellet.
- Extract DNA from the pellet using a commercial microbial DNA enrichment kit.
- Proceed with standard mNGS library preparation and sequencing.
Validation: Post-filtration, white blood cell counts should be measured using a complete blood cell count analyzer to confirm >99% depletion efficiency. Bacterial passage can be confirmed using standard plate-enumeration techniques for spiked samples [84].
Bioinformatic Host Read Removal Protocol
Principle: Computational removal of host-derived sequencing reads using alignment-based filtering against a reference host genome.
Materials:
- Raw sequencing data in FASTQ format
- High-performance computing environment
- Host reference genome (e.g., hg19 for human)
- Alignment tools (Bowtie2, BWA)
- Filtering tools (KneadData, BMTagger)
Procedure:
- Quality control of raw sequencing data using FastQC.
- Preprocessing to remove adapter sequences and low-quality bases using Trimmomatic.
- Alignment of reads against the host reference genome using Bowtie2 with sensitive parameters.
- Separation of aligned (host) and unaligned (non-host) reads.
- Taxonomic classification of non-host reads using Kraken2 against a microbial database.
- Validation of candidate pathogens using BLAST alignment.
- Interpretation of results in clinical context by experienced personnel.
Validation: The efficiency of host read removal can be quantified by calculating the percentage of reads mapping to the host genome before and after filtering. Optimal performance typically achieves >99% host read removal while preserving microbial diversity [86] [83].
Visualization: Workflow Diagrams for Host Depletion Strategies
Host DNA Depletion Workflow: Integrated Strategies
Table 3: Essential Research Reagents and Tools for Host DNA Depletion Studies
| Category | Specific Product/Kit | Manufacturer | Primary Function | Key Applications |
|---|---|---|---|---|
| Filtration Devices | Devin Microbial DNA Enrichment Kit | Micronbrane Medical | ZISC-based host cell depletion | Blood samples, sepsis diagnostics [84] |
| Enzymatic Depletion | NEBNext Microbiome DNA Enrichment Kit | New England Biolabs | CpG-methylated host DNA removal | Various sample types with high host content [84] |
| Differential Lysis | QIAamp DNA Microbiome Kit | Qiagen | Differential lysis of human cells | Tissue samples, body fluids [84] |
| Computational Tools | KneadData | Huttenhower Lab | Integrates Bowtie2/Trimmomatic for host sequence removal | Post-sequencing data cleanup [83] |
| Alignment Tools | Bowtie2/BWA | Open Source | Maps sequencing reads to host genome | Standard host read filtering [86] [83] |
| Contamination Control | Decontam | Callahan Lab | Statistical classification of contaminant sequences | Low-biomass samples, reagent contamination [87] |
| Reference Materials | ZymoBIOMICS Spike-in Controls | Zymo Research | Internal controls for extraction/sequencing | Process monitoring, quality control [84] [87] |
Effective management of host DNA contamination represents a cornerstone of robust mNGS applications in chemogenomics and clinical diagnostics. As the field advances, integrated approaches that combine multiple depletion strategies will likely become standard practice. Future developments may include crisper-based enrichment of microbial sequences, microfluidic devices for automated host cell separation, and machine learning algorithms for enhanced bioinformatic filtering.
The quantitative evidence presented in this review unequivocally demonstrates that strategic host DNA depletion dramatically improves pathogen detection sensitivity, with certain technologies enabling over tenfold enrichment of microbial reads [84]. These technical advancements directly translate to improved diagnostic yields, as evidenced by the 21.8% of infections that would have remained undiagnosed without mNGS [85]. For researchers in chemogenomics and drug development, implementing these host depletion strategies is essential for unlocking the full potential of mNGS in pathogen discovery, resistance monitoring, and therapeutic development.
Ensuring Accuracy: Validation Guidelines and Comparative Analysis of NGS Methods
Guidelines for Analytical Validation of NGS Oncology Panels
The adoption of Next-Generation Sequencing (NGS) in oncology represents a paradigm shift in molecular diagnostics, enabling the simultaneous assessment of multiple genetic alterations from limited tumor material. NGS is a modern method of analyzing genetic material that allows for the rapid sequencing of large amounts of DNA or RNA, sequencing millions of small fragments simultaneously [5]. The transition from single-gene tests to multi-gene NGS oncology panels enhances diagnostic yield and conserves precious tissue resources, particularly in advanced cancers where treatment decisions hinge on identifying specific biomarkers [88] [89].
These guidelines provide a structured framework for the analytical validation of targeted NGS gene panels used for detecting somatic variants in solid tumors and hematological malignancies. The core principle is an error-based approach where the laboratory director identifies potential sources of errors throughout the analytical process and addresses them through rigorous test design, validation, and quality control measures [88]. This ensures reliable detection of clinically relevant variant types—including single-nucleotide variants (SNVs), insertions/deletions (indels), copy number alterations (CNAs), and gene fusions—with demonstrated accuracy, precision, and robustness under defined performance specifications [88] [90].
Technology and Workflow Basics
The basic NGS process includes fragmenting DNA/RNA into multiple pieces, adding adapters, sequencing the libraries, and reassembling them to form a genomic sequence. This massively parallel approach improves speed and accuracy while reducing costs [5]. The foundational NGS workflow consists of four major steps: nucleic acid extraction, library preparation, sequencing, and data analysis [5] [88] [91].
Targeted panels are the most practical approach in clinical settings, focusing on genes with established diagnostic, therapeutic, or prognostic relevance [88]. Two primary methods exist for library preparation:
- Hybrid capture-based methods use biotinylated oligonucleotide probes to enrich genomic regions of interest. These longer probes can tolerate several mismatches, reducing allele dropout issues common in amplification-based assays [88].
- Amplification-based approaches (amplicon-based) use PCR primers to directly amplify target regions [88]. These panels, like the Lung Cancer Compact Panel (LCCP), can achieve remarkably high sensitivity with a limit of detection (LOD) as low as 0.14% for certain driver mutations [89].
Key Applications in Oncology
Targeted NGS panels interrogate genes for specific variant types fundamental to cancer pathogenesis and treatment:
- SNVs and Indels: The most common mutation types in solid tumors and hematological malignancies (e.g., KRAS p.Gly12 variants, EGFR p.Leu858Arg) [88].
- Copy Number Alterations (CNAs): Structural changes resulting in genomic gains or losses (e.g., ERBB2 amplification in breast cancer, loss of TP53) [88].
- Structural Variants (SVs) / Gene Fusions: Chromosomal rearrangements that serve as important diagnostic and therapeutic biomarkers (e.g., EML4-ALK fusions in lung adenocarcinoma) [88].
Experimental Design for Validation
Panel Content and Design Considerations
When designing a custom NGS panel, the intended use must be clearly defined, including specimen types (e.g., primary tumor, cytology specimens, liquid biopsy) and variant types to be detected [88] [92]. The Nonacus Panel Design Tool exemplifies a systematic approach, allowing researchers to select appropriate genome builds (GRCh37/hg19 or GRCh38/hg38), define regions of interest via BED files or gene lists, and optimize probe tiling [92].
Probe tiling density significantly impacts performance and cost. A 1x tiling covers each base with one probe aligned end-to-end, while 2x tiling creates probe overlaps (40-80 bp), improving sequencing accuracy for middle regions of DNA [92]. The tool also automatically masks highly repetitive genomic regions (constituting nearly 50% of the human genome) to prevent over- or under-sequencing, though these can be manually unmasked if biologically relevant [92].
Sample Selection and Requirements
Validation requires a well-characterized set of samples encompassing the anticipated spectrum of real-world specimens. Key considerations include:
- Tumor Fraction Estimation: For solid tumors, microscopic review by a certified pathologist is mandatory to ensure sufficient non-necrotic tumor content, often requiring macrodissection or microdissection for enrichment [88]. Estimation of tumor cell fraction is critical for interpreting mutant allele frequencies and CNAs [88].
- Sample Types: Laboratories should validate all specimen types they plan to accept, including formalin-fixed paraffin-embedded (FFPE) tissue, core needle biopsies, and increasingly, cytology specimens (e.g., bronchial brushing rinses, pleural effusions) [89]. Prospective studies demonstrate that cytology specimens preserved in nucleic acid stabilizers can achieve success rates for gene panel analysis as high as 98.4%, with nucleic acid quality sometimes surpassing FFPE samples [89].
- Reference Materials: Well-characterized reference cell lines and reference materials are essential for evaluating assay performance. These should include variants at known allele frequencies and different variant types across genomic regions of interest [88].
Table 1: Minimum Sample Requirements for Analytical Validation Studies
| Variant Type | Minimum Number of Unique Variants | Minimum Number of Samples | Key Performance Parameters |
|---|---|---|---|
| SNVs | 30-50 | 5-10 | Sensitivity, Specificity, PPA, PPV |
| Indels | 20-30 (various lengths) | 5-10 | Sensitivity for repetitive/non-repetitive regions |
| Copy Number Alterations | 5-10 (gains and losses) | 3-5 | Sensitivity, specificity for different ploidy levels |
| Gene Fusions | 5-10 (various partners) | 3-5 | Sensitivity, specificity for different breakpoints |
Wet-Lab Protocols and Methodologies
Nucleic Acid Extraction and Quality Control
The initial step involves isolating high-quality DNA or RNA, which is critical for optimal results [91]. Extraction methods must be optimized for specific sample types. For example, the Maxwell RSC DNA FFPE Kit is suitable for FFPE tissues, while the Maxwell RSC Blood DNA Kit and simplyRNA Cells Kit are appropriate for cytology specimens [89]. Nucleic acid quantification and quality assessment are performed using fluorometry (e.g., Qubit) and spectrophotometry (e.g., NanoDrop) [89]. Quality metrics are crucial, with DNA integrity measured via DNA Integrity Number (DIN) on a TapeStation and RNA quality assessed via RNA Integrity Number (RIN) on a Bioanalyzer [89].
Library Preparation and Sequencing
For hybrid capture-based panels (e.g., the Hedera Profiling 2 liquid biopsy test), library preparation involves enzymatic shearing of DNA to ~400 bp, barcoding with unique indices, and hybridization with biotinylated probes targeting the regions of interest [93] [90]. For amplicon-based panels (e.g., LCCP), PCR primers are used to amplify the target regions directly [89]. After library preparation and quality control, sequencing is performed on platforms such as the Illumina MiSeq or Ion Torrent PGM, with the number of sequencing cycles determining the read length [93] [89]. The coverage/depth of sequencing (number of times a base is read) must be sufficient to ensure accurate variant detection, with higher coverage increasing accuracy [91].
Figure 1: Overall Workflow for NGS Oncology Panel Validation
Establishing Analytical Performance Metrics
Accuracy, Sensitivity, and Specificity
Accuracy is assessed by comparing NGS results to a reference method across all variant types. The key metrics are Positive Percentage Agreement (PPA, equivalent to sensitivity) and Positive Predictive Value (PPV) [88]. For example, the Hedera Profiling 2 liquid biopsy assay demonstrated a PPA of 96.92% and PPV of 99.67% for SNVs/Indels in reference standards with variants at 0.5% allele frequency, and 100% for fusions [90].
Limit of Detection (LOD) studies determine the lowest variant allele frequency (VAF) an assay can reliably detect. This is established by testing serial dilutions of known variants. High-sensitivity panels like the LCCP have demonstrated LODs as low as 0.14% for EGFR exon-19 deletion and 0.20% for KRAS G12C [89]. The LOD should be confirmed for each variant type the assay claims to detect.
Precision and Reproducibility
Precision encompasses both repeatability (same operator, same run, same instrument) and reproducibility (different operators, different runs, different days, different instruments) [88]. A minimum of three different runs with at least two operators and multiple instruments (if available) should be performed using samples with variants spanning the assay's reportable range, particularly near the established LOD.
Table 2: Key Analytical Performance Metrics and Target Thresholds
| Performance Characteristic | Target Threshold | Experimental Approach |
|---|---|---|
| Positive Percentage Agreement (PPA/Sensitivity) | ≥95% for SNVs/Indels [90] | Comparison against orthogonal method (e.g., Sanger sequencing, digital PCR) using reference materials and clinical samples. |
| Positive Predictive Value (PPV/Specificity) | ≥99.5% [90] | Evaluation of false positive rate in known negative samples and reference materials. |
| Limit of Detection (LOD) | Defined per variant type (e.g., 0.1%-1% VAF) [89] | Testing serial dilutions of known positive samples to determine the lowest VAF detectable with ≥95% PPA. |
| Precision (Repeatability & Reproducibility) | 100% concordance for major variants | Multiple replicates across different runs, operators, days, and instruments. |
| Reportable Range | 100% concordance for expected genotypes | Testing samples with variants across the dynamic range of allele frequencies and different genomic contexts. |
Bioinformatic Pipeline Validation
The bioinformatics pipeline, including base calling, demultiplexing, alignment, and variant calling, requires rigorous validation [93] [88]. Key steps include:
- Alignment: Mapping sequences to the correct reference genome (GRCh38 recommended for new projects) [92].
- Variant Calling: Using established algorithms for different variant types (SNVs, indels, CNAs, fusions). Parameters must be optimized and locked down before validation [88].
- Filtering: Implementing filters based on depth, quality scores, and population frequency to reduce false positives [46].
The entire pipeline must be validated as a whole, as errors can occur at any step. The validation should confirm that the pipeline correctly identifies variants present in the reference samples and does not generate excessive false positives in negative controls.
Quality Control and Ongoing Monitoring
Run-Level and Sample-Level Controls
Each sequencing run should include positive and negative controls to monitor performance. A no-template control (NTC) detects contamination, while a positive control with known variants verifies the entire workflow is functioning correctly [88]. For hybridization capture-based methods, a normal human DNA control (e.g., from a cell line like NA12878) can be used to evaluate background noise, capture efficiency, and uniformity [88].
Sample-level QC metrics are critical for determining sample adequacy. These include:
- DNA/RNA Quantity and Quality: Measurements from Qubit, NanoDrop, and integrity numbers (DIN, RIN) [89].
- Tumor Purity: Pathologist-estimated tumor cell fraction [88].
- Sequencing Metrics: Total reads, on-target rate, mean depth of coverage, and uniformity [46] [91]. Minimum coverage should be established during validation (often 100x-500x for tissue, higher for liquid biopsy) to ensure reliable variant detection at the LOD.
Figure 2: Quality Control Checks for NGS Oncology Testing
The Scientist's Toolkit: Essential Research Reagents
Table 3: Key Research Reagent Solutions for NGS Oncology Panel Validation
| Reagent / Material | Function | Example Products / Notes |
|---|---|---|
| Reference Cell Lines & Materials | Provide known genotypes for accuracy, sensitivity, and LOD studies. | Commercially available characterized cell lines (e.g., Coriell Institute) or synthetic reference standards (e.g., Seraseq, Horizon Discovery). |
| Nucleic Acid Stabilizers | Preserve DNA/RNA in liquid-based cytology specimens; inhibit nuclease activity. | Ammonium sulfate-based stabilizers (e.g., GM tube [89]). |
| Library Prep Kits | Prepare sequencing libraries via amplicon or hybrid capture methods. | Ion Xpress Plus (Fragment Library) [93], Oncomine Dx Target Test [89], Illumina kits. |
| Target Enrichment Probes | Biotinylated oligonucleotides that hybridize to and capture genomic regions of interest. | Custom designs via tools (e.g., Nonacus Panel Design Tool [92]); 120 bp probes common. |
| Sequencing Controls | Monitor workflow performance and detect contamination. | No-template controls (NTC), positive control samples with known variants. |
| Bioinformatic Tools | For alignment, variant calling, annotation, and data interpretation. | Open-source (e.g., BWA, GATK) or commercial software; pipelines must be validated [93] [88]. |
Successful implementation of a clinically validated NGS oncology panel requires meticulous attention to pre-analytical, analytical, and post-analytical phases. The process begins with clear definition of the test's intended use and comprehensive validation following an error-based approach that addresses all potential failure points [88]. The resulting data establishes the test's performance specifications, which must be consistently monitored through robust quality control procedures.
As NGS technology evolves, these guidelines provide a foundation for ensuring data quality and clinical utility. The adoption of validated NGS panels in oncology ultimately empowers personalized medicine, ensuring that patients receive accurate molecular diagnoses and appropriate targeted therapies based on the genetic profile of their cancer [89].
Comparing Technical Performance of Different NGS Assays
Next-generation sequencing (NGS) has revolutionized genomic analysis by enabling the rapid, high-throughput sequencing of DNA and RNA. However, the performance characteristics of different NGS assays vary significantly based on their underlying methodologies, impacting their suitability for specific research applications. For chemogenomics beginners and drug development professionals, understanding these technical differences is crucial for selecting the appropriate assay to address specific biological questions. This guide provides a comprehensive comparison of major NGS assay types—targeted NGS, metagenomic NGS (mNGS), and amplicon-based NGS—focusing on their analytical performance, applications, and implementation within the standard NGS workflow.
The fundamental NGS workflow consists of four key steps, regardless of the specific assay type: nucleic acid extraction, library preparation, sequencing, and data analysis [35] [38] [36]. Variations in the library preparation step primarily differentiate these assays, particularly through the methods used to enrich for genomic regions of interest. This enrichment strategy profoundly influences performance metrics such as sensitivity, specificity, turnaround time, and cost, all critical factors in experimental design for precision medicine and oncology diagnostics [94] [95].
Key NGS Assay Types and Their Methodologies
Metagenomic NGS (mNGS)
Metagenomic NGS (mNGS) is a hypothesis-free approach that sequences all nucleic acids in a sample, enabling comprehensive pathogen detection and microbiome analysis without prior knowledge of the organisms present [96]. In a recent comparative study of lower respiratory infections, mNGS identified the highest number of microbial species (80 species) compared to targeted methods, demonstrating its superior capability for discovering novel or unexpected pathogens [96]. However, this broad detection power comes with trade-offs: mNGS showed the highest cost ($840 per sample) and the longest turnaround time (20 hours) among the methods compared [96]. The mNGS workflow involves extensive sample processing to remove host DNA, which increases complexity and time requirements.
Targeted NGS Assays
Targeted NGS assays enrich specific genomic regions of interest before sequencing, providing higher sensitivity for detecting low-frequency variants while reducing sequencing costs and data analysis burdens. There are two primary enrichment methodologies:
Capture-Based Targeted NGS
This method uses biotinylated probes to hybridize and capture specific DNA regions of interest. A recent clinical study demonstrated that capture-based tNGS outperformed both mNGS and amplification-based tNGS in diagnostic accuracy (93.17%) and sensitivity (99.43%) for lower respiratory infections [96]. This format allows for the identification of genotypes, antimicrobial resistance genes, and virulence factors, making it particularly suitable for routine diagnostic testing where high sensitivity and comprehensive genomic information are required [96].
Amplification-Based Targeted NGS (Amplicon Sequencing)
Amplification-based targeted NGS utilizes panels of primers to amplify specific genomic regions through multiplex PCR. This approach is particularly useful for situations requiring rapid results with limited resources [96]. However, the same study noted that amplification-based tNGS exhibited poor sensitivity for both gram-positive (40.23%) and gram-negative bacteria (71.74%), though it showed excellent specificity (98.25%) for DNA virus detection [96]. This makes it a suitable alternative when resource constraints are a primary consideration and the pathogen of interest is likely to be amplified efficiently by the primer panel.
Technical Performance Comparison
Table 1: Comparative Performance of Different NGS Assay Types
| Performance Metric | Metagenomic NGS (mNGS) | Capture-Based Targeted NGS | Amplification-Based Targeted NGS |
|---|---|---|---|
| Number of Species Identified | 80 species [96] | 71 species [96] | 65 species [96] |
| Cost per Sample | $840 [96] | Lower than mNGS | Lowest among the three [96] |
| Turnaround Time | 20 hours [96] | Shorter than mNGS | Shortest among the three [96] |
| Sensitivity | High for diverse pathogens | 99.43% [96] | 40.23% (gram-positive), 71.74% (gram-negative) [96] |
| Specificity | Varies with pathogen | Lower than amplification-based for DNA viruses [96] | 98.25% (DNA viruses) [96] |
| Best Application | Rare pathogen detection, hypothesis-free exploration [96] | Routine diagnostic testing [96] | Resource-limited settings, rapid results [96] |
Table 2: Comparison of Targeted NGS and Digital PCR for Liquid Biopsies
| Performance Metric | Targeted NGS | Multiplex Digital PCR |
|---|---|---|
| Concordance | 95% (90/95) with dPCR [94] | 95% (90/95) with tNGS [94] |
| Correlation (R²) | 0.9786 [94] | 0.9786 [94] |
| Multiplexing Capability | High (multiple genes simultaneously) [94] | Limited compared to NGS [94] |
| Detection of Novel Variants | Yes (e.g., PIK3CA p.P539R) [94] | Requires assay redesign [94] |
| Best Application | Multigene analysis, novel variant discovery [94] | High-sensitivity detection of known variants [94] |
Experimental Protocols and Methodologies
Protocol: Targeted NGS for Liquid Biopsy Analysis
The following protocol is adapted from a study comparing targeted NGS against multiplex digital PCR for detecting somatic mutations in plasma circulating cell-free DNA (cfDNA) from patients with metastatic breast cancer [94]:
Sample Collection and Nucleic Acid Extraction:
- Collect blood samples in EDTA-containing tubes from patients with metastatic breast cancer at disease progression.
- Process plasma within 2 hours of collection by double centrifugation (1,600 × g for 10 minutes, then 16,000 × g for 10 minutes).
- Extract cfDNA from 1-4 mL of plasma using the QIAamp Circulating Nucleic Acid Kit (Qiagen). Elute in 30-50 μL of elution buffer.
- Quantify cfDNA using a fluorometric method (e.g., Qubit dsDNA HS Assay Kit) [94] [38].
Library Preparation:
- Use the Plasma-SeqSensei Breast Cancer NGS assay (Sysmex Inostics) according to manufacturer's instructions.
- Fragment 4-43 ng of cfDNA to an optimal size of 200-500 bp [46].
- Ligate adapters containing unique molecular identifiers (UMIs) to both ends of DNA fragments using reduced-cycle amplification [46].
- For targeted enrichment, hybridize libraries with biotinylated probes targeting ERBB2, ESR1, and PIK3CA genes.
- Capture target regions using streptavidin-coated magnetic beads [94].
Sequencing:
- Quantify the final library using qPCR and load onto an Illumina NextSeq 500 system.
- Sequence using a 75-base pair single-end approach with a minimum sequencing depth of 50,000x per sample [94].
- Include positive and negative controls in each sequencing run to monitor performance.
Data Analysis:
- Demultiplex sequencing data based on unique barcodes [46] [36].
- Align sequences to the human reference genome (hg38) using Burrows-Wheeler Aligner [96].
- Apply UMI-based error correction to distinguish true somatic mutations from PCR and sequencing errors.
- Call variants with a minimum mutant allele frequency of 0.14% based on validation studies [94].
Protocol: Metagenomic NGS for Pathogen Detection
The following protocol is adapted from a comparative study of metagenomic and targeted sequencing methods in lower respiratory infection [96]:
Sample Processing and Nucleic Acid Extraction:
- Collect bronchoalveolar lavage fluid (BALF) samples in sterile screw-capped cryovials.
- Extract DNA from 1 mL BALF samples using QIAamp UCP Pathogen DNA Kit (Qiagen) according to manufacturer's instructions.
- Remove human DNA using Benzonase (Qiagen) and Tween20 (Sigma) to increase microbial sequencing sensitivity [96].
- For RNA pathogens, extract total RNA using QIAamp Viral RNA Kit, followed by ribosomal RNA removal using Ribo-Zero rRNA Removal Kit (Illumina) [96].
Library Preparation:
Sequencing and Analysis:
- Sequence libraries on Illumina NextSeq 550Dx with 75-bp single-end reads.
- Generate approximately 20 million reads per sample for sufficient pathogen coverage [96].
- Process raw data with Fastp to remove adapter sequences, ambiguous nucleotides, and low-quality reads.
- Remove human sequence data by mapping to human reference genome (hg38).
- Identify microbial reads by alignment to comprehensive pathogen databases.
- For pathogens with background in negative controls, use a reads per million (RPM) ratio threshold of ≥10 (RPMsample/RPMNTC) for positive detection [96].
Essential Research Reagent Solutions
Successful implementation of NGS assays requires careful selection of reagents and tools at each workflow step. The following table outlines key solutions for developing robust NGS assays:
Table 3: Essential Research Reagent Solutions for NGS Assays
| Reagent/Tool | Function | Application Examples |
|---|---|---|
| QIAamp Circulating Nucleic Acid Kit | Extracts and purifies cell-free DNA from plasma | Liquid biopsy analysis for oncology [94] |
| QIAamp UCP Pathogen DNA Kit | Extracts pathogen DNA while removing host contaminants | Metagenomic NGS for infectious disease [96] |
| Ribo-Zero rRNA Removal Kit | Depletes ribosomal RNA to enhance mRNA sequencing | Transcriptomic studies in host-pathogen interactions [96] |
| Plasma-SeqSensei Breast Cancer NGS Assay | Targeted NGS panel for breast cancer mutations | Detection of ERBB2, ESR1, and PIK3CA mutations in cfDNA [94] |
| SLIMamp Technology | Proprietary PCR-based target enrichment | Pillar Biosciences targeted NGS panels for oncology [95] |
| Ovation Ultralow System V2 | Library preparation from low-input samples | Metagenomic NGS with limited clinical samples [96] |
| Benzonase & Tween20 | Host DNA depletion to improve microbial detection sensitivity | mNGS for pathogen identification in BALF samples [96] |
NGS Workflow and Assay Selection
The following diagram illustrates the standard NGS workflow and decision points for selecting appropriate assay types based on research goals:
NGS Workflow and Assay Selection Points
Technical Considerations for NGS Assay Development
Critical Performance Challenges
Developing robust NGS assays requires addressing several technical challenges that impact data quality and reliability:
Library Preparation Efficiency: Library preparation is often considered the bottleneck of NGS workflows, with inefficiencies risking over- or under-representation of certain genomic regions [97]. Inefficient library prep can lead to inaccurate sequencing results and compromised data quality.
Signal-to-Noise Ratio: A high signal-to-noise ratio is essential for distinguishing true genetic variants from sequencing errors [97]. Factors such as library preparation errors, sequencing artifacts, and low-quality input material can diminish this ratio, reducing variant calling accuracy.
Assay Consistency: Achieving consistent results across sequencing runs is pivotal for research reliability and reproducibility [97]. Inconsistencies can manifest as variations in sequence coverage, discrepancies in variant calling, or differences in data quality.
Strategies for Optimizing NGS Performance
Automated Liquid Handling: Integration of non-contact liquid handlers like the I.DOT Liquid Handler can minimize pipetting variability, reduce cross-contamination risk, and improve assay reproducibility [97]. Automation is particularly valuable for high-throughput NGS applications.
Rigorous Quality Control: Implement QC measures at multiple workflow stages, including nucleic acid quality assessment (using UV spectrophotometry and fluorometric methods), library quantification, and sequencing control samples [38]. For accurate nucleic acid quantification—critical for library preparation—fluorometric methods are preferred over UV spectrophotometry [35].
Bioinformatics Standardization: Adopt standardized bioinformatics pipelines with appropriate normalization techniques to correct for technical variability [97]. This includes implementing duplicate read removal, quality score recalibration, and standardized variant calling algorithms.
The selection of an appropriate NGS assay requires careful consideration of performance characteristics relative to research objectives. Metagenomic NGS offers the broadest pathogen detection capability but at higher cost and longer turnaround times, making it ideal for discovery-phase research. Capture-based targeted NGS provides an optimal balance of sensitivity, specificity, and comprehensive genomic information for routine diagnostic applications. Amplification-based targeted NGS offers a resource-efficient alternative when targeting known variants with rapid turnaround requirements.
For chemogenomics researchers and drug development professionals, these technical comparisons provide a framework for selecting NGS methodologies that align with specific research goals, sample types, and resource constraints. As NGS technologies continue to evolve, ongoing performance comparisons will remain essential for maximizing the research and clinical value of genomic sequencing.
Determining Sensitivity and Specificity for Variant Detection
In the context of chemogenomics and drug development, next-generation sequencing (NGS) has become an indispensable tool for discovering genetic variants that influence drug response. The reliability of these discoveries, however, hinges on the analytical validation of the NGS assay, primarily measured by its sensitivity and specificity. Sensitivity represents the assay's ability to correctly identify true positive variants, while specificity reflects its ability to correctly identify true negative variants [98]. For a robust NGS workflow, determining these parameters is not merely a box-ticking exercise; it is a critical step that ensures the genetic data used for target identification and patient stratification is accurate and trustworthy. This guide provides an in-depth technical framework for researchers and scientists to validate variant detection in their NGS workflows.
Core Concepts and Calculations
Sensitivity and specificity are calculated by comparing the results of the NGS assay against a validated reference method, often called an "orthogonal method." This generates a set of outcomes that can be used to calculate performance metrics.
Key Definitions:
- True Positive (TP): A variant that is correctly detected by both the NGS assay and the orthogonal method.
- False Positive (FP): A variant called by the NGS assay but not confirmed by the orthogonal method.
- False Negative (FN): A variant confirmed by the orthogonal method but missed by the NGS assay.
- True Negative (TN): A genomic position confirmed to have no variant by the orthogonal method, and for which the NGS assay also reports no variant. In NGS, this is often inferred from the total number of bases or variants tested.
Formulae:
- Sensitivity = TP / (TP + FN) × 100%
- Specificity = TN / (TN + FP) × 100%
The following diagram illustrates the logical relationship between these outcomes and the final calculations.
Experimental Protocol for Validation
A rigorous validation requires a well-characterized set of samples with known variants. The protocol below outlines the key steps, from sample selection to data analysis [98] [99].
Step 1: Sample Selection and Characterization
- Samples: Use archived formalin-fixed, paraffin-embedded (FFPE) clinical tumor specimens and/or cell line pellets with known variants [98].
- Variant Spectrum: Select samples to encompass all variant types of interest: single-nucleotide variants (SNVs), small insertions/deletions (indels), large indels, copy number variants (CNVs), and gene fusions [98].
- Orthogonal Validation: All variants in the sample set must be previously identified and confirmed by analytically validated orthogonal methods, such as digital PCR, Sanger sequencing, fluorescent in situ hybridization (FISH), microarray-based comparative genomic hybridization (aCGH), or multiplex ligation-dependent probe amplification (MLPA) [98] [99].
- Tumor Content: Have a board-certified pathologist assess tumor content for clinical specimens, as this can affect variant allele frequency [98].
Step 2: NGS Testing and Orthogonal Confirmation
- Nucleic Acid Extraction: Isolate DNA and/or RNA from the samples. Assess the purity and quantity of the extracted nucleic acids using UV spectrophotometry and fluorometric methods [98] [35].
- Library Preparation: Fragment the nucleic acids and prepare sequencing libraries using the targeted NGS panel of choice. For the NCI-MATCH trial, the Oncomine Cancer Panel was used [98].
- Sequencing: Sequence the libraries on an appropriate NGS platform, such as an Illumina sequencer or a Personal Genome Machine (PGM), to a sufficient depth of coverage [98] [35].
- Blinded Analysis: Process the NGS data and call variants using a locked bioinformatics pipeline. The results should be compared blindly (separately and without prior knowledge) against the results from the orthogonal methods [99].
Step 3: Data Analysis and Calculation
- Concordance Assessment: For each variant type, tabulate the TP, FP, and FN results by comparing NGS calls to the orthogonal method results.
- Calculate Metrics: Use the formulae in Section 1 to calculate sensitivity and specificity for each variant type and overall.
- Determine Limit of Detection (LOD): Perform dilution studies to establish the lowest variant allele frequency at which the assay can reliably detect a variant. The NCI-MATCH assay established an LOD of 2.8% for SNVs and 10.5% for indels [98].
The following workflow summarizes the key experimental steps:
Performance Benchmarks and Data Presentation
Reporting validation data in a clear, structured format is essential for transparency. The following tables summarize quantitative performance data from large-scale validation studies, which can serve as benchmarks.
Table 1: Analytical Performance of the NCI-MATCH NGS Assay [98]
| Performance Metric | Variant Type | Result |
|---|---|---|
| Overall Sensitivity | All 265 known mutations | 96.98% |
| Overall Specificity | All variants | 99.99% |
| Reproducibility | All reportable variants | 99.99% (mean inter-operator concordance) |
| Limit of Detection | Single-Nucleotide Variants (SNVs) | 2.8% variant allele frequency |
| Insertions/Deletions (Indels) | 10.5% variant allele frequency | |
| Large Indels (gap ≥4 bp) | 6.8% variant allele frequency | |
| Gene Amplification | 4 copies |
Table 2: SV Detection Performance in a Large Clinical Cohort (n=60,000 samples) [99]
| Performance Metric | Variant Type | Result |
|---|---|---|
| Sensitivity | All Structural Variants (SVs) | 100% |
| Specificity | All Structural Variants (SVs) | 99.9% |
| Total SVs Detected & Validated | Coding/UTR SVs | 1,037 |
| Intronic SVs | 30,847 |
The Scientist's Toolkit
A successful validation experiment relies on specific reagents and tools. The following table details essential materials and their functions.
Table 3: Key Research Reagent Solutions for NGS Validation
| Item | Function |
|---|---|
| Formalin-Fixed Paraffin-Embedded (FFPE) Specimens | Provide clinically relevant samples with a known spectrum of variants for testing assay performance [98]. |
| Orthogonal Assays (digital PCR, MLPA, aCGH) | Serve as a reference standard to generate true positive and true negative calls for sensitivity/specificity calculations [98] [99]. |
| Targeted NGS Panel (e.g., Oncomine Cancer Panel) | A focused gene panel that enables deep sequencing of specific genes associated with disease and drug response [98]. |
| Nucleic Acid Extraction & QC Kits | Isolate pure DNA/RNA and ensure sample quality prior to costly library preparation [35]. |
| Structured Bioinformatics Pipeline | A locked, standardized software workflow for variant calling that ensures consistency and reproducibility across tests and laboratories [98]. |
For chemogenomics research aimed at linking genetic variants to drug response, establishing the sensitivity and specificity of your NGS assay is a foundational requirement. By following a rigorous experimental protocol that utilizes well-characterized samples and orthogonal confirmation, researchers can generate performance metrics that instill confidence in their genomic data. The high benchmarks set by large-scale studies demonstrate that robust and reproducible variant detection is achievable. Integrating this validated NGS workflow into the drug development pipeline ensures that decisions about target identification and patient stratification are based on reliable genetic information, ultimately de-risking the path to successful therapeutic interventions.
The Critical Role of Orthogonal Confirmatory Testing
In the context of next-generation sequencing (NGS) for chemogenomics research, orthogonal confirmatory testing refers to the practice of verifying results obtained from a primary NGS method using one or more independent, non-NGS-based methodologies. This approach is critical for verifying initial findings and identifying artifacts specific to the primary testing method [100]. As NGS technologies become more accessible and are adopted by beginners in drug discovery research, establishing confidence in sequencing results through orthogonal strategies has become an essential component of robust scientific practice.
The fundamental principle of orthogonal validation relies on the synergistic use of different methods to answer the same biological question. By employing techniques with disparate mechanistic bases and technological foundations, researchers can dramatically reduce the likelihood that observed phenotypes or variants result from technical artifacts or methodological limitations rather than true biological signals [101]. This multifaceted approach to validation is particularly crucial in chemogenomics, where sequencing results may directly inform drug discovery pipelines and therapeutic development strategies.
For NGS workflows specifically, orthogonal validation provides a critical quality control checkpoint that compensates for the various sources of error inherent in complex sequencing methodologies. From sample preparation artifacts to bioinformatic processing errors, NGS pipelines contain multiple potential failure points that can generate false positive or false negative results. Orthogonal confirmation serves as an independent verification system that helps researchers distinguish true biological findings from technical artifacts, thereby increasing confidence in downstream analyses and conclusions [102] [103].
The Position of Orthogonal Validation in the NGS Workflow
Orthogonal validation is not a standalone activity but rather an integrated component throughout a well-designed NGS workflow. For chemogenomics researchers, understanding where and how to implement confirmatory testing is essential for generating reliable data. The standard NGS workflow consists of multiple sequential steps, each with unique error profiles and corresponding validation requirements [35].
The following diagram illustrates how orthogonal validation integrates with core NGS workflow steps:
Critical Checkpoints for Orthogonal Testing
Within the NGS workflow, several critical checkpoints particularly benefit from orthogonal verification. After variant identification through bioinformatic analysis, confirmation via an independent method such as Sanger sequencing has traditionally been standard practice in clinical laboratories [102]. Additionally, after gene expression analysis using RNA-seq, confirmation of differentially expressed genes through quantitative PCR (qPCR) or digital PCR provides assurance that observed expression changes reflect biology rather than technical artifacts.
For functional genomics studies in chemogenomics, where NGS is used to identify genes influencing drug response, functional validation using independent gene perturbation methods is essential. This typically involves confirming hits identified through CRISPR screens with alternative modalities such as RNA interference (RNAi) or vice versa [104] [105]. Each validation point serves to increase confidence in results before progressing to more costly downstream experiments or drawing conclusions that might influence drug development decisions.
Key Methodologies for Orthogonal Confirmation
Genetic Variant Confirmation Methods
The confirmation of genetic variants identified through NGS represents one of the most established applications of orthogonal validation. For years, clinical laboratories have routinely employed Sanger sequencing as an orthogonal method to verify variants detected by NGS, significantly improving assay specificity [102]. This practice emerged because NGS pipelines are known to have both random and systematic errors at sequencing, alignment, and variant calling steps [103].
The necessity of orthogonal confirmation varies substantially by variant type and genomic context. Single nucleotide variants (SNVs) generally demonstrate high concordance rates (>99%) with orthogonal methods, while insertion-deletion variants (indels) and variants in low-complexity regions (comprised of repetitive elements, homologous regions, and high-GC content) show higher false positive rates and thus benefit more from confirmation [102] [103]. The following table summarizes key performance metrics for variant confirmation across different methodologies:
Table 1: Performance Metrics for Orthogonal Variant Confirmation
| Variant Type | Confirmation Method | Concordance Rate | Common Applications |
|---|---|---|---|
| SNVs | Sanger Sequencing | >99% [103] | Clinical variant reporting, disease association studies |
| Indels | Sanger Sequencing | >99% [103] | Clinical variant reporting, frameshift mutation validation |
| All Variants | ML-based Classification | 99.9% precision, 98% specificity [102] | High-throughput screening, research settings |
| Structural Variants | Optical Mapping | Varies by platform | Complex rearrangement analysis |
Recent advances in machine learning approaches have created new opportunities to reduce the burden of orthogonal confirmation while maintaining high accuracy. Supervised machine-learning models can be trained to differentiate between high-confidence variants (which may not require confirmation) and low-confidence variants (which require additional testing) using features such as read depth, allele frequency, sequencing quality, and mapping quality [102]. One study demonstrated that such models could reduce confirmatory testing of nonactionable, nonprimary SNVs by 85% and indels by 75% while maintaining high specificity [103].
Gene Expression Validation Techniques
In transcriptomic analyses, particularly in chemogenomics studies examining drug-induced gene expression changes, orthogonal validation of RNA-seq results is essential. While RNA-seq provides unprecedented comprehensive profiling capability, its results can be influenced by various technical factors including amplification biases, mapping errors, and normalization artifacts [100].
The most common orthogonal methods for gene expression validation include quantitative PCR (qPCR) and digital PCR, which offer highly precise, targeted quantification of specific transcripts of interest. These methods typically demonstrate superior sensitivity and dynamic range for specific targets compared to genome-wide sequencing approaches. Additionally, techniques such as in situ hybridization (including RNAscope) allow for spatial validation of gene expression patterns within tissue contexts, providing both quantitative and morphological confirmation [100].
For chemogenomics researchers, establishing correlation between expression changes detected by NGS and orthogonal methods is particularly important when identifying biomarker candidates or elucidating mechanisms of drug action. Best practices suggest selecting a subset of genes representing different expression level ranges (low, medium, and high expressors) and fold-change magnitudes for orthogonal confirmation to establish methodological consistency across the dynamic range.
Functional Validation Through Gene Modulation
In functional genomics applications of NGS, particularly in chemogenomics screens designed to identify genes modulating drug response, orthogonal validation through alternative gene perturbation methods is fundamental. The expanding toolkit of gene modulation technologies provides multiple independent approaches for confirming functional hits, each with complementary strengths and limitations [104] [105].
CRISPR-based technologies (including CRISPR knockout, CRISPR interference, and CRISPR activation) and RNA interference (RNAi) represent the most widely used approaches for functional validation. While both can reduce gene expression, they operate through fundamentally different mechanisms—CRISPR technologies generally target DNA while RNAi targets RNA—providing mechanistic orthogonality [104]. The table below compares key features of these orthogonal methods:
Table 2: Orthogonal Gene Modulation Methods for Functional Validation
| Feature | RNAi | CRISPRko | CRISPRi |
|---|---|---|---|
| Mode of Action | mRNA cleavage and degradation in cytoplasm [104] | Permanent DNA disruption via double-strand breaks [104] | Transcriptional repression without DNA cleavage [104] |
| Effect Duration | Short-term (2-7 days) with siRNAs to long-term with shRNAs [104] | Permanent, heritable gene modification [104] | Transient to long-term depending on delivery system [104] |
| Efficiency | ~75-95% target knockdown [104] | Variable editing (10-95% per allele) [104] | ~60-90% target knockdown [104] |
| Key Applications | Acute knockdown studies, target validation [105] | Complete gene knockout, essential gene identification [101] | Reversible knockdown, essential gene studies [105] |
| Advantages for Orthogonal Validation | Cytoplasmic action, temporary effect, different off-target profile [104] | DNA-level modification, permanent effect, different off-target profile [104] | No DNA damage, tunable repression, different off-target profile [104] |
The strategic selection of orthogonal methods should be guided by the specific research context. As noted by researchers, "If double-stranded DNA breaks are a concern, alternate technologies that suppress gene expression without introducing DSBs such as RNAi, CRISPRi, or base editing could be employed to validate the result" [101]. This approach was exemplified in a SARS-CoV-2 study where researchers used RNAi to screen putative sensors and subsequently employed CRISPR knockout for corroboration [101].
Experimental Design for Orthogonal Validation
Developing an Orthogonal Validation Strategy
Designing an effective orthogonal validation strategy requires careful consideration of the primary method's limitations and the selection of appropriate confirmation techniques. The first step involves identifying the most likely sources of error in the primary NGS experiment. For variant calling, this might include errors in low-complexity regions; for transcriptomics, amplification biases; and for functional screens, off-target effects [102] [104].
A robust orthogonal validation strategy typically incorporates methods that differ fundamentally from the primary approach. As emphasized in antibody validation, "an orthogonal strategy for antibody validation involves cross-referencing antibody-based results with data obtained using non-antibody-based methods" [100]. This principle extends to NGS applications—using detection methods with different underlying biochemical principles and analytical pipelines increases the likelihood of identifying methodological artifacts.
The defining criterion of success for an orthogonal strategy is consistency between the known or predicted biological role and localization of a gene/protein of interest and the resultant experimental observations [100]. This biological plausibility assessment, combined with technical confirmation through orthogonal methods, provides a comprehensive validation framework.
Practical Implementation Guide
Implementing orthogonal validation in a chemogenomics NGS workflow involves several practical considerations. First, researchers should determine the appropriate sample size for validation studies. For variant confirmation, this might involve prioritizing variants based on quality metrics, functional impact, or clinical relevance [102]. For gene expression studies, selecting a representative subset of genes across expression levels ensures validation across the dynamic range.
Second, the timing of orthogonal experiments should be considered. While some validations can be performed retrospectively using stored samples, others require prospective design. Functional validations typically require independent experiments conducted after initial NGS results are obtained [101].
Third, researchers must establish predefined success criteria for orthogonal validation. These criteria should include both technical metrics (e.g., concordance rates, correlation coefficients) and biological relevance assessments. Clear thresholds for considering a result "validated" prevent moving forward with false positive findings while ensuring promising results aren't prematurely abandoned due to overly stringent validation criteria.
Essential Research Reagents and Tools
Successful implementation of orthogonal validation strategies requires access to appropriate research reagents and tools. The following table catalogs key solutions essential for designing and executing orthogonal confirmation experiments in chemogenomics research:
Table 3: Essential Research Reagent Solutions for Orthogonal Validation
| Reagent/Tool Category | Specific Examples | Function in Orthogonal Validation |
|---|---|---|
| Gene Modulation Reagents | siRNA, shRNA, CRISPR guides [104] | Independent perturbation of target genes identified in NGS screens |
| Validation Assays | Sanger sequencing, qPCR reagents, in situ hybridization kits [100] [102] | Technical confirmation of NGS findings using different methodologies |
| Reference Materials | Genome in a Bottle (GIAB) reference standards [102] [103] | Benchmarking and training machine learning models for variant validation |
| Cell Line Models | Engineered cell lines with inducible Cas9/dCas9 [104] | Controlled functional validation of candidate genes |
| Bioinformatic Tools | Machine learning frameworks (e.g., STEVE) [103], off-target prediction algorithms [104] | Computational assessment of variant quality and reagent specificity |
For beginners establishing orthogonal validation capabilities, leveraging publicly available resources can significantly reduce startup barriers. The Genome in a Bottle Consortium provides benchmark reference materials and datasets that are invaluable for training and validating variant calling methods [102] [103]. Similarly, established design tools for CRISPR guides and siRNA reagents help minimize off-target effects, a common concern in functional validation studies [104] [105].
Orthogonal confirmatory testing represents an indispensable component of rigorous NGS workflows in chemogenomics research. By employing independent methodological approaches to verify key findings, researchers can dramatically increase confidence in their results while identifying methodological artifacts that might otherwise lead to erroneous conclusions. As NGS technologies continue to evolve and become more accessible to beginners, the principles of orthogonal validation remain constant—providing a critical framework for distinguishing true biological signals from technical artifacts.
The strategic implementation of orthogonal validation, particularly through the complementary use of emerging machine learning approaches and traditional experimental methods, offers a path toward maintaining the highest standards of scientific rigor while managing the practical constraints of time and resources. For chemogenomics researchers engaged in drug discovery and development, this multifaceted approach to validation provides the foundation upon which robust, reproducible, and clinically relevant findings are built.
Understanding Limits of Detection for Low-Frequency Variants
In the context of chemogenomics and drug development, the ability to accurately detect genetic mutations is fundamental for understanding drug mechanisms, discovering biomarkers, and profiling disease. Next-generation sequencing (NGS) provides a powerful tool for these investigations; however, a significant technical challenge emerges when researchers need to identify low-frequency variants—genetic alterations present in only a small fraction of cells or DNA molecules. Standard NGS technologies typically report variant allele frequencies (VAFs) as low as 0.5% per nucleotide [106]. Yet, many critical biological phenomena involve much rarer mutations. For instance, the expected frequency of independently arising somatic mutations in normal tissues can range from approximately 10⁻⁸ to 10⁻⁵ per nucleotide, while precursor events in disease or mutagenesis studies may occur at similarly low levels [106]. The discrepancy between the error rates of standard NGS workflows and the true biological signal necessitates specialized methods to push the limits of detection (LOD) and distinguish true low-frequency variants from technical artifacts.
Defining Key Concepts and the Fundamental Problem
Terminology and Biological Significance
- Variant Allele Frequency (VAF): The percentage of sequencing reads at a specific genomic position that contain a particular variant. This is a direct measurement from sequencing data [106].
- Mutation Frequency (MF): The number of different mutation events per nucleotide in a cell population. This is a biological measure of how often mutations occur independently [106].
- Limit of Detection (LOD): The lowest VAF or MF at which a variant can be reliably detected by a specific NGS method, with defined confidence and precision. One study defined the LOD as the allele frequency with a relative standard deviation (RSD) value of 30% [107].
- Low-Frequency Variants: These can include:
- Somatic mutations in heterogeneous tumor samples [108].
- Circulating tumor DNA (ctDNA) in liquid biopsies, which is highly diluted by cell-free DNA (cfDNA) from non-cancer cells [109].
- Mutations induced by low-dose genotoxic agents in toxicology studies [106].
- Subclonal mutations in evolving cancers or pre-cancerous tissues [106].
A critical concept often overlooked is the distinction between mutations that arise independently and those that are identical due to clonal expansion. A clone descended from a single mutant cell will carry the same mutation, inflating its VAF without representing a higher rate of independent mutation events. Therefore, it is essential for studies to report whether they are counting only different mutations (minimum independent-mutation frequency, MFminI) or all observed mutations including recurrences (maximum independent-mutation frequency, MFmaxI), the latter of which may reflect clonal expansion [106].
The Error Rate Barrier
The principal barrier to detecting low-frequency variants is the combined error rate from the sequencing instrument itself, errors introduced during polymerase chain reaction (PCR) amplification, and DNA damage present on the template strands [106]. The background error rate of standard Illumina sequencing is a VAF of approximately 5 × 10⁻³ per nucleotide, which is at least 500-fold higher than the average expected mutation frequency across a gene for many induced mutations [106]. Without sophisticated error suppression, even variants with a VAF of 0.5% - 1% are usually spurious [106]. This problem is exacerbated when analyzing challenging sample types like formalin-fixed paraffin-embedded (FFPE) tissue, where fixation artifacts like cytosine deamination can further increase false-positive rates [108].
To overcome the error rate barrier, several innovative methods have been developed. These techniques primarily rely on consensus sequencing to correct for errors introduced during library preparation and sequencing. They can be broadly categorized based on how these consensus sequences are built.
Table 1: Categories of Ultrasensitive NGS Methods
| Method Category | Core Principle | Example Methods | Key Feature |
|---|---|---|---|
| Single-Strand Consensus | Sequences each original single-stranded DNA molecule multiple times and derives a consensus sequence to correct for errors. | Safe-SeqS, SiMSen-Seq [106] | Uses unique molecular tags (UMTs) to track individual molecules. Effective for reducing PCR and sequencing errors. |
| Tandem-Strand Consensus | Sequences both strands of the original DNA duplex as a linked pair. | o2n-Seq, SMM-Seq [106] | Provides improved error correction over single-strand methods. |
| Parent-Strand Consensus (Duplex Sequencing) | Individually sequences both strands of the DNA duplex and requires a mutation to be present in both complementary strands to be called a true variant. | DuplexSeq, PacBio HiFi, SinoDuplex, OPUSeq, EcoSeq, BotSeqS, Hawk-Seq, NanoSeq, SaferSeq, CODEC [106] | Considered the gold standard for ultrasensitive detection, achieving error rates as low as <10⁻⁹ per nt. |
These methods have enabled the quantification of VAF down to 10⁻⁵ at a nucleotide and mutation frequency in a target region down to 10⁻⁷ per nucleotide [106]. By analyzing a large number of genomic sites (e.g., >1 Mb) and forgoing VAF calculations for sites never observed twice, some methods can even quantify an MF of <10⁻⁹ per nucleotide or <15 errors per haploid genome [106].
Detailed Experimental Protocols for Key Methods
Molecular Barcoding and Bioinformatics Filtering (eVIDENCE)
The eVIDENCE workflow is a practical approach for identifying low-frequency variants in circulating tumor DNA (ctDNA) using a commercially available molecular barcoding kit (ThruPLEX Tag-seq) and a custom bioinformatics filter [109].
Workflow Diagram:
Step-by-Step Protocol:
Library Preparation and Sequencing:
- Extract cfDNA from plasma. For the cited study, a mean cfDNA concentration of 76.8 ng/mL was obtained, and 10 ng of cfDNA was used as input [109].
- Construct NGS libraries using the ThruPLEX Tag-seq kit (Takara Bio). This kit ligates UMTs and stem sequences to both ends of DNA molecules [109].
- Hybridize libraries to a custom capture panel targeting the genes of interest (e.g., 79 genes and the TERT promoter in the original study) [109].
- Perform sequencing on an Illumina platform to an average coverage of ~6,800x. After duplicate removal, the average sequencing depth was 550x in the cited study [109].
Bioinformatics Processing with eVIDENCE:
- Initial Processing: Map raw sequencing reads to the human reference genome (e.g., using BWA). Process the resulting BAM file with Connor or a similar tool to generate consensus sequences based on UMTs [109].
- Variant Calling and Filtering: Perform an initial variant call on the processed BAM file. This step typically identifies an overwhelming number of candidate variants (e.g., 36,500 SNVs and 9,300 indels across 27 samples in the original study), many of which are false positives [109].
- eVIDENCE Filtering (Two-Step Approach):
- Step 1 (Re-alignment): Remove UMT and stem sequences from the alignment match region in the raw BAM file, as mismatches can be introduced here. Create new FASTQ files and re-map to the reference genome to generate a new, cleaner BAM file [109].
- Step 2 (UMT Family Consensus): From the new BAM file, extract reads covering each candidate variant and group them into "UMT families" (reads sharing the same UMT, representing a single original molecule). If any UMT family contains two or more reads that do not support the candidate variant, the candidate is discarded as a technical artifact [109].
This method was successfully used to identify variants with VAFs as low as 0.2% in cfDNA from hepatocellular carcinoma patients, with high validation success in a subset of tested variants [109].
Estimating In-House LOD for Whole-Exome Sequencing
For laboratories performing whole-exome sequencing (WES), it is critical to empirically determine the method's LOD to set a reliable cutoff threshold for low-frequency variants. The following protocol outlines a simple method for this estimation [107].
Workflow Diagram:
Step-by-Step Protocol:
Obtain Reference Material: Use a reference genomic DNA sample containing known mutations whose allele frequencies have been pre-validated by an orthogonal, highly accurate method like droplet digital PCR (ddPCR). The study used a sample with 20 mutations with AFs ranging from 1.0% to 33.5% [107].
Replicate Sequencing: Independently perform WES on this reference material multiple times, including the entire workflow starting from library preparation. The cited study used quadruplicate technical replicates [107].
Data Downsampling and Analysis: After sequencing, randomly downsample the total sequencing data to create datasets of different sizes (e.g., 5, 15, 30, and 40 Gbp). For each data size:
- Call variants and record the measured AF (WES-AF) for each pre-validated mutation in each replicate.
- For each mutation, calculate the mean WES-AF and the % relative standard deviation (%RSD) across the technical replicates. The %RSD represents the precision of the measurement.
- Confirm a significant association between the mean WES-AFs and the ddPCR-validated AFs to ensure measurement accuracy [107].
LOD Calculation:
- Plot the %RSD values against the mean WES-AFs for all mutations at a given sequencing data size.
- Due to data scatter, calculate a moving average (e.g., 3, 5, or 7 adjacent data points) of the %RSD values to create a smooth curve.
- Define the LOD as the allele frequency that corresponds to an RSD of 30% on this moving average curve. This definition means that at the LOD, the standard deviation is one-third of the mean AF, providing a statistically useful level of precision [107].
- Using this method, one study estimated the LOD for WES to be between 5% and 10% with a sequencing data size of 15 Gbp or more [107].
The Scientist's Toolkit: Essential Reagents and Materials
Successful detection of low-frequency variants depends on the use of specialized reagents and materials throughout the NGS workflow.
Table 2: Key Research Reagent Solutions for Low-Frequency Variant Detection
| Item | Function/Description | Key Considerations |
|---|---|---|
| Molecular Barcoding Kits(e.g., ThruPLEX Tag-seq) | Attach unique identifiers to individual DNA molecules before amplification, allowing bioinformatic consensus building and error correction. | Essential for single-strand consensus methods like eVIDENCE. Reduces false positives from PCR and sequencing errors [109]. |
| Targeted Capture Panels | Enrich for specific genomic regions of interest (e.g., cancer-related genes) prior to sequencing, enabling deeper coverage at lower cost. | Crucial for achieving the high sequencing depth (>500x) required to detect low-VAF variants. Can be customized or purchased as pre-designed panels [109] [108]. |
| High-Fidelity DNA Polymerases | Enzymes used during library amplification that have high accuracy, reducing the introduction of errors during PCR. | Minimizes the baseline error rate introduced during the wet-lab steps of the workflow. |
| Reference Genomic DNA | A DNA sample with known, pre-validated mutations at defined allele frequencies (e.g., validated by ddPCR). | Serves as a critical positive control for validating assay performance and empirically determining the in-house LOD [107]. |
| Ultra-deep Sequencing Platforms | NGS platforms capable of generating the massive sequencing depth required for rare variant detection. | Targeted panels often require coverage depths of 500x to >100,000x, depending on the desired LOD [109] [108]. |
Data Presentation and Analysis
Quantitative Comparison of Method Performance
The performance of different methods can be quantitatively assessed based on their achievable LOD and the type of variants they can detect.
Table 3: Performance Comparison of Ultrasensitive NGS Methods
| Method / Approach | Reported LOD for VAF or MF | Variant Types Detected | Notable Applications |
|---|---|---|---|
| Standard NGS (Illumina) | ~0.5% VAF [106] | SNVs, Indels | General variant screening, germline mutation detection. |
| WES with LOD Estimation [107] | 5-10% VAF (at 15 Gbp data) | SNVs, Indels | Comprehensive analysis of coding regions; quality control of cell substrates. |
| eVIDENCE with Molecular Barcoding [109] | ≥0.2% VAF | SNVs, Indels, Structural Variants (HBV integration, TERT rearrangements) | ctDNA analysis in liquid biopsies (e.g., hepatocellular carcinoma). |
| Parent-Strand Consensus (e.g., Duplex Sequencing) [106] | VAF ~10⁻⁵; MF ~10⁻⁷ per nt (targeted); MF <10⁻⁹ per nt (genome-wide) | SNVs, Indels | Ultra-sensitive toxicology studies, mutation accumulation in normal tissues, studying low-level mutagenesis. |
| SVS for Structural Variants [110] | Detects unique somSVs using single supporting reads (via ultra-low coverage) | Large Deletions, Insertions, Inversions, Translocations | Quantitative assessment of clastogen-induced SV frequencies in primary cells. |
Analysis of Mutational Spectra
Advanced ultrasensitive methods allow for the analysis of mutation spectra induced by various agents. For example, the SVS method revealed that bleomycin and etoposide, two clastogenic compounds, induce structural variants with distinct characteristics. Bleomycin preferentially produced translocations, while etoposide induced a higher fraction of inversions [110]. Furthermore, clastogen-induced SVs were found to be enriched for microhomology (4.9% and 3.9% for BLM and ETO, respectively) at their junction points compared to germline SVs, suggesting the involvement of microhomology-mediated end joining in their repair [110]. These findings highlight how these methods can provide insights into the mechanisms of mutagenesis.
Accurately understanding the limits of detection for low-frequency variants is not merely a technical exercise but a fundamental requirement for robust research in chemogenomics and drug development. The choice of methodology—from wet-lab protocols like molecular barcoding and duplex sequencing to robust bioinformatic filters like eVIDENCE and empirical LOD estimation—directly determines the biological signals a researcher can reliably detect. As the field moves towards increasingly sensitive applications, such as minimal residual disease monitoring, early cancer detection from liquid biopsies, and precise assessment of genotoxic risk, the adoption of these ultrasensitive NGS methodologies will be paramount. By rigorously applying these techniques and understanding their limitations, researchers can generate more accurate, reproducible, and biologically meaningful data, ultimately accelerating the pace of discovery and therapeutic development.
Conclusion
Mastering the NGS workflow is fundamental to leveraging its full potential in chemogenomics and personalized medicine. A successful strategy integrates a solid understanding of core principles with a meticulously optimized wet-lab process, rigorous data analysis, and thorough assay validation. As NGS technology continues to evolve, future directions will likely involve greater workflow automation, the integration of long-read sequencing, and more sophisticated bioinformatic tools. These advancements promise to further unlock the power of genomics, accelerating drug discovery and enabling more precise therapeutic interventions based on a patient's unique genetic profile.
References
- 1. Next-Generation Sequencing (NGS) | Explore the technology [https://www.illumina.com/science/technology/next-generation-sequencing.html]
- 2. What is next generation sequencing? - PMC [https://pmc.ncbi.nlm.nih.gov/articles/PMC3841808/]
- 3. Comparison of Next-Generation Sequencing Systems - PMC [https://pmc.ncbi.nlm.nih.gov/articles/PMC3398667/]
- 4. Massive parallel sequencing [https://en.wikipedia.org/wiki/Massive_parallel_sequencing]
- 5. NGS for Beginners | Learn the basics of NGS [https://www.illumina.com/science/technology/next-generation-sequencing/beginners.html]
- 6. How Next Generation Sequencing Works: Beginner's Guide [https://www.idtdna.com/page/support-and-education/decoded-plus/what-is-next-generation-sequencing/]
- 7. Comparison of DNA Quantification Methods for Next ... [https://www.nature.com/articles/srep24067]
- 8. Sanger Sequencing vs. Next-Generation Sequencing (NGS) [https://www.cd-genomics.com/resource-sanger-sequencing-vs-next-generation-sequencing.html]
- 9. Sanger Sequencing: Introduction, Workflow, and Applications [https://www.cd-genomics.com/resource-sanger-sequencing-introduction-workflow-and-applications.html]
- 10. Next-Generation Sequencers vs. Sanger ... [https://www.labx.com/resources/next-generation-sequencers-vs-sanger-sequencers-key-differences/5597]
- 11. The Future of Sanger Sequencing: Technical Development ... [https://www.cd-genomics.com/blog/sanger-sequencing-technology-innovation/]
- 12. NGS vs Sanger Sequencing [https://www.illumina.com/science/technology/next-generation-sequencing/beginners/advantages/ngs-vs-sanger.html]
- 13. Cost of NGS | Comparisons and budget guidance [https://www.illumina.com/science/technology/next-generation-sequencing/beginners/ngs-cost.html]
- 14. The $100 Genome: Where's the Limit? [https://frontlinegenomics.com/the-100-genome-wheres-the-limit/]
- 15. Next-Generation Sequencing Costs: The Sub $100 Genome [https://www.completegenomics.com/next-generation-sequencing-costs/]
- 16. DNA Sequencing: How to Choose the Right Technology [https://frontlinegenomics.com/dna-sequencing-how-to-choose-the-right-technology/]
- 17. Next-Generation Sequencing in Drug Discovery Market ... [https://www.cervicornconsulting.com/next-generation-sequencing-in-drug-discovery-market]
- 18. Next-Generation Sequencing in Drug Development [https://dscnextconference.com/next-generation-sequencing-in-drug-development-accelerating-precision-and-innovation/]
- 19. Platform: Ultimate Guide Next Generation Sequencing 2025 [https://lifebit.ai/blog/next-generation-sequencing-platform/]
- 20. What is Next - Generation ... | Thermo Fisher Scientific - US Sequencing [https://www.thermofisher.com/us/en/home/life-science/sequencing/sequencing-learning-center/next-generation-sequencing-information/ngs-basics/what-is-next-generation-sequencing.html]
- 21. NGS Data Analysis for Illumina Platform—Overview and ... [https://www.thermofisher.com/us/en/home/life-science/cloning/cloning-learning-center/invitrogen-school-of-molecular-biology/next-generation-sequencing/ngs-data-analysis-illumina.html]
- 22. ngs.plot: Quick mining and visualization of next-generation ... [https://bmcgenomics.biomedcentral.com/articles/10.1186/1471-2164-15-284]
- 23. Color Balance in Illumina Sequencing: Why It Still Matters [https://www.revvity.com/blog/color-balance-illumina-sequencing-why-it-still-matters]
- 24. PhiRx Indexed Control for XLEAP-SBS Color Balancing [https://seqwell.com/phirx-xleap-sbs-color-balancing/]
- 25. Panels, WES, or WGS: Which is Best for Rare Disease ... [https://3billion.io/blog/which-is-the-best-ngs-approach-for-rare-disease-diagnosis-panels-wes-or-wgs]
- 26. NGS for Drug Development [https://www.illumina.com/areas-of-interest/genomics-in-drug-development/ngs-for-drug-development.html]
- 27. Exome sequencing and targeted gene panels [https://pmc.ncbi.nlm.nih.gov/articles/PMC8485181/]
- 28. The Complete Guide to NGS Data Types and Formats [https://ngs101.com/the-complete-guide-to-ngs-data-types-and-formats-from-raw-reads-to-analysis-ready-files/]
- 29. Applications of NGS in Drug Research [https://www.psomagen.com/blog/next-generation-sequencing-revolutionizes-drug-discovery-and-development]
- 30. Sequencing depth vs. VAF sensitivity - NGS [https://www.ogt.com/ca/resources/ngs-resources-and-support/ngs-resources/sequencing-depth-vs-vaf-sensitivity/]
- 31. Sequencing Depth vs. Coverage: Key Metrics in NGS ... [https://3billion.io/blog/sequencing-depth-vs-coverage]
- 32. Standardization of Sequencing Coverage Depth in NGS [https://pmc.ncbi.nlm.nih.gov/articles/PMC6738196/]
- 33. Next-generation Sequencing Glossary | NGS terminology [https://www.illumina.com/science/technology/next-generation-sequencing/beginners/tutorials/glossary.html]
- 34. Next-generation sequencing and its clinical application [https://pmc.ncbi.nlm.nih.gov/articles/PMC6528456/]
- 35. NGS Workflow Steps - Next-Generation Sequencing [https://www.illumina.com/science/technology/next-generation-sequencing/beginners/ngs-workflow.html]
- 36. NGS Workflow Steps | IDT [https://eu.idtdna.com/pages/technology/next-generation-sequencing/workflow]
- 37. Sample Preparation for NGS – A Comprehensive Guide [https://frontlinegenomics.com/sample-preparation-for-ngs-a-comprehensive-guide/]
- 38. Next-Generation Sequencing Illumina Workflow–4 Key Steps [https://www.thermofisher.com/us/en/home/life-science/cloning/cloning-learning-center/invitrogen-school-of-molecular-biology/next-generation-sequencing/illumina-workflow.html]
- 39. Sequencing Sample Preparation: How to Get High-Quality DNA / RNA [https://www.cd-genomics.com/resource-sample-preparation-for-sequencing.html]
- 40. Next-Generation Sequencing Technology: Current Trends ... [https://pmc.ncbi.nlm.nih.gov/articles/PMC10376292/]
- 41. Preparation of DNA Sequencing Libraries for Illumina ... [https://www.thermofisher.com/us/en/home/life-science/cloning/cloning-learning-center/invitrogen-school-of-molecular-biology/next-generation-sequencing/dna-sequencing-preparation-illumina.html]
- 42. Library construction for next-generation sequencing [https://pmc.ncbi.nlm.nih.gov/articles/PMC4351865/]
- 43. Optimization of enzymatic fragmentation is crucial to maximize ... [https://bmcgenomics.biomedcentral.com/articles/10.1186/s12864-022-08316-y]
- 44. DNA Library Preparation [https://www.illumina.com/techniques/sequencing/ngs-library-prep/dna.html]
- 45. Which NGS DNA Library Prep Kit should you choose? [https://frontlinegenomics.com/which-ngs-dna-library-prep-kit-should-you-choose/]
- 46. Next Generation Sequencing (NGS): A Beginner's Guide [https://www.novogene.com/us-en/resources/blog/ngs-beginners-guide/]
- 47. Amplicon Sequencing vs. Hybridization Capture [https://www.cd-genomics.com/diseasepanel/amplicon-sequencing-vs-hybridization-capture-the-comparison-of-target-enrichment-methods-for-disease-panel.html]
- 48. Hybridization capture vs amplicon sequencing | IDT [https://www.idtdna.com/page/support-and-education/decoded-plus/targeted-sequencing-hybridization-capture-or-amplicon-sequencing/]
- 49. Target Enrichment Approaches for Next-Generation ... [https://pmc.ncbi.nlm.nih.gov/articles/PMC9318977/]
- 50. Understanding the Differences Between Amplicon-Based ... [https://diagnostech.co.za/understanding-the-differences-between-amplicon-based-and-hybrid-capture-based-ngs-target-enrichment/]
- 51. Target Enrichment | NGS-based hybrid capture method [https://www.illumina.com/techniques/sequencing/dna-sequencing/targeted-resequencing/target-enrichment.html]
- 52. Selecting the best NGS enrichment assay for your needs [https://www.ogt.com/us/resources/ngs-resources-and-support/ngs-resources/selecting-the-best-ngs-enrichment-assay-for-your-needs/]
- 53. Targeted Sequencing Approaches for NGS [https://www.thermofisher.com/us/en/home/life-science/sequencing/sequencing-learning-center/next-generation-sequencing-information/ngs-basics/targeted-sequencing-approaches.html]
- 54. Global NGS Target Enrichment Probe Market By Type, ... [https://www.marketsizeandtrends.com/report/ngs-target-enrichment-probe-market/]
- 55. NGS Target Enrichment Probe 2025-2033 Overview [https://www.archivemarketresearch.com/reports/ngs-target-enrichment-probe-302841]
- 56. Illumina Next-Generation Sequencing (NGS): Principles ... [https://www.cd-genomics.com/resource-illumina-ngs-principles-and-workflow.html]
- 57. 2-Channel SBS Technology | Faster sequencing and data ... [https://www.illumina.com/science/technology/next-generation-sequencing/sequencing-technology/2-channel-sbs.html]
- 58. Statistical guidelines for quality control of next-generation ... [https://pmc.ncbi.nlm.nih.gov/articles/PMC8408346/]
- 59. Understanding the Basics of NGS: From Mechanism to ... [https://pmc.ncbi.nlm.nih.gov/articles/PMC4633438/]
- 60. Biological Interpretation and Tertiary Analysis [https://www.illumina.com/informatics/biological-interpretation.html]
- 61. How to read a next-generation sequencing report—what ... [https://pmc.ncbi.nlm.nih.gov/articles/PMC9588890/]
- 62. Workflows — Nextflow documentation [https://www.nextflow.io/docs/latest/workflow.html]
- 63. Nextflow Best Practices - The Carpentries Incubator [https://carpentries-incubator.github.io/Pipeline_Training_with_Nextflow/07-Nextflow_Best_Practice/index.html]
- 64. How-to: NGS Quality Control [https://frontlinegenomics.com/how-to-ngs-quality-control/]
- 65. NGS Workflow and Fundamentals of Sample Preparation [https://www.enzo.com/note/ngs-workflow-and-fundamentals-of-sample-preparation/]
- 66. Library Preparation for Next-Generation Sequencing [https://sequencing.roche.com/global/en/article-listing/library-preparation-for-next-generation-sequencing-dealing-with-pcr-bias.html]
- 67. Reducing GC & PCR Bias in Whole-Genome Sequencing [https://www.revvity.com/blog/understanding-impact-gc-and-pcr-biases-whole-genome-sequencing]
- 68. Analyzing and minimizing PCR amplification bias in Illumina ... [https://pmc.ncbi.nlm.nih.gov/articles/PMC3188800/]
- 69. a systematic comparison of DNA library preparation kits ... [https://pmc.ncbi.nlm.nih.gov/articles/PMC4906846/]
- 70. 3 Innovations in Next-Generation Sequencing Sample Prep [https://dispendix.com/blog/3-innovations-in-next-generation-sequencing-sample-prep]
- 71. Automation in Genomics Workflows | How Labs Improve ... [https://www.labmanager.com/automation-in-genomics-workflows-driving-precision-efficiency-and-scale-34446]
- 72. How NGS Automation Improves Library Preparation ... [https://www.euformatics.com/blog-post/how-ngs-automation-improves-library-preparation-efficiency-and-accuracy]
- 73. Open-Source Bioinformatics Tools | For NGS Data [https://www.illumina.com/science/genomics-research/open-source-bioinformatics.html]
- 74. Bioinformatics Platform: Unlock Insights 2025 [https://lifebit.ai/blog/bioinformatics-platform-best-practices-2025/]
- 75. Next-generation Sequencing Library Preparation Market ... [https://www.precedenceresearch.com/next-generation-sequencing-library-preparation-market]
- 76. The 2025 Bioinformatics Toolkit: From Sample Prep to AI- ... [https://blog.omni-inc.com/blog/the-2025-bioinformatics-toolkit-from-sample-prep-to-ai-driven-analysis]
- 77. Key Strategies for Optimizing NGS Workflows [https://www.technologynetworks.com/genomics/articles/key-strategies-for-optimizing-ngs-workflows-395232]
- 78. Sequencing Consumables Market Size 2025 To 2034 [https://www.precedenceresearch.com/sequencing-consumables-market]
- 79. U.S. Next-generation Sequencing Library Preparation ... [https://www.biospace.com/press-releases/u-s-next-generation-sequencing-library-preparation-market-size-to-surpass-usd-2-237-13-million-by-2034]
- 80. Global Sequencing Consumables Market Forecast, 2025- ... [https://www.coherentmarketinsights.com/industry-reports/global-sequencing-consumables-market]
- 81. Clinical Metagenomic Next-Generation Sequencing for ... [https://pmc.ncbi.nlm.nih.gov/articles/PMC6345613/]
- 82. Metagenomic Next-Generation Sequencing in Infectious ... [https://pmc.ncbi.nlm.nih.gov/articles/PMC12384723/]
- 83. Metagenomic Sequencing: Strategies for Host DNA Removal [https://www.cd-genomics.com/microbioseq/resource-metagenomic-sequencing-host-dna-removal.html]
- 84. Optimization of Metagenomic Next-Generation Sequencing ... [https://pmc.ncbi.nlm.nih.gov/articles/PMC12436562/]
- 85. Seven-year performance of a clinical metagenomic next- ... [https://www.nature.com/articles/s41591-024-03275-1]
- 86. Metagenomic next-generation sequencing for concurrent ... [https://www.nature.com/articles/s41598-025-18812-2]
- 87. Deciphering the impact of contaminating microbiota in DNA ... [https://pmc.ncbi.nlm.nih.gov/articles/PMC12502690/]
- 88. Guidelines for Validation of Next-Generation Sequencing– ... [https://pmc.ncbi.nlm.nih.gov/articles/PMC6941185/]
- 89. Prospective multicenter validation of a next-generation ... [https://bmccancer.biomedcentral.com/articles/10.1186/s12885-025-14770-0]
- 90. Analytical Validation of a Pan-Cancer NGS Assay for In- ... [https://www.sciencedirect.com/science/article/pii/S152515782500220X]
- 91. NGS Sequencing Methods: A Comprehensive Beginner's Guide [https://mgi-tech.eu/solutions/ngs-beginers-guide]
- 92. Designing custom NGS panels | Panel Design Tool [https://nonacus.com/blog-get-great-coverage-for-the-genes-you-care-about/]
- 93. Next-generation sequencing of HIV-1 single genome amplicons [https://pmc.ncbi.nlm.nih.gov/articles/PMC6423504/]
- 94. Comparative performance of a targeted next-generation ... [https://www.sciencedirect.com/science/article/abs/pii/S1525157825002375]
- 95. Pillar Biosciences to Showcase NGS Research Insights at ... [https://www.pillarbiosci.com/2025/10/22/pillar-biosciences-to-showcase-ngs-research-insights-at-2025-amp-meeting/]
- 96. Comparative diagnostic performance of metagenomic and ... [https://www.nature.com/articles/s41598-025-11834-w]
- 97. From Bench to Breakthrough: Streamlining NGS Assay ... [https://dispendix.com/blog/ngs-assay-development-challenges]
- 98. Analytical Validation of the Next-Generation Sequencing ... [https://pmc.ncbi.nlm.nih.gov/articles/PMC5397672/]
- 99. Detection of structural variation using target captured next ... [https://www.nature.com/articles/s41436-018-0397-6]
- 100. Hallmarks of Antibody Validation: Orthogonal Strategy [https://www.cellsignal.com/about-us/approach-validation-principles/orthogonal-data?srsltid=AfmBOorGPFcYVVkVyICjRrwCg7-65z2qUXgTzNSoxXUCjYRVTaUb5FRD]
- 101. Orthogonal Validation in Genome Editing Discovery Work [https://www.genengnews.com/resources/orthogonal-validation-in-genome-editing-discovery-work/]
- 102. Determination of high-confidence germline genetic variants ... [https://pmc.ncbi.nlm.nih.gov/articles/PMC12326712/]
- 103. Reducing Sanger confirmation testing through false ... [https://www.nature.com/articles/s41436-021-01148-3]
- 104. Orthogonal Validation: A Means To Strengthen Gene ... [https://www.technologynetworks.com/genomics/articles/orthogonal-validation-a-means-to-strengthen-gene-editing-and-gene-modulation-research-377821]
- 105. Orthogonal Validation: A Multifaceted Approach to Robust ... [https://www.labcompare.com/10-Featured-Articles/593490-Orthogonal-Validation-A-Multifaceted-Approach-to-Robust-Gene-Function-Data-Generation/]
- 106. Next-Generation Sequencing Methodologies To Detect ... [https://pmc.ncbi.nlm.nih.gov/articles/PMC10843083/]
- 107. A simple method to estimate the in-house limit of detection for ... [https://bmcgenomdata.biomedcentral.com/articles/10.1186/s12863-020-00956-x]
- 108. NGS Basics for Cancer Research [https://www.thermofisher.com/us/en/home/life-science/sequencing/sequencing-learning-center/next-generation-sequencing-information/cancer-research/basics.html]
- 109. eVIDENCE: a practical variant filtering for low-frequency ... [https://www.nature.com/articles/s41598-019-51459-4]
- 110. Quantitative detection of low-abundance somatic structural ... [https://pmc.ncbi.nlm.nih.gov/articles/PMC4927357/]